


Services on Demand
Journal
Article
 text in
  English (pdf)
 Article in xml format
 Article references
 Send this article by e-mail
Indicators
-
 Cited by SciELO
 -
 Access statistics
Related links
-
 Similars in
SciELO
Similars in
SciELO
Share

 Permalink
Tecnología y ciencias del agua
On-line version ISSN 2007-2422
Tecnol. cienc. agua vol.11 n.1 Jiutepec Jan./Feb. 2020 Epub May 30, 2020
https://doi.org/10.24850/j-tyca-2020-01-10
Technical notes
Evolution of the common indices of detection and monitoring of meteorological droughts
1 Profesor jubilado de la Universidad Autónoma de San Luis Potosí, San Luis Potosí, México, campos_aranda@hotmail.com
Droughts are a recurrent natural phenomenon characterized by a decrease in precipitation. This condition can be aggravated by the demands of drinking water, irrigation and other uses. Meteorological Droughts (MD) imply a reduction in the amount and intensity of rainfall, as well as an increase in temperature and evaporation, since without clouds there is an increase in solar radiation. Drought indices are operating procedures that use the aforementioned climatic variables, seeking to quantify certain characteristics of the MD to assign a severity and thus be able to establish their start, development and termination, allowing their comparison in different climates. This paper describes chronologically how the most common detection and pursuit indices of MD have evolved, allowing their annual and monthly quantification. This compilation is useful to begin and advance in the study and characterization of the MD of a locality or a geographic region. It is recommended to progress in the study and the quantitative evaluation of MD, according to how the indexes are described here, since their historical evolution and their computational complexity coincide.
Keywords Meteorological droughts (MD); annual MD; monthly MD; drought indices (ISP; IA; RDIst; PDSI; IZC; SPI; SPEI and SPDI)
Las sequías son un fenómeno natural recurrente caracterizado por una disminución de la precipitación. Esta condición puede ser exacerbada por las demandas de agua potable, riego y otros usos. Las sequías meteorológicas (SM) implican una reducción en cantidad e intensidad de la lluvia, así como incrementos en la temperatura y evaporación, ya que aumenta la radicación solar al no haber nubosidad. Los índices de sequías son procedimientos operativos que emplean las variables climáticas citadas, los cuales buscan cuantificar ciertas características de las SM para asignar una severidad y así poder establecer su inicio, desarrollo y terminación, permitiendo con ello su comparación en climas diferentes. En este trabajo se describe cronológicamente cómo han evolucionado los índices más comunes de detección y seguimiento de las SM, para cuantificarlas cada año y en lapsos de varios meses. Lo anterior es útil para comenzar y avanzar en el estudio y caracterización de las SM de una localidad o de una región geográfica. Se recomienda progresar en el estudio y la evaluación cuantitativa de las SM, según como se describen los índices, pues su evolución histórica y complejidad computacional coinciden.
Palabras clave sequías meteorológicas (SM); SM anuales; SM mensuales; índices de sequías (ISP; IA; RDIst; PDSI; IZC; SPI; SPEI y SPDI)
Introduction
Droughts are recurrent extreme climatic events that occur in all the localities of the world, characterized by a lower precipitation than normal and whose duration covers several months or some years. Droughts are one of the main natural causes of damage in agriculture, in economic activities and in the environment. This evolution of its impacts creates its character of multiple time scales, which is caused by the delays that occur in the water use in different hydraulic systems, so that the scarcity of precipitation is first visible in rainfed agriculture, then in the irrigation supply, generation of hydroelectric power and other water uses and, finally, in social, economic and environmental damages. Therefore, droughts are classified as: meteorological, agricultural, hydrological and socio-economic. The latter, include environmental damage (Pandey, Sharma, Mishra, Singh, & Agarwal, 2008; Mishra & Singh, 2010; Fernández & Gironas, 2017).
Meteorological Droughts (SM, for its Spanish initials) of a zone is the lapse of months or years, during which the precipitation that occurs is lower than what commonly happens. Due to its slow evolution, it is difficult to pinpoint its beginning and end, as well as to estimate its severity and territorial extension characteristics. On the other hand, due to the sustained growth of water demand for all uses and the threat of climate change, in recent years the negative impacts of droughts have intensified (Panu & Sharma, 2002; Sene, 2010; Vicente-Serrano, Beguería, & López-Moreno, 2010; Fuchs, Svoboda, Wilhite, & Hayes, 2014).
Occurrence and severity of SM are related to regional climatic parameters; among the most striking are the average annual precipitation (PMA) and the average annual evapotranspiration potential (ETP). PMA is the atmospheric supply and depends mainly on the following eight geographical characteristics: latitude, orographic factors, oceanic currents, atmospheric wind circulation, proximity of oceans and large lakes, atmospheric pressure, color and texture of the terrestrial surface and atmospheric conditions of natural origin or human activities. In contrast, ETP is the atmospheric demand and depends predominantly on the following four atmospheric and physical characteristics: net solar radiation, environmental humidity deficit, surface roughness and leaf area index. ETP is closely related to daytime and nighttime air temperatures (Ponce, Pandey, & Ercan, 2000).
PMA and ETP are two climate variables that are related to deficiencies in the precipitation occurring during the SM. On the other hand, a drought index is a method based on statistical calculations that uses climate variables and seeks to quantify the SMs, thereby, enabling their comparison in different climates; and they also favor the development of correct and efficient mitigation actions for their negative impacts (Pandey et al., 2008; Sene, 2010; Fuchs et al., 2014).
The objective of this study is to briefly describe the evolution of the common SM indexes, from the detection of their annual values to the monthly values of various periods, starting with indexes that only used annual precipitation (PA), continuing with those that introduced the average temperature and reaching those that now use the ETP. Regarding the most recent indexes (PDSI, SPI, SPEI and SPDI) their operating procedures are not exposed, but it is indicated where they can be consulted and their approach or particularities are described and analyzed, highlighting their advantages.
Detection of annual SM
Technique based on PA
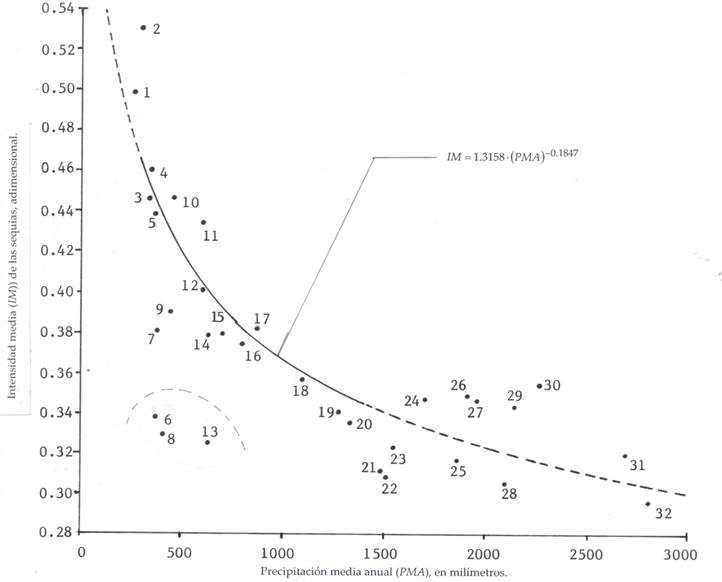
Pandey and Ramasastri (2001; 2002) established that when a PA is less than 75% of the annual average (PMA) in one year, an SM has occurred. The number of droughts (NS) per year, that is, the times when PA is less than 0.75 per PMA, divided by the size (n) of the series or sample of PA and expressed as a percentage, is actually its probability of occurrence (% O), since it meets the basic definition of probability: quotient between the number of cases favorable to the number of possible cases. These authors prefer to use the reciprocal (n/NS) and designate it average return period (PRP) in years of the SM. The drought severity indicator is its average intensity (IM), defined as the average relative deficit, whose expression is ((Ponce et al., 2000; Pandey & Ramasastri, 2001; Pandey & Ramasastri, 2002):
A graph with PMA on the abscissa and the IM in the ordinates usually shows an exponential decline or a hyperbolic curve. This graph constructed for a certain geographical region, allows the estimation in any locality of such area, of its IM of SMs, with only having the value of its PMA.
Campos-Aranda (2018c) processed 32 PA records of the state of San Luis Potosí, Mexico, with amplitudes ranging from 45 to 65 data and defined the graph shown in Figure 1. This method is the simplest procedure for characterizing the annual SMs.
Pedj Drought Index (ISP)
Elagib and Elhag (2011) indicate that the annual variability of the PA record or series can be detected and analyzed by means of its standardized anomaly index (IAE), defined by the following two expressions:
being PA the annual precipitation in millimeters, PMA its average value and DEP its standard deviation not biased, with n equal to the number of years of the record processed:
IAE of the annual average temperature (TM) series is calculated with two similar equations. D. A. Pedj proposed in Russia in 1975 an index to detect annual droughts that is defined by the difference between the IAE of the average temperature minus that of precipitation. The Pedj Drought Index (ISP) whose annual value classifies the climate as wet (ISP<0) or drought (ISP>0), was verified empirically, finding that it has a negative correlation with the anomaly of precipitation and varies directly with the anomaly of the average temperature, but the most important thing is that it captures both directions or trends. The annual slight, moderate, severe and extreme SMs are held as the ISP varies between 0 and 1, 1 and 2, 2 and 3 and more than 3, respectively (Elagib & Elhag, 2011).
Campos-Aranda (2018a) applied the ISP in the state of Zacatecas, Mexico, integrating 16 annual series with 65 values in the common period of 1950-2014; based on their statistical analysis, he establishes the local and regional behavior of the annual SMs. He concludes that the ISP is a simple and accurate technique to characterize the annual SMs; which incorporates at the average temperature.
Aridity Index (IA)
The United Nations Environmental Programme (UNEP) proposed at the beginning of the 1990s the PMA/ETP ratio to characterize the desert areas and called it the Dryness Index. Starting from this century, such quotient is called the Aridity Index (IA) and it defines the arid climates when IA varies between 0.200 and 0.050 and when the hyper-arid climates with IA is less than 0.050 (Elagib, 2009). The annual aridity index (IA = PA/ETP) has been used in studies of SM, due to the fact that it is conceptually correct to relate the supply and demand of the atmosphere. Due to its simplicity of calculation the IA has been used in regional studies and large territories (Elagib, 2009). Commonly, ETP estimation is made by means of empirical methods, such as those of Thornthwaite and Hargreaves-Samani, which use air temperature data (Vangelis, Tigkas, & Tsakiris, 2013; Campos-Aranda, 2016; Campos-Aranda, 2018b; Campos-Aranda, 2018d).
The chronological series of annual values of IA is ordered from highest to lowest, keeping the respective year and obtaining the median to define, with the values lower than it, the years with drought. Then, such data are used to assign percentages of types of SM (slight, moderate, severe and extreme) and find their respective years.
Campos-Aranda (2016) describes the statistical analyses made based on the IA in 16 rain-gauge stations of the state of Zacatecas, Mexico, in a common period of 65 years, to monitor the annual SM, in a timely and regional manner. IA represented a conceptual breakthrough when incorporating ETP; however, it has been replaced by the RDIst of the following subsection, which is applied in monthly periods.
Detection of monthly SM
Reconnaissance Drought Index (RDI)
Tsakiris and Vangelis (2005) present a generalization of the IA in the following two aspects: (1) it is applied in k periods of months and (2) is standardized. This led to a new ratio called RDI. Its calculation starts by evaluating the quotient (a i ) between the accumulated monthly precipitation and the respective potential evapotranspiration (ETP), in the k months considered as duration of the SM of each year i of the processed record. Tsakiris and Vangelis (2005), and Tsakiris, Tigkas, Vangelis and Pangalou (2007) find that the values of a i follow a Log-Normal distribution and then the Standardized RDI values are obtained with the following equation:
in which, y
i
is the natural logarithm of a
i
,
Campos-Aranda (2018a) contrasts the RDIst index with the ISP, in 16 rain-gauge stations in the state of Zacatecas, Mexico. The contrast was based on the percentages of each type of droughts and its total number. He suggests the systematic application of both indexes, to improve the estimation of the drought chronological series, oriented the latter to his forecast (Mishra & Singh, 2011).
Palmer Drought Severity Index (PDSI)
Proposed in the mid-sixties (Palmer, 1965), the Palmer PDSI makes a monthly balance of precipitation and ETP in the soil that considers it composed of two layers; whereby it is perhaps the first multivariate index (Hao & Singh, 2015). The PDSI has been criticized for not having a simple calculation, applying several empirical rules, not allowing to consider the duration in months of the SM and not being sufficiently sensitive to the changes induced in precipitation and temperature, when attempting to characterize future SMs according to the likely climate change of a locality or region ((Alley, 1984; Karl, 1986; Wells, Goddard, & Hayes, 2004; Ma et al., 2014).
China-Z Index (IZC)
IZC was introduced by the National Meteorological Center of China in the early 1990s, it assumes that monthly precipitation comes from a Pearson type III distribution and therefore uses the Wilson-Hilferty approach (Zelen & Severo, 1972) to relate to the statistical Z-Index (IEZ) with this index, according to the following expression (Wu, Hayes, Weiss, & Hu, 2001; Morid, Smakhtin, & Moghaddasi, 2006; Dogan, Berktay, & Singh, 2012):
being Cs k the coefficient of asymmetry, whose equation is:
in which x k,j is the precipitation of the mobile sequence j and of a duration k, in months. The mean and standard deviation of Equation 6 are:
The IEZ comes from the variable Normal standardized (Z) and is defined as:
Defined the duration of the SM in months (k) which can be 1, 3, 6, 9, 12, 18, 24, 30, 36, 48, 60 and 72, we start by obtaining all the possible sequences of such duration in the record, which are obtained as mobile sums. For example, for a seasonal drought with k = 4 the first sequence will be the sum of the month one to the fourth, the second sequence will be the sum of the month two to the fifth and so on. The number of sequences or data (NS) to process will be:
being NA the number of years of the complete record available (NA > 30), which usually starts in January and ends in December.
Campos-Aranda (2017) contrasts the results of the China-Z index (IZC) and the standardized precipitation index (SPI), in three dissimilar climatic locations in the state of San Luis Potosí, Mexico; he finds that their values are quite similar and it can be said that the first is a numerical simplification of the second. IZC is simpler to apply, but sometimes its calculation fails, when IEZ is negative and the Cs large, the parenthesis of the Equation 5 turns out negative.
Standardized Precipitation Index (SPI)
This index called SPI based on a probabilistic approach of monthly precipitation proposed by McKee, Doesken and Kleist (1993) has shown an efficient use of the available information; its main criticism lies in using only such data, ignoring other indicators of drought, such as temperature and ETP.
Calculated the mobile sums of duration k, the Mixed Gamma probability distribution function of two parameters is fitted to the series of NS (Equation 10) calculated, since such sample may contain zeros. Guttman (1999) proposes to use the Pearson type III distribution. Stagge, Tallaksen, Gudmundsson, Van Loon and Stahl (2015) ratify the use of the Mixed Gamma distribution. Then, a rational numerical approximation is used to convert the estimated cumulative probability with Mixed Gamma distribution, in the standardized Normal variable Z of zero mean and unit variance, which defines the SPI index. Definition of slight, moderate, severe and extreme SMs is made based on the numerical values cited for the RDIst; as in the IZC exposed and in the following SPEI and SPDI indices.
Cacciamani, Morgillo, Marchesi and Pavan (2007), and Campos-Aranda (2017) have exposed the mathematical formulation necessary for the calculation of the SPI. In contrast, Wu, Hayes, Wilhite and Svoboda (2005), and Wu, Svoboda, Hayes, Wilhite and Wen (2007) discussed with two important aspects of the SPI application: the amplitude of the record and its use in arid climates. Cheval (2015) has presented a thorough evolution of the SPI in its theoretical, practical and perspectives aspects. Campos-Aranda (2017) presents the evolution graph of the SPI, with duration of 6, 12 and 24 months, in the rain-gauge stations Villa de Arriaga, Rio Verde and Xilitla of the state of San Luis Potosí, Mexico, of dissimilar climates.
SPEI Index
The current trend seeks the characterization of SM through indexes based on multiple variables (Hao & Singh, 2015), whose main approaches of construction of these new multivariate indices are the use of soil moisture balance and the hidden variables. A hidden or latent variable is formed with a difference or quotient of variables that have great physical significance in the SMs; for example, precipitation and ETP and thus the RDI was proposed with the quotient of such variables and the SPEI (Standardized Precipitation Evapotranspiration Index) with its difference, which implies a condition of deficit or excess of water (Vicente-Serrano et al., 2010).
The SPEI is similar to SPI calculation and also sensitive to the alterations induced in the historical records of precipitation and temperature, according to the expectations presented by the climate change in such an area or region, for the study of future SMs. Like the SPI, the evolution graphs of their calculated values for certain duration (k), allow the exact definition of the beginning and end of the periods of drought and the date of occurrence of their extreme values, when using Equation 10. Figure 2 shows the evolution chart of the SPEI, at the Fresnillo rain-gauge station in the state of Zacatecas, Mexico, whose record covers 66 years in the span of 1949 to 2014; therefore, when k = 12 months the number of sequences processed is 781.
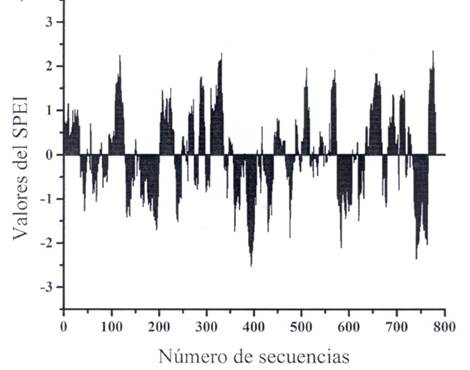
Figure 2 Evolution of the SPEI of 12-month duration at the Fresnillo rain-gauge station, Zacatecas, Mexico.
The fundamental change of the SPEI with the SPI is to use as starting data the differences (d) of the precipitation minus the ETP, both accumulated in one or several consecutive months. Since most of these differences are negative, many mobile sums (Equation 10) less than zero are obtained and then the distribution of probabilities that must be fitted to the formed sequences must be of three fitting parameters, with the location (u) lower than the minimum sequence (Beguería, Vicente-Serrano, Reig, & Latorre, 2014; Stagge et al., 2015).
Campos-Aranda (2018c) details the operating procedure of the SPEI and applies it to the Zacatecas rain-gauge station, Mexico, with 86 years of registration in the period from 1930 to 2015. Based on the SPEI it estimates the historical and future droughts, according to probable climate change (see Appendix), with nine durations ranging from 3 to 48 months. The SPEI is a drought index with greater potential than the SPI, by using a more realistic measure of water availability, the difference between precipitation and ETP; in addition, it is sensitive to probable climate change.
Standardized Palmer Drought Index (SPDI)
A comparative study conducted by Ma et al. (2014) of the PDSI, SPI and SPEI indices found deficiencies and limitations in the difference d used by the SPEI, as an equation of the monthly climate balance and propose to use the calculated one within the operating procedure of the Palmer index (PDSI), called humidity deviation (dh), which is the difference between the observed precipitation and one estimated for the normal climate conditions of the region, which is calculated based on the results of the water balance of the soil. When processing the dh differences with the SPI probabilistic approach, a new index has been developed, the Standardized Palmer Drought Index or SPDI, which includes the theoretical part that can be recovered from the Palmer Index, the computational efficiency of the SPI and reproduces the sensitivity of the SPEI to consider the probable climatic changes (Ma et al., 2014).
Campos-Aranda (2018d) exposes contrasts, in durations of drought of 6, 12 and 24 months, of the SPDI against the SPI and the SPEI, in the rain-gauge stations: Villa de Arriaga, Rio Verde and Xilitla from the state of San Luis Potosí, Mexico, which have different climates.
In Figure 3, the graph b) corresponds to the SPDI with historical record (769 sequences processed) altered with 20% reduction in annual precipitation. The graph c) shows the differences between SPDI altered and the original, that is, b) minus a).
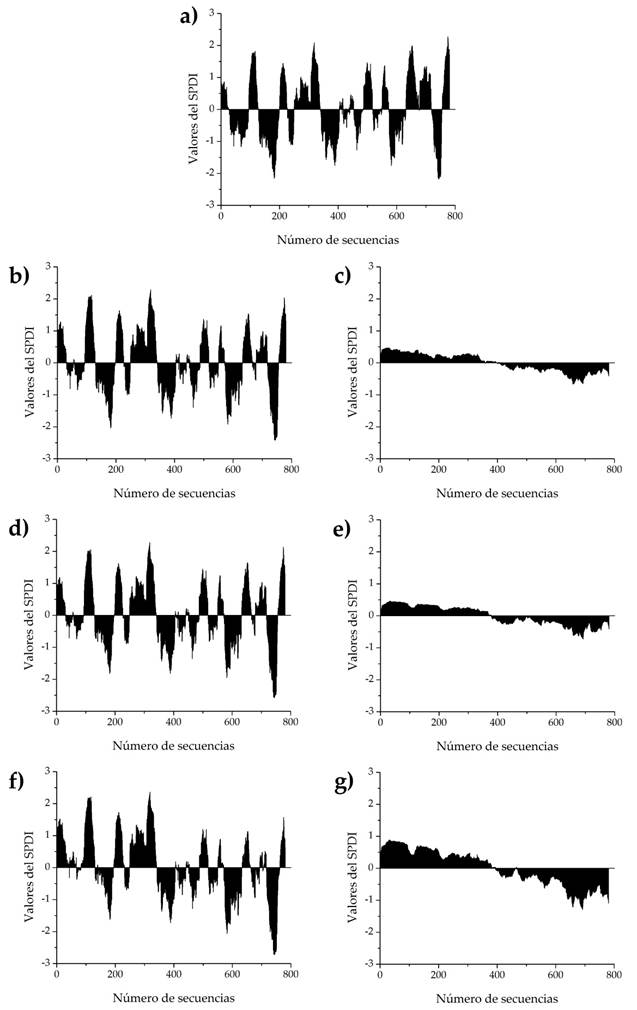
Figure 3 Evolution of the SPDI of 24-month duration at the Fresnillo rain-gauge station of the state of Zacatecas, Mexico (Graph a) historical record; other descriptions in the text).
Graph d) corresponds to the SPDI with altered historical record with an increase of 4°C in the average annual temperature. Graph e) shows the differences between the altered SPDI and the original, that is, d) minus a).
Graph f) corresponds to the SPDI with an altered historical record with a 20% reduction in annual precipitation and an increase of 4°C in average annual temperature. Graph g) shows the differences between the altered SPDI and the original, that is, f) less a).
Conclusions
The more common or universal conceptual aspects of the different Meteorological Droughts (SM) indices that have been proposed since the mid-sixties, starting with the simplest and reaching the most complicated ones, have been briefly presented. Their operative procedures are omitted, but it is mentioned where they can be consulted, in their theoretical version and where the author has applied them to real data.
To begin with, the annual SMs were characterized and then the evaluation of the SMs was approached in periods of several months, that is, adopting a duration for the drought.
This compilation is considered useful to begin and advance the study and characterization of the historical SMs of a locality, based on a certain climatological or meteorological station. The study of an area or geographic region, is treated equally, but interpreting the results of several climatological stations, to conclude on the behavior or spatial evolution of the SMs.
Emphasis is placed on progress in the study and quantitative evaluation of local or regional SM, according to how the indexes are described, since their historical evolution and computational complexity agree.
Acknowledgments
Observations and corrections suggested by the anonymous referee C, are appreciated, which allowed expanding the content of the work, in relation to the advantages of each index of drought exposed and helped to find a better numerical description of them, citing various applications of the author.
REFERENCES
Alley, W. M. (1984). The Palmer drought severity index: Limitations and assumptions. Journal of Climate and Applied Meteorology, 23(7), 77-86. [ Links ]
Beguería, S., Vicente-Serrano, S. M., Reig, F., & Latorre, B. (2014). Standardized Precipitation Evapotranspiration Index (SPEI) revisited: Parameter fitting, evapotranspiration models, tools, datasets and drought monitoring. International Journal of Climatology, 34(10), 3001-3023. [ Links ]
Campos-Aranda, D. F. (2016). Estudio de sequías meteorológicas anuales por medio del índice de aridez, en el estado de Zacatecas, México. Ingeniería. Investigación y Tecnología, 17(3), 403-415. [ Links ]
Campos-Aranda, D. F. (2017). Cuantificación de sequías meteorológicas mensuales: cotejo de cuatro índices en tres localidades de San Luis Potosí, México. Tecnología y ciencias del agua, 8(3), 159-172. [ Links ]
Campos-Aranda, D. F. (2018a). Detección de sequías meteorológicas anuales en el estado de Zacatecas, México, con base en índices de anomalía estandarizada. Tecnología y ciencias del agua, 9(1), 135-149. [ Links ]
Campos-Aranda, D. F. (2018b). Cuantificación con el SPEI de sequías históricas y bajo cambio climático probable en la estación climatológica Zacatecas, México. Tecnología y ciencias del agua, 9(2), 210-233. [ Links ]
Campos-Aranda, D. F. (2018c). Análisis estadístico de la ocurrencia de sequías meteorológicas anuales según tipo de clima del estado de San Luis Potosí, México. Tecnología y ciencias del agua, 9(3), 213-231. [ Links ]
Campos-Aranda, D. F. (2018d). Contrastes del Índice de Sequías de Palmer Estandarizado (SPDI) en tres ubicaciones climáticas de San Luis Potosí, México. Tecnología y ciencias del agua, 9(5), 246-279. [ Links ]
Cheval, S. (2015). The Standardized Precipitation Index - An overview. Romanian Journal of Meteorology, 12(1-2), 17-64. [ Links ]
Cacciamani, C., Morgillo, A., Marchesi, S., & Pavan, V. (2007). Chapter 2. Monitoring and forecasting drought on a regional scale. In: Rossi, G., Vega, T., & Bonaccorso, B. (eds.). Methods and tools for drought analysis and management (pp. 29-48). Dordrecht, The Netherlands: Springer. [ Links ]
Dogan, S., Berktay, A., & Singh, V. P. (2012). Comparison of multi-monthly rainfall-based drought severity indices, with application to semi-arid Konya closed basin, Turkey. Journal of Hydrology, 470-471, 255-268. [ Links ]
Elagib, N. A. (2009). Assessment of drought across central Sudan using UNEP dryness ratio. Hydrology Research, 40(5), 481-494. [ Links ]
Elagib, N. A., & Elhag, M. M. (2011). Major climate indicators of ongoing drought in Sudan. Journal of Hydrology, 409(3-4), 612-625. [ Links ]
Fernández, B., & Gironas, J. (2017). Chapter 79. Drought characteristics. In: Singh, V. P. (ed.). Handbook of applied hydrology (2nd ed.) (pp. 79.1-79.12). New York, USA: McGraw-Hill Education. [ Links ]
Fuchs, B. A., Svoboda, M. D., Wilhite, D. A., & Hayes, M. J. (2014). Chapter 12. Drought indices for drought risk assessment in a changing climate. In: Eslamian, S. (ed.). Handbook of engineering hydrology. Modeling, climate change and variability (pp. 217-231). Boca Raton, USA: CRC Press. [ Links ]
Guttman, N. B. (1999). Accepting the Standardized Precipitation Index: A calculation algorithm. Journal of the American Water Resources Association, 35(2), 311-322. [ Links ]
Hao, Z., & Singh, V. P. (2015). Drought characterization from a multivariate perspective: A review. Journal of Hydrology, 527, 668-678. [ Links ]
Karl, T. R. (1986). The sensitivity of the Palmer drought severity index and Palmer’s Z-index to their calibration coefficients including potential evapotranspiration. Journal of Climate and Applied Meteorology , 25(1), 77-86. [ Links ]
Ma, M., Ren, L., Yuan, F., Jiang, S., Liu, Y., Kong, H., & Gong, L. (2014). A new standardized Palmer drought index for hydro-meteorological use. Hydrological Processes, 28(23), 5645-5661. [ Links ]
McKee, T. B., Doesken, N. J., & Kleist, J. (1993). The relationship of Drought frequency and duration to times scales. 8 th Conference on Applied Climatology (pp. 179-184). Anaheim, California, USA. [ Links ]
Mishra, A. K., & Singh, V. P. (2010). A review of drought concepts. Journal of Hydrology, 391(1-2), 202-216. [ Links ]
Mishra, A. K., & Singh, V. P. (2011). Drought modeling - A review. Journal of Hydrology , 403(1-2), 157-175. [ Links ]
Morid, S., Smakhtin, V., & Moghaddasi, M. (2006). Comparison of seven meteorological indices for drought monitoring in Iran. International Journal of Climatology, 26(7), 971-985. [ Links ]
Palmer, W. C. (1965). Meteorological drought. Research Paper No. 45. U. S. Weather Bureau, Washington, D. C., USA. [ Links ]
Pandey, R. P., & Ramasastri, K. S. (2001). Relationship between the common climatic parameters and average drought frequency. Hydrological Processes, 15(6), 1019-1032. [ Links ]
Pandey, R. P., & Ramasastri, K. S. (2002). Incidence of droughts in different climatic regions. Hydrological Sciences Journal, 47(S), S31-S40. [ Links ]
Pandey, R. P., Sharma, K. D., Mishra, S. K., Singh, R., & Agarwal, A. (2008). Chapter 21. Drought characterization. In: Singh, V. P. Hydrology and Hydraulics (pp. 761-792). Highlands Ranch, USA: Water Resources Publications. [ Links ]
Panu, U. S., & Sharma, T. C. (2002). Challenges in drought research: Some perspectives and future directions. Hydrological Sciences Journal, 47(S), S19-S30. [ Links ]
Ponce, V. M., Pandey, R. P., & Ercan, S. (2000). Characterization of drought across climatic spectrum. Journal of Hydrologic Engineering, 5(2), 222-224. [ Links ]
Sene, K. (2010). Chapter 8. Droughts. In: Hydro-meteorology. Forecasting and Applications (pp. 239-267). London, UK: Springer. [ Links ]
Stagge, J. H., Tallaksen, L. M., Gudmundsson, L., Van Loon, A. F., & Stahl, K. (2015). Candidate distributions for climatological drought indices (SPI and SPEI). International Journal of Climatology , 35(13), 4027-4040. [ Links ]
Tsakiris, G., & Vangelis, H. (2005). Establishing a drought index incorporating evapotranspiration. European Water, 9/10, 3-11. [ Links ]
Tsakiris, G., Tigkas, D., Vangelis, H., & Pangalou, D. (2007). Chapter 9. Regional drought identification and assessment. In: Rossi, G., Vega, T., & Bonaccorso, B. (eds.). Methods and tools for drought analysis and management (pp. 169-191). Dordrecht, The Netherlands: Springer . [ Links ]
Vangelis, H., Tigkas, D., & Tsakiris, G. (2013). The effect of PET method on Reconnaissance Drought Index (RDI) calculation. Journal of Arid Environments, 88, 130-140. [ Links ]
Vicente-Serrano, S. M., Beguería, S., & López-Moreno, J. I. (2010). A multiscalar Drought Index sensitive to Global Warming: The Standardized Precipitation Evapotranspiration Index. Journal of Climate, 23(7), 1696-1718. [ Links ]
Wells, N., Goddard, S., & Hayes, M. J. (2004). A self-calibrating Palmer drought severity index. Journal of Climate, 17(12), 2335-2351. [ Links ]
Wu, H., Hayes, M. J., Weiss, A., & Hu, Q. (2001). An evaluation of the Standardized Precipitation Index, the China-Z Index and the Statistical Z-score. International Journal of Climatology , 21(6), 745-758. [ Links ]
Wu, H., Hayes, M. J., Wilhite, D. A., & Svoboda, M. D. (2005). The effect of the length of record on the standardized precipitation index calculation. International Journal of Climatology , 25(4), 505-520. [ Links ]
Wu, H., Svoboda, M. D., Hayes, M. J., Wilhite, D. A., & Wen, F. (2007). Appropriate application of the SPI in arid locations and dry seasons. International Journal of Climatology , 27(1), 65-79. [ Links ]
Zelen, M., & Severo, N. C. (1972). Chapter 26. Probability functions. In: Abramowitz, M., & Stegun, I. (eds.). Handbook of mathematical functions (pp. 925-995). New York, USA: Dover Publications. [ Links ]
Appendix: Associate hypothetic conditions to climate change
All the exposed indices allow an approximate estimation of the future SM, through altering or modifying the historical records of PA and TM, to take into account the probable climate change of the locality or geographical area studied (Fuchs et al., 2014). In the IZC and SPI indexes, only the precipitation record is altered and in those that use the ETP, first the temperature record is modified and then their estimation method is applied.
Based on the quantitative results made by Vicente-Serrano et al. (2010) and Ma et al. (2014), it is recommended to establish and analyze three sceneries for the probable climate change: (1) a progressive and linear reduction of 20% in the annual precipitation of the historical record; (2) a progressive and linear increase of 4°C in the annual average temperature record and (3) the superposition of both changes in the historical records. The correction of the monthly precipitation record (PM j,i ) is made based on The following equation:
in which j is the month counter, changing from 1 to 12 and i the year counter, varying from 1 to NA, that is the number of years processed, Δ P is the slope of reduction and therefore equal to the ratio of 0.20 between NA. The correction to the average monthly temperature record (TM j,i ) is made with equation:
now, Δ T is the slope of the increase and therefore equal to the ratio of 4°C between NA.
Received: November 30, 2017; Accepted: March 19, 2019
 Este es un artículo publicado en acceso abierto bajo una licencia Creative Commons
