


 nova página do texto(beta)
 Inglês (pdf)
 Artigo em XML
 Referências do artigo
 Enviar este artigo por email
 Citado por SciELO
  Similares em
SciELO
Similares em
SciELO 
 Permalink
Introduction
Between 2000 and 2015, world population grew 1 200 million approximately, and it has been estimated that over the next decade population will increase 800 million. This fact implies an increment in the volume of the wastewater generated which, in many cases is discharged directly to rivers without treatment. According to UNESCO 90% of the wastewater from cities in developing countries do not even receive any treatment at all (Grupo Banco Mundial, 2017; UNESCO-WWAP, 2015).
Population growth will also imply a higher demand for energy, which will make necessary to promote the use of technologies based on renewable energies that contribute to reduce the pollution caused by nonrenewable sources (Daniel, Das-Mankidy, Ambarish, & Manogari, 2009; Herrero-Hernández, Smith, & Akid, 2013; Min, Cheng, & Logan, 2005). Microbial fuel cells (MFC) are one of the alternative technologies that has been studied for the production of electricity with the advantage that at the same time reduce organic matter present in wastewaters (Kim, Min, & Logan, 2005).
A MFC serves to degrade inorganic or organic matter (oxidize) by microorganisms, while producing electrons that travel through the electron transport chain of the cell, generating energy as ATP (Logan, 2008), and those electrons are captured by a final receptor that feeds on organic matter available as substrate in wastewater (Du, Li, & Gu, 2007).
Figure 1 shows the structure of an MFC set up, composed of two chambers, an anode (A) that is anaerobic, where the microorganisms take the C/N nutrients presents in the wastewater used as substrate to its growth and the electrons are transferred to the anode. Simultaneously, protons are produced that travel through a bridge or permeable membrane (C) which separates the two chambers and allows only the passage of protons towards the cathode chamber (B) in aerobic conditions. The exchange of electrons is done through the external cable conductor from the anode to the cathode where they react with the protons and the final electron acceptor. The oxygen present in the cathodic chamber forms water molecules (Logan, 2008; Revelo, Hurtado, & Ruiz, 2013).

Electron transfer mechanisms described by Schröder, state that bacteria can transfer electrons directly or indirectly to the anode. Directly through electrons associated with the membrane or nanowires, and indirectly using a mediator between the bacteria and the anode. This mediator acts as a receiver of electrons coming from the cellular membrane, then loses the electrons to the anode, improving in this way the energy production (Marcus, Torres, & Rittmann, 2007; Schroder, 2007; Sund, McMasters, Crittenden, Harrell, & Sumner, 2007; Zhai et al., 2016; Logan, 2008).
The objective of this study was evaluate some of the variables that could affect the process in a MFC such as the use of strains of Escherichia coli and Pseudomonas aeruginosa, which were selected taking into account the availability and the capacity to produce electrical energy in a MFC. The second variable that was consider was electrodes material (carbon cloth and graphite), based on the cost of materials, availability and electric power produced in previous studies (Wei, Liang, & Huang, 2011). Similarly, the mediator (methylene blue) was selected following the availability, cost and common use in similar studies and an initial variation in the pH of the substrate was established taking into account the favorable growth range for each strain.
According with the variables described above an experimental design was performed to determine the combination of parameters that leads to a greater reduction of COD in the substrate and generates a greater electrical potential. Consider that this was the first study in this subject carried out at the “Fundación Universidad de América”; the aim was to establish favorable parameters that would allow continuity in the study of MFCs in the research group. The main purpose strains was to determine that the selected strains could produce energy and which are the operating conditions that favor a greater efficiency of the process.
Materials and methods
Strains and grow conditions
Strains were selected according to availability, theoretical capacity of electric power production and if they were mention in research done by Xi, Miroliaei and Veer-Raghavulu (Miroliaei, Samimi, Mohebbi-Kalhori, & Khorram, 2015; Veer-Raghavulu, Sarma, & Venkata-Mohan, 2011; Xi & Sun, 2008).
Inoculums were prepared for Escherichia coli (NCTC 5934) and Pseudomonas aeruginosa (ATCC® BAA-1744™) with an initial concentration adjusted to McFarland #2 pattern (1 x 10⁷ UFC/ml) in peptone water solution, comparing the turbidity of the pattern with that of the inoculum to obtain the established concentration. Later, the inoculum was add to the anodic chamber, having an initial concentration of 1 x 10⁷ UFC/ml, an effective volume of 800 ml of synthetic wastewater was used as substrate previously sterilized. The composition of the wastewater appears in Table 1 and was established taking into account different types of these synthetic wastewaters used in other MFC studies and analyzing the requirements of each strain.
Table 1 Composition of synthetic wastewater.
| Component | Concentration (g/l) |
|---|---|
| Casein peptone | 17.0 |
| Soy peptone | 3.0 |
| Glucose | 2.5 |
| Sodium chloride | 5.0 |
| Hydrogenated dipotassium phosphate | 2.5 |
Considering the optimum conditions of growth of each strain, all tests were performed at a constant temperature of 37 °C (LaBauve & Wargo, 2012; Shehata & Marr, 1975). In the same way, values of pH were established in a range of 6.5 and 7 for Escherichia coli, and between 7 and 8 for Pseudomonas aeruginosa (Kathiravan, Marykala, Sundaramanickam, Kumaresan, & Balasubramanian, 2012; Ruiz-Martínez, 2007). In the anodic chamber, an anaerobic envelope of Oxoid AnaeroGen (2.5 l) was used to generate an anaerobic atmosphere, which absorbs the oxygen present in the atmosphere of the container generating simultaneously CO2 without producing hydrogen.
MFC Operating parameters
A two-chambered cell made of polypropylene was assembled, each chamber with a total volume of 1 234 ml and separated by a bridge of chloride sodium with agar, in which there is a displacement of positive ions (Sevda & Sreekrishnan, 2012). Inside of each chamber, an electrode was placed. The dimensions for graphite electrode was 4 cm x 7 cm x 1 cm, and for the carbon cloth electrode was used, dimensions were 4 cm x 7 cm x 0.1 cm. The electrodes were prepared in the laboratory and the dimensions were established taking into account the availability of materials and their common use in other studies where the effective volume of the cameras was similar to that used in this study (Daniel et al., 2009; Ortiz-Martínez et al., 2015; Santoro, Arbizzani, Erable, & Ieropoulos, 2017; Wei et al., 2011). For the experimental design in half of the tests methylene blue was added as a mediator with a concentration of 0.1 mg/ml of substratum in the anodic chamber. This concentration was obtained by evaluating values that were used by other studies, and taking into account the maximum concentration at which the mediator affects the growth of the strains (Sevda & Sreekrishnan, 2012).
Variables for the test were (1) the use (or not) of a mediator for each strain, (2) two values of pH, and (3) the material employed for the electrodes.
Sixteen tests were carried out, taking into account a factorial experimental design 24, four variables (strains, pH, material of the electrode and the use or non-use of mediator), each one with two levels. An additional test (blank) without strains was performed to demonstrate that energy production occurs due to the presence of bacteria.
Variables monitoring
Each of the tests was monitored every two hours for 24 hours using a multimeter unit UT33C with a precision for DC voltage measurement of +/- 0.5% + 2 and current intensity measurement of +/- 1% + 2. Values for voltage and current intensity were registered to calculate the following parameters: power (W), current density (A/m2) (using electrode area), power density (W/m2), and volumetric power (W/m3) (using total volume of the cell). At the same way, pH values were monitored with a digital pen-type pH-meter PH-009 (I) with precision +/- 0.1 pH, to evaluate variation during the process of electric power production.
Water quality was analyzed with COD values. Initial and final values were registered for each experiment with the method SM 5220 D for an analysis parameter A-COD medium range (colorimetric), which is based on the oxidation of organic matter by a strong oxidant such as dichromate. When chromium is reduced, a change in the color of the solution is observed, thanks to the reaction of chromium with the total available organic matter, which allows to quantify the amount of organic matter by this method which measures the absorbance of chromium (León Gil, 2009).
Bacterial growth curve
Data of the growth curves were recorded, taking samples every two hours from the anodic chamber for 24 hours. Eight consecutive dilutions of the base 10, of the 13 samples were made in test tubes with 4.5 ml of saline solution previously sterilized, adding 0.5 ml of sample to each tube. The seeding was performed on the surface of the most representative dilutions in Petri dishes with culture medium, to subsequently incubate for 24 hours at 37 ° C. Finally the plate count of the most concentrated colonies was carried out and the reading was allowed (between 30 and 300 colonies). The number of UFC/ml was obtained through the equation: UFC/ml = number of colonies * inverse of the dilution * correction factor (Alonso- Nore & Poveda-Sanchez, 2008; López Tevez & Torres, 2006).
Results and analysis
According to the experimental design proposed in the methodology, 16 test were performed for combinations that allows observed the influence of each parameter over the COD reduction and electric power generation; one additional test was done as a control test with the substrate without strains.
Electric power production: Parameters
From the data collected from the measured variables, the parameters for production of electricity were determined. Table 2 and Table 3 show results for each experiment, where voltage and current intensity correspond to the average calculated for measures taken each 2 hours.
Table 2 Experimental results. Ec: Escherichia coli; Ps: Pseudomonas aeruginosa; Gr: Graphite; Te: Cloth; CM: with mediator; SM: without mediator.
| Test | Combination | Average voltage (mV) | Average current intensity (µA) |
|---|---|---|---|
| 1 | Ec - CM - pH 7 - Gr | 341 | 46 |
| 2 | Ec - CM - pH 7 - Te | 204 | 107 |
| 3 | Ec - CM - pH 6.5 - Te | 284 | 4 |
| 4 | Ec - CM - pH 6.5 - Gr | 46 4 | 67 |
| 5 | Ec - SM - pH 7 - Te | 134 | 7 |
| 6 | Ec - SM - pH 7 - Gr | 187 | 6 |
| 7 | Ec - SM - pH 6.5 - Gr | 112 | 57 |
| 8 | Ec - SM - pH 6.5 - Te | 95 | 2 |
| 9 | Ps - CM - pH 8 - Te | 271 | 7 |
| 10 | Ps - CM - pH 8 - Gr | 414 | 12 |
| 11 | Ps - CM - pH 7 - Gr | 45 | 6 |
| 12 | Ps - CM - pH 7 - Te | 0.89 | 104 |
| 13 | Ps - SM - pH 8 - Te | 268 | 12 |
| 14 | Ps - SM - pH 8 - Gr | 256 | 16 |
| 15 | Ps - SM - pH 7 - Te | 120 | 28 |
| 16 | Ps - SM - pH 7 - Gr | 113 | 91 |
| 17 | Blank (pH 7 - Te) | 0 | 0 |
Table 3 Results of the parameters for the evaluation of energy production.
| Test | Average voltage (mV) | Average current intensity (mA) | Power (mW) | Current density (mA/m2) | Power density (mW/m2) | Volumetric power (mW/m3) |
|---|---|---|---|---|---|---|
| 1 | 341 | 0.046 | 0.0156 | 5.85 | 1.99 | 12.60 |
| 2 | 204 | 0.107 | 0.0219 | 18.40 | 3.77 | 17.80 |
| 3 | 284 | 0.004 | 0.0011 | 0.67 | 0.19 | 0.90 |
| 4 | 464 | 0.067 | 0.0311 | 8.59 | 3.98 | 25.20 |
| 5 | 134 | 0.007 | 0.0009 | 1.24 | 0.17 | 0.79 |
| 6 | 187 | 0.006 | 0.0011 | 0.78 | 0.15 | 0.92 |
| 7 | 112 | 0.057 | 0.0065 | 7.38 | 0.83 | 5.23 |
| 8 | 95 | 0.002 | 0.0002 | 0.38 | 0.04 | 0.17 |
| 9 | 271 | 0.007 | 0.0021 | 1.30 | 0.35 | 1.66 |
| 10 | 414 | 0.012 | 0.0051 | 1.58 | 0.65 | 4.13 |
| 11 | 45 | 0.006 | 0.0002 | 0.80 | 0.04 | 0.23 |
| 12 | 0.89 | 0.104 | 0.00009 | 17.90 | 0.02 | 0.08 |
| 13 | 268 | 0.012 | 0.0032 | 2.04 | 0.55 | 2.57 |
| 14 | 256 | 0.016 | 0.0040 | 2.01 | 0.51 | 3.25 |
| 15 | 120 | 0.028 | 0.0033 | 4.75 | 0.57 | 2.68 |
| 16 | 113 | 0.091 | 0.0103 | 11.70 | 1.32 | 8.32 |
Based on the presented results, Figure 2, Figure 3, Figure 4 and Figure 5, shows the relation between the parameters studied.
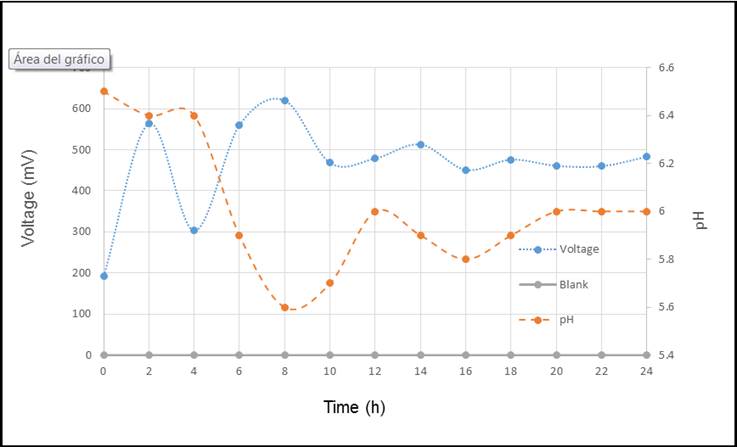


The voltage-pH relationship is inverse concerning time as observed in Figure 2, this is due to the processes at cellular level. First, during the electron exchange, hydrogen ions are pumped towards the exterior of the membrane, causing a drop in pH values. Second, E. coli does anaerobic fermentation as a metabolic route for the production of ATP as a source of energy, simultaneously producing mixed acids that could generate a rise in acidity, decreasing pH values. These acids are acetic acid, lactic acid, butyric acid, formic acid, propionic acid and pyruvic acid formed in glycolysis after a group of redox reactions due to enzymatic activity (Förster & Gescher, 2014).
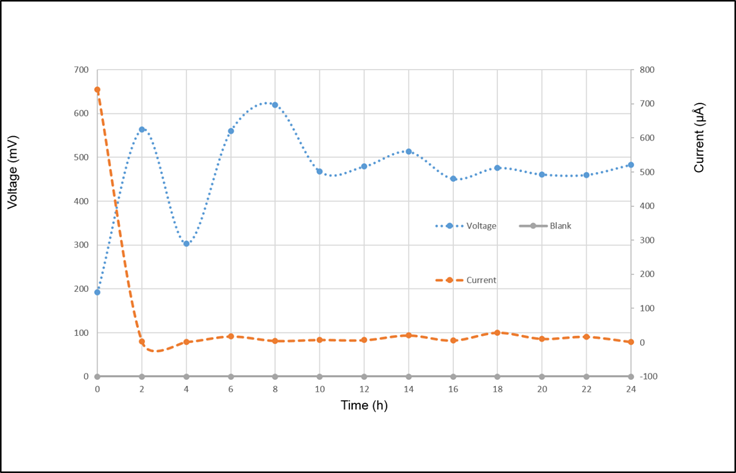
The current intensity was constant after the first two hours, nevertheless, before that, a decrease is observed in Figure 3. Morphology for Escherichia coli could explain this given that its structure possess a series of antigens inside of which the capsular is found. The capsular is in charge of protecting the bacteria, decreasing a number of electrons that go through the cellular membrane (Roberts, 2002; Russo, 2002).
In Figure 4, Pseudomonas aeruginosa presents a similar behavior to Escherichia coli, this could be explained both strains had the same substratum and since glucose is, the simplest nutrient and they did the same metabolic route, glycolysis, to transform glucose. Glycolysis decrease pH when voltage increases, because of the production of mix acids (glucose to pyruvate).
Results for the blank test are presented in the inferior part of the Figure 5. In the test no microorganisms were used to confirm what are the requirements needed by microorganisms to produce electricity.
In Figure 5 a different pattern than the one in Figure 3 is observed, the current intensity varies in time. The cellular products secreted by the microorganism, do not allow electrons to reach the electrode constantly, causing these changes. Inside this products, fimbria extends through the surface of the cell and produces an extracellular layer of mucus composed of alginate, L-gyconiric acid, and manuric acid, called glycocalyx (Brooks, Jawetz, Melnick, & Adelberg, 2010; Murray, Rosenthal, & Pfaller, 2013).
Combinations with the highest electricity production, measured in voltage were 4 and 10 as observed in Table 2. For Escherichia coli a voltage of 464 mV was obtained and for Pseudomonas aeruginosa a value of 414 mV, with a power of 0.0311 mW and 0.0051 mW, respectively. This demonstrates that the bacteria with the higher electricity production under the given conditions is Escherichia coli. In addition, the positive effect of the mediator with each strain was observed Escherichia coli results show that the highest production of electricity was obtained with the use of methylene blue. A similar pattern was observed for Pseudomonas aeruginosa, but these results depend on the initial value oh pH used and the electrode’s material.
Emphasizing the behavior of both bacteria under the combinations selected, a second test was done for each combination. As a result, values of 386 mV for Escherichia coli and 334 mV for Pseudomonas aeruginosa were obtained. The results show a small difference in comparison with the first test and confirm a higher voltage for the Escherichia coli strains. The voltage values are also consistent with the reported by other authors (Gonzalez-del-Campo, Lobato, Cañizares, Rodrigo, & Fernandez-Morales, 2013; Pandey et al., 2016).
Bacteria growth curves
Bacteria quantification data and Figure 6 show that Escherichia coli was the bacteria with the highest affinity to the substrate. In their lag phase, bacteria produce enzymes necessary to degrade nutrients present in the substrate. In Figure 6 it is observed that E. coli lag phase lasted only four hours, while P. aeruginosa took almost twice the amount of time to adapt to the substrate. A similar behavior is observed for the exponential growth phase, where E. coli is faster than P. aeruginosa, because it's binary fission process is shorter (Fallahzadeh, Ahmadzadeh, & Sharifi, 2010; Hron et al., 2014).

Chemical oxygen demand
Synthetic wastewater is composed of trypticase soy broth, an initial value of COD 23 248 mg/l O2 was measured. During the process of electricity production, a decrease in chemical oxygen demand was observed. The final value of COD for Escherichia coli was 20 568 mg/l O2 (11.53%) and for Pseudomonas aeruginosa was 22 488 mg/l O2 (3.27%). Based on the previous data, it can be affirmed that the decrease in COD was higher for the tests with Escherichia coli and produced more electricity.
Reviewing similar processes and studies done by other authors on COD decrease, it is possible to determine that the results for Escherichia coli were significant considering that the experiments was carried for a short period of 24 hours. In research carried out by Sevda and Sreekrishnan (2012); Rodrigo et al. (2007); Wang, Yue and Guo (2014), the observed decreases were of 88.41% (25 days), 50% (13 days) and 91% (five days), respectively.
Conclusions
The factors considered for the selection of the each component of the cell (electrodes, saline bridge), strains and mediator, were availability, cost, growth environment for the strains, and electricity production. The following components and conditions were chosen: Carbon cloth and graphite as electrodes; a saline bridge for the proton exchange membrane (PEM methylene blue as mediator and a synthetic wastewater composed of trypticase soy broth. Finally, for Escherichia coli, pH values of 6.5 and 7, and Pseudomonas aeruginosa of 7 and 8 were used.
The most favorable conditions for electricity production and a decrease in COD were achieved using Escherichia coli with pH of 6.5, methylene blue and graphite as material for the electrode, obtaining a voltage of 464 mV and a decrease in COD of 11.63%. Pseudomonas aeruginosa had a lower affinity to the substratum, which was reflected in its slower growth curve, showing consequently lower electricity production. In the first tests and the later replicas made, it was observed that conditions were favorable for Escherichia coli, even if there was a difference in the produced voltage of 464 mV and 386 mV, respectively. This result was expected because the test was performed on a living organism and behavior varies from one test to another. The conditions mentioned above give E. coli an advantage over P. aeruginosa, and the use of a mediator are factors that affect the electricity production. P. aeruginosa did not require a mediator; nevertheless, its behavior was better when the mediator was used.
It is important to highlight that pH values and electrode materials affected the results. E. coli performed better with acid pH values, while P. aeruginosa performed better with alkaline pH values. Graphite overall was the most effective material when used with both strains because it has a larger contact area, permitting a better flow of electrons, confirming what other authors report (Daniel et al., 2009; Schroder, 2007).
Analysis of COD showed a decrease of 2 680 mg/l O2 with Escherichia coli and 760 mg/l O2 with Pseudomonas aeruginosa. This is explained by the high affinity of the former for the substratum, the higher amount of nutrients consumed by E. coli in comparison with P. aeruginosa generates a greater reduction in COD values.

