


Servicios Personalizados
Revista
Articulo
 texto en
  Inglés (pdf)
 Artículo en XML
 Referencias del artículo
 Enviar artículo por email
Indicadores
-
 Citado por SciELO
 -
 Accesos
Links relacionados
-
 Similares en
SciELO
Similares en
SciELO
Compartir

 Permalink
Tecnología y ciencias del agua
versión On-line ISSN 2007-2422
Tecnol. cienc. agua vol.10 no.6 Jiutepec nov./dic. 2019 Epub 15-Mayo-2020
https://doi.org/10.24850/j-tyca-2019-06-07
Articles
Methodology to estimate the relationship of water consumption and rainwater harvesting system in a building located at the Universidad Autónoma Metropolitana, Azcapotzalco, Mexico

1Universidad Distrital Francisco José de Caldas, Bogotá, Colombia, josolorzanov@correo.udistrital.edu.co
2Universidad Autónoma Metropolitana, Unidad Azcapotzalco, Ciudad de México, México, jgn@azc.uam.mx
3Universidad Distrital Francisco José de Caldas, Bogotá, Colombia, cvpenarandao@uditrital.edu.co
The Azcapotzalco campus, belonging to the Universidad Autónoma Metropolitana located in Mexico City, has been experiencing a shortages of drinking water in recent years. This paper is the result of searching for mitigation alternatives, where a methodology is presented to estimate the ratio: rainwater volume collection, storage and usage in a building within the University. The amount of rainwater that can be collected, is estimated by performing a statistical analysis over the historical data representing rainfall, and the same time, by evaluating effective collecting areas over the rooftop of the building. A demand curve is obtained by obtaining samples in the toilets at different days and hours, which are believed to be representative of common periods in the University. The implementation of a storage tank, will allow the storage of rainwater when this is abundant, thus enabling for its usage when scarce. To this end, three tank are studied, with the purpose of evaluating which one will be the most suitable. This paper presents a methodology intended to identify the viability of a rainwater harvesting system and different capacities of storage tanks. Finally, the system is simulated with rain records corresponding to the year 2015 to figure it out what the system performance would have been. The results present the conditions for which the system is self-sufficient or needs an external endowment.
Keywords: Rainwater harvesting; estimation of water self-sufficiency; simulation of tank operation; supply and demand in school buildings
La unidad Azcapotzalco de la Universidad Autónoma Metropolitana, ubicada en la Ciudad de México, ha presentado desabasto de agua potable en algunos periodos de años recientes. La búsqueda de alternativas de mitigación o solución a esta problemática dio como consecuencia el presente artículo. Se presenta una metodología para estimar la relación del volumen de captación de agua de lluvia, de almacenamiento y de consumo en un edificio de la universidad. El potencial de captación de agua de lluvia se obtiene con un análisis estadístico de las precipitaciones históricas de la zona y de la evaluación del área efectiva de captación en las azoteas del edificio en estudio. La curva de demanda es obtenida con muestreo en los sanitarios para diferentes días y horarios, representativos de los diferentes periodos en la universidad. La implementación de un tanque de almacenamiento al sistema permite guardar agua cuando se presenta en abundancia y disponerla cuando escasea a lo largo del tiempo; por ello, se estudian tres diferentes volúmenes de tanque, para conocer cuál es el más adecuado. El objetivo de esta metodología es identificar la viabilidad del sistema de captación de lluvia y dimensionar el tanque de almacenamiento. Además, el sistema es simulado con los registros de lluvia del año 2015, para conocer cuál hubiera sido la respuesta del sistema de haber estado instalado en ese periodo. Los resultados permiten conocer en qué periodos del año el sistema es autosuficiente o requiere de una dotación externa.
Palabras clave captación de agua lluvia; estimación de autosuficiencia hídrica; simulación de funcionamiento de tanques; oferta y demanda en edificio escolar
Introduction
In recent years, water demand has reached levels that exceed availability; and conventional water supply systems are insufficient, forcing local authorities to bring water from other basins, which implies an increase in costs for cubic meter transported. Mexico City is one of the cities worldwide where water is consumed in vast quantities (Gutiérrez, 2017) being supplied from three main sources: 2.5% from the Magdalena river, 26.5% from the Lerma and Cutzamala system, and 71% from groundwater aquifers which are already overexploited (Guerrero, Rives, Rodriguez, & Saldivar, 2009). Despite this supply, some areas of the city are prone to suffer shortage, being the period comprehended between March and April as the most intense. This is the case of Azcapotzalco sector, a region located in the Northwest of the city where the Azcapotzalco campus belonging to the Universidad Autónoma Metropolitana (UAM Azc) is located.
Rainwater harvesting systems, have become a promising alternative to complement water supply (Ibne, Rezaul, & Alam, 2018), because of its easiness to be collected and subsequent use for non-potable purposes (Rahman, Keane, & Alam, 2012), for instance in toilet flushing, irrigation, and general cleaning operations (Medina, 2016). Zaragoza (2013) determined in his study that rainwater collected from the rooftops of UAM Azc, can be employed for domestic purposes because it is compliant with the Mexican regulatory norms NOM-003-SEMARNAT-1997, showing levels below the permissible maximum concentrations of heavy metals, cyanides, fecal coliform, eggs of parasitic worm, BOD5, TSS, fats and oils. Although compliant with NOM-003-SEMARNAT-1997, this collected water may not be used for drinking purposes, it will be necessary to know if meets or if it will require further treatment as is established according to the Mexican norm NOM-127-SSA1-1994.
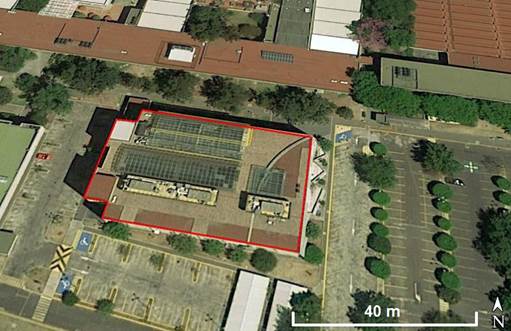
Information about rainwater collection systems is abundant (Kisakye & Van der Bruggen, 2018; Saeedi & Goodarzi, 2018; Braga, O'Grady, Dabak, & Lane, 2018; Fulton, 2018), however, works on which it is conducted a thorough analysis of the acquisition-consumption relationship and its viability to be implemented are scarce. The present study presents a methodology to estimate how much rainwater volume can be captured in the rooftop, its storage and its final consumption in bathrooms of the W building in UAM Azc, (see Figure 1). The results show the dynamic behavior of the system (capture-consumption-storage) in time employing storage tanks of 5, 10 and 20 m3, respectively. Also, it shows the average behavior of the system for two years with average values and its response with rainfall records corresponding to the year 2015.
Methodology
Rainwater collected volume estimation
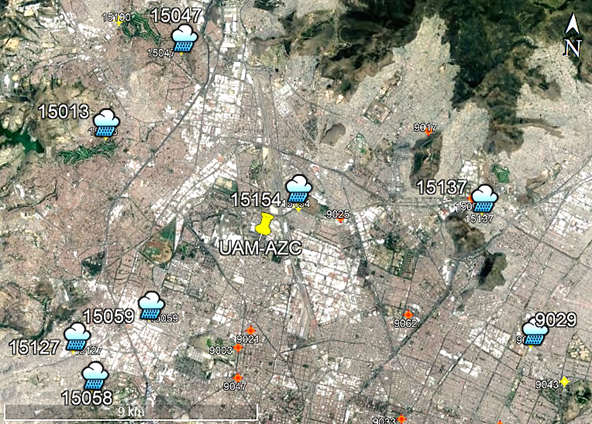
Rainfall analysis is developed based on records corresponding to 59 years (1951 to 2010) retrieved from 8 climatological stations which are close to the study area (SMN, 2010), as is shown in Table 1 and Figure 2.
Table 1 Climatological stations closest to UAM Azcapotzalco.
| ID | Name | Place | Distance | Coordinates | |
|---|---|---|---|---|---|
| Latitude | Length | ||||
| 15154 | Vaso regulador carretas | Tlalnepantla de Baz | 1.8 km | 19° 30' 55.08" N | 99° 10' 22.08" O |
| 15137 | Amealco | Tlalnepantla de Baz | 8.0 km | 19° 31' 5.16" N | 99° 6' 38.88" O |
| 15013 | Calacoaya | Atizapán de Zaragoza | 6.7 km | 19° 32' 3.12" N | 99° 14' 21.84" O |
| 15059 | Molino blanco | Naucalpan de Juárez | 4.7 km | 19° 28' 39.00" N | 99° 13' 14.88" O |
| 15047 | Las arboledas | Tlalnepantla de Baz | 7.3 km | 19° 33' 46.08" N | 99° 12' 56.88" O |
| 15127 | Totolica San Bartolo | Naucalpan de Juárez | 7.6 km | 19° 27' 56.16" N | 99° 14' 44.16" O |
| 15058 | Molinito | Naucalpan de Juárez | 7.9 km | 19° 27' 12.96" N | 99° 14' 17.88" O |
| 9029 | Gran canal km. 06+250 | Gustavo A. Madero | 10.3 km | 19° 28' 36.12" N | 99° 5' 29.04" O |
The building studied is five stories tall, comprising Laboratories, auditoriums, a greenhouse, an esplanade and a potential collecting area of 1974 m2. Average volume of water to be captured in one month period can be estimated based on the information on the historical rainfall average of each month and the catchment area according to Equation (1).
where,
Determination of water volume consumption
During two weeks, samplings were conducted to account for the number of persons entering to the toilets and the cleaning activities performed by the maintenance personnel, occurring from 8:00 to 17:00 h. The data collected allowed for estimating the amount of water demanded by the building, to identify and to plot variation curves for the demand for this building: Group 1 (Monday, Wednesday and Friday) comprised by students attending lectures held on others buildings, but using the toilets in the building W. Group 2 (Tuesdays and Thursdays) corresponding to students conducting research activities in the laboratories of the building W. Group 3 (Saturday) with a small probability of incurrence comprised only by students conducting research activities in the laboratories and working personnel for maintenance activities. It is estimated that no Sundays there is no need for water usage, except on rare occasions and for this reason is considered irrelevant.
Water consumption was classified according to the gender; and a factor was used for each sanitary furniture employed. For men this was 0.75 in the toilet, 0.25 in the urinal and 2.0 in the sink, meaning that for each person who enters, 75% is prone to use the toilet, 25% the urinal and activating 2 times the sink water dispenser. For women, 1.0 is assigned to the toilet and 2.0 to the sink. All sinks consume 0.25 l, all urinals 0.5 l and all toilets 5.0 l per flush accordingly to the manufacturer's figures (Helvex, 2000). In addition to the water consumption in the bathrooms, a volume of 0.36 m3/day for cleaning purposes is employed accordingly to what is reported back by the cleaning staff.
Water consumption per hour can be estimated according to the Equation (2):
where
Collection-consumption balance
With information related to average collection per month and average demand per day, a daily balance can be obtained, allowing to identify the times when the demand is greater and an external endowment is therefore required; or times when the collection is greater and there is a surplus of water that can be stored. This is called potential volume of rainwater to be stored for a period of time (day, week, month or other), and is calculated with a transit model applied to the tank as is shown in Equation (3):
where
Modeling the operation of storage tanks
Once the acquisition-demand dynamic has been obtained, three tanks capable to store and to meet the demands for water consumption in the W building during the periods of scarcity are proposed. To simulate each of the tanks operational performance in situations of filling and spillage (Figure 3), equation four is applied:
where

Results and discussion
Volume of water to be collected
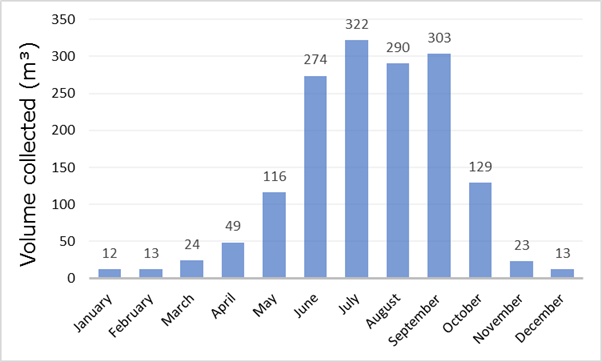
In Mexico City, the dry season occurs from November to April, representing only 8.4% of the accumulated rainfall, while the rainy season occurs from May to October, accumulating the remaining 91.6%. This precipitation is modulated to a large extent by the passage of clouds coming from the east, providing a flow of moisture from the Gulf of Mexico (Magaña, López, & Vázquez, 2013). The volume of rainwater that can be collected in each month can be is obtained by applying the Equation (1) and is shown in Figure 4.
Volume of water consumption
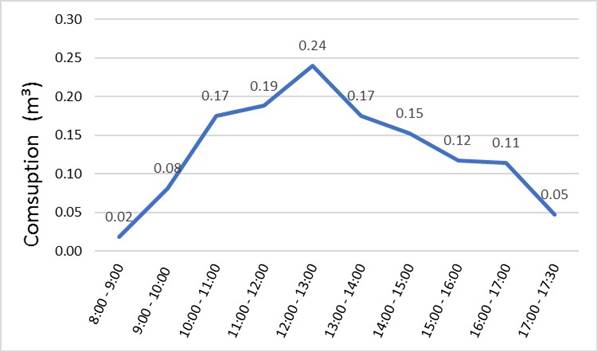
Consumption varies throughout the day and the week, depending on the activity that is occurring. For obvious reasons, it is different from the home time variation of Mexico City published by Conagua (2015), where the peak consumption occurs from 8:00 to 9:00. For the holidays season (typically in May and September) the influx is represented by group 3, that is to say, its value in water consumption is the one used by the cleaning staff. On the other hand, during the schooling year, the days of greatest consumption are those of group 1 (Figure 5) with a maximum of 0.24 m3 during midday, while for group 2 (Figure 6) the highest consumption occurs after 13:00 hrs., which amounts to 0.17 m3. It turns out that this is the hour at which students leave lectures in the W building. Both groups consider 0.32 m3 of water usage for cleaning tasks.

Collection-consumption balance
During the dry season, April is the only month that can offer more water than that necessary (Figure 7), this means that during this season there is a deficit of about 40%, however, this is not comparable in magnitude with the surplus obtained during the months corresponding to the rainy season, for which during July is around 90% with respect to the consumption. During the rainy season, not only there is an increase in the frequency of rainfall, but in the intensity as well; practically twice as much waterfalls every time it rains (Rodriguez, 2017). All this information shows the high potential for water collection concerning consumption throughout the year.

By the end of a year, after collecting rainwater and satisfying the consumption of the building, a surplus of 1,259 m3 can be used to supply the demand in other buildings of the UAM Azc or to be employed in other necessities (see Figure 8), or send it back in the groundwater aquifer through the absorption well, thus helping to mitigate groundwater aquifers overexploitation in Mexico City, for this is the main source of water supply (Canteiro, Olea, Escolero, & Zambrano, 2019).

Storage tanks operation
All tanks evaluated have a corresponding storage volume of 5 m3, 10 m3 y 20 m3, respectively, for which it is considered that their operation begins on the first day of the year. It turns out that for all cases, during the first year of operation, the system requires 43 m3 of an external endowment for January to March. However, starting from the second year, this external endowment is no longer required. Once the tank has reached its maximum capacity in March, the volume of rainwater collected does not decrease in the following months (see Figure 9). Based in the previous information, purchasing a tank of 5 m3 in capacity will be enough to store water in the building implying lower investment cost.
Historical operation simulation
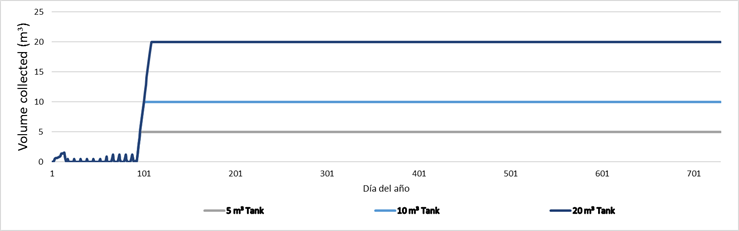
When simulating the system behavior, daily average precipitation values are replaced for records of each day corresponding to the year 2015 (for which records are complete). The result shows what would have been the performance of the tank if the system would had been implemented since January 1 (Figure 10). It is important to clarify that the year 2015 presented an average precipitation of 680 mm, which is 19% lower than the historical average (837 mm). The tank with the required capacity to store the water is the one with volume of 5 m3. It would have been required 63 m3 of an external endowment until March. Once filled, a 100% of consumption is satisfied (see Figure 10).

In the literature, other studies with similar methodologies have been reported, however, conditions regarding to precipitation, collecting or consumption are different. López, Cruz and Rojas (2018) conducted their study in Mexico City hosted by a logistics company. These authors conclude that water harvesting can meet 100% the demand of water consumption. They explain that this is possible because of the correspondence between the collecting area and the number of users is also significant. Palacio (2010) employed a similar methodology in an educational institution in Caldas, Antioquia, Colombia. This author also considers costs for treatment to make it drinkable, concluding that during nine months of the year, toilets and cleaning activities are covered 100%, however, for the remaining months only 90% is covered. Karan and Jakhar (2006) employed a similar methodology applied to two educational institutions in New Delhi, where it is only possible to cover 65% of the water demand during five months considered by the study. The present study and that conducted by López et al. (2018) both in Mexico City, consider an average annual rainfall of 837 y 730 mm respectively, whereas the study conducted by Palacio (2010) reports the highest average annual precipitation of 2,938 mm. On the other hand, Karan and Jakhar (2006) reported in their study an average of 693 mm, most likely to be present during the summer.
Conclusions
This article presents a methodology that can be applied to Universities and Colleges despite its locations, depending on precipitation, collecting areas and variation in consumption.
The balance for collection-consumption-storage-water developed for the W building in the Universidad Autónoma Metropolitana, estimates that it is possible to meet 100% the demand of the building water consumption, even with a surplus. The results allow to identify that for the system startup, this requires an external endowment for 43 m3during the first three months of the first year. The results also show that this system can cover the necessities of the bathrooms and cleaning activities of the building in any other season.
The simulation results allowed to identify that it is sufficient to use a tank with capacity of 5 m3 to store rainwater, however, a larger tank can be implemented to supply other buildings.
It should be noted that the building under study represents a particular case within the University, because of only a small number of users attend it, mainly because this is a building meant to host laboratories, however, this is a first approach to the implementation of this type of water collection systems for the University. This same study carried out in another type of building (with greater concurrence) will surely result in water deficit. A future study will allow us to know this relationship in all the buildings and enable the modelling of an interconnected system of tanks and collecting areas.
Deploying this rainwater collecting system will help to reduce water consumption in the local network while at the same time alleviating over-exploitation of the groundwater aquifer. The amount of rainwater collected during a storm will not be directed to the sewage, decreasing the probabilities of blocking this system by avoiding floods and money expenditures to deal with these.
Acknowledgements
Universidad Distrital Francisco José de Caldas.
REFERENCES
Aparicio, F. (1992). Fundamentos de hidrología de superficie. México, DF, México: Limusa. [ Links ]
Braga, A., O'Grady, H., Dabak, T., & Lane, C. (2018). Performance of two advanced rainwater harvesting systems in Washington, DC. Water (Switzerland), 10(5), 667. DOI: 10.3390/w10050667 [ Links ]
Canteiro, M., Olea, S., Escolero, O., & Zambrano, L. (2019). Relationships between urban aquifers and preserved areas south of Mexico City. Groundwater for Sustainable Development, 8(2019), 373-380.DOI: 10.1016/j.gsd.2018.12.007 [ Links ]
Conagua, Comisión Nacional del Agua. (2015). Diseño de redes de distribución de agua potable. En: Manual de agua potable, alcantarillado y saneamiento (p. 122). México, DF, México: Comisión Nacional del Agua. [ Links ]
Fulton, L. (2018). A simulation of rainwater harvesting design and demand-side controls for large hospitals. Sustainability (Switzerland), 10(5), 1659. DOI: 10.3390/su10051659 [ Links ]
Guerrero, T., Rives, C., Rodriguez, A., & Saldivar, Y. (2009). El agua en la ciudad de México. Ciencias, 94(2009), 16-23. [ Links ]
Gutiérrez, A. (2017). CDMX, ¿Una ciudad estresada? El agua, (s.v.), 24-32. [ Links ]
Helvex. (2000). Guía técnica de servicio para producto institucional Helvex. Segunda edición, Ciudad de México, México. [ Links ]
Ibne, M., Rezaul, M., & Alam, M. (2018). Reliability and economic analysis of urban rainwater harvesting: Acomparative study within six major cities of Bangladesh. Resources, Conservation & Recycling, 133 (June 2018), 146-154. DOI: 10.1016/j.resconrec.2018.01.025 [ Links ]
Karan, R., & Jakhar, N. (Noviembre, 2006). Rooftop rainwater harvesting and its potential - Case studies in New Delhi. National Seminar on Rainwater Harvesting and Water Management.Seminario llevado a cabo en The Institution of Engineers (India) Nagpur Local Centre, Nagpur, India and United Nations Educational, Scientific and Cultural Organisation New Delhi, India. Recuperado de: https://www.researchgate.net/publication/272237307_Rainwater_Harvesting_Practices [ Links ]
Kisakye, V., & Van der Bruggen, B. (2018). Effects of climate change on water savings and water security from rainwater harvesting systems. Resources, Conservation and Recycling, 138(2018), 49-63. DOI: 10.1016/j.resconrec.2018.07.009 [ Links ]
López, M., Cruz, M., & Rojas, A. (2018). Rainwater harvesting as an alternative for water supply in regions with high water stress. Water Science & Technology: Water Supply, 18(6), 1-10. [ Links ]
Magaña, V., López, L., & Vázquez, G. (2013). El pronóstico de lluvias intensas para la Ciudad de México. TIP, 16(1), 18-25. [ Links ]
Medina, V. (2016). Rainwater Harvesting. (Technical report, Affiliation: United States Army Corps of Engineers-Whole Building Design Guides) Recuperado de: https://www.researchgate.net/publication/299447319 [ Links ]
NATURALES, Secretaría de Medio Ambiente y Recursos Naturales. (1998). NOM-003-SEMARNAT-1997. Límites Máximos Permisibles para las Aguas Residuales Tratadas que se reúsen en Servicios al Público Recuperado de: http://www.conagua.gob.mx/CONAGUA07/Publicaciones/Publicaciones/SGAA-15-13.pdf [ Links ]
Palacio, N. (2010). Propuesta de un sistema de aprovechamiento de agua lluvia, como alternativa para el ahorro de agua potable, en la institución educativa María Auxiliadora de Caldas, Antioquia. Antioquia, Colombia: Universidad de Antioquia. [ Links ]
Rahman, A., Keane, J., & Alam, M. (2012). Rainwater harvesting in Greater Sydney: Water savings, reliability and economic benefits. Resources, Conservation and Recycling, 61(2012), 16-21. DOI: 10.1016/j.resconrec.2011.12.002 [ Links ]
Rodriguez, S. (25 de septiembre de 2017). La Ciudad de México, entre la inundación y la escasez. Ciudad de México, México: Instituto Mexicano para la Competitividad. [ Links ]
Saeedi, I., & Goodarzi, M. (2018). Rainwater harvesting system: A sustainable method for landscape development in semiarid regions, the case of Malayer University campus in Iran. Environment, Development and Sustainability, 1-20. DOI: 10.1007/s10668-018-0218-8 [ Links ]
SALUD, Secretaría de salud. (1995). NOM-127-SSA1-1994. Límites permisibles de calidad y tratamientos a que debe someterse el agua para su potabilización. Recuperado de: http://www.salud.gob.mx/unidades/cdi/nom/127ssa14.html [ Links ]
SMN, Servicio Meteorológico Nacional. (2010). Normales climatológicas del Distrito Federal. México, DF, México: Servicio Meteorológico Nacional. [ Links ]
Zaragoza, E. (2013). Caracterización del agua de lluvia para evaluar sus posibles usos. (Tesis de grado). Universidad Autónoma Metropolitana - Unidad Azcapotzalco. Ciudad de México, México. [ Links ]
Received: September 12, 2018; Accepted: March 26, 2019
 Este es un artículo publicado en acceso abierto bajo una licencia Creative Commons
