


 nueva página del texto (beta)
 Inglés (pdf)
 Artículo en XML
 Referencias del artículo
 Enviar artículo por email
 Citado por SciELO
  Similares en
SciELO
Similares en
SciELO 
 Permalink
Introduction
Water availability has become a major problem worldwide, especially in arid and semi-arid regions (Alatorre, Díaz-Caravantes, Miramontes-Beltrán, Sánchez, & Bravo, 2015), where irrigation farming is done mainly by exploiting groundwater (Chauhan, Singh, & Gupta, 2008; Granados-Olivas, Creel, Sánchez-Flores, Chávez, & Hawley, 2013; Alatorre et al., 2015). About 80% of the groundwater extracted worldwide is used for irrigation (Wang, Zhang, Dawes, & Liu, 2001; Keshavarz, Ashrafi, Hydari, Pouran, & Farzaneh, 2005). In Mexico, about 76% of all water is allocated for agricultural use (Conagua, 2014). Moreover, increased demand for water for urban, industrial and ecological uses has led to a decline in the availability of water for agriculture. Therefore, the agricultural sector faces the challenge of producing more food with less water, which could be achieved by making more efficient use of water and increasing crop yields (Zwart & Bastiaanssen, 2004). For all this, the scarcity of surface water and the overexploitation of aquifers, as well as the competition between different uses, are major concerns in countries where arid and semiarid environments dominate agro-ecological conditions.
In Mexico, in 2010, about 37% of the total volume of water allocated for consumptive uses (i.e. uses in which the activity itself consumes the water) came from groundwater (Conagua, 2011a). The agricultural sector, which includes agriculture, aquaculture, livestock and other uses, had an allocated volume of water of about 61 800 hm3 yr-1, of which 33.8% was extracted from groundwater (Conagua, 2011b). In contrast, of the 11400 hm3 yr-1 allocated for urban public and domestic use, 62.2% came from groundwater. According to the National Water Commission of Mexico (Conagua, 2011a), of the 653 aquifers in the country, 32 were overexploited in 1975 (i.e. more water was being extracted from those 32 aquifers than it was recharged). By 1985, overexploitation affected 80 aquifers, and by December 31, 2009, the number had increased to 100; 53.6% of the groundwater used nationwide was being extracted from these aquifers. It is a disturbing fact that more than half of the groundwater used in Mexico comes from overexploited aquifers, but it is even more alarming that, according to Conagua (2011a), the agricultural use of groundwater increased by 23.2% between 2001 and 2009, while urban public and domestic uses of groundwater increased by 30.3% in the same period. In particular, the aquifer underlying the basin of Laguna Bustillos, in Chihuahua, Mexico, which is classified as the aquifer with the highest anthropogenic pressure in northwestern Mexico, has been seriously depleted (Díaz-Caravantes, Bravo-Peña, Alatorre, & Sánchez-Flores, 2013; Alatorre et al., 2015). This aquifer is located in a closed basin, a crucial hydrologic characteristic that explains the level of pressure to which it is subjected, as well as its depletion rate. It is recharged only by rainwater and return flows from irrigation, with an average recharge of 115 hm3 yr-1 (Conagua, 2009). Contrary to what would be expected, 1782 wells have been authorized in this basin with internal drainage, with an official allocation of 198 hm3 yr-1; still more serious is that this allocation is not respected, and 264 hm3 yr-1 are actually extracted (Conagua, 2012), which generates a considerable deficit of 149 hm3 yr-1. Out of the total groundwater used in this region, 92.7% is for agricultural use, 4% for urban use and 3.3% for livestock activities.
To address the deficit in the availability of water resources in the region, it is necessary to adopt water-saving measures in all sectors, but especially in agriculture, which currently operates with water use efficiencies well below what would be appropriate. In order to save water and increase crop yields, agricultural irrigation strategies should be programmed and scheduled precisely; new high-efficiency irrigation technologies, such as sprinkler and drip systems, should be used; and land management practices should also be improved (Zaman, Arshad, & Saleem, 2001). About 90% of the world's irrigated land is irrigated by traditional irrigation methods (i.e. furrow irrigation) that are relatively inefficient and have various efficiency problems (Tiercelin & Vidal, 2006). For example, the FAO estimates that an area of approximately 20-30 million hectares (ha) irrigated by surface irrigation methods has been severely damaged by salt accumulation; it also estimates that the area affected by salinity will increase by 0.25-0.5 million hectares per year (FAO, 2002). Surface irrigation methods include furrow irrigation, which has been reported as one of the least efficient methods compared to other irrigation methods (Burt et al., 1997); however, currently is one of the most common methods used for irrigating agricultural land. Furrow irrigation is defined as the application of water through narrow, evenly spaced (between 1.0 and 2.0 m) channels (furrows) running across the field. Although the application efficiency of this method is relatively low (Ampas & Baltas, 2009), and efforts are still being done to improve it. This is because furrow irrigation is a well-known, simple and economical method, and farmers tend to adopt new approaches that improve current practices.
Engineers specialized in the design of agricultural irrigation systems are in constant search of new methods or practices that maximize the efficiency of agricultural irrigation. The agricultural committee of the American Society of Civil Engineers (ASCE) defines irrigation efficiency as the ratio of the volume of water which is beneficially used to the volume of irrigation water applied. Irrigation efficiency tends to increase with the use of updated modern methods. For example, pressurized drip irrigation has the potential to increase efficiency in the application of water to crops because the farmer can apply small and frequent amounts of water to meet the evapotranspiration needs of crops; the reported irrigation efficiency of this method varies between 80 and 90% (Battikhi & Abu-Hammad, 1994; Chimonides, 1995). In the case of sprinkler irrigation, efficiency can range from 54 to 80% (Chimonides, 1995; Zalidis, Dimitriads, Antonopoulos, & Geraki, 1997). In contrast, the efficiency of furrow irrigation systems varies from 40 to 70% (Oster, Meyer, Hermsmeier, & Kaddah, 1986; Battikhi & Abu-Hammad, 1994; Chimonides, 1995; Zalidis et al., 1997).
There are several approaches to increase the efficiency of agricultural production using furrow irrigation. One approach involves balancing water savings and lower irrigation pumping costs with the loss of income associated with the decrease in crop yield; it also involves using the least-cost approach to pursuit production efficiency based on crop coefficients associated with evapotranspiration and crop water demand (Raghuwanshi & Wallender, 1996; Raghuwanshi & Wallender, 1997a; Raghuwanshi & Wallender, 1997b). For example, the application of low-intensity irrigation translates into lower irrigation costs, but also lower crop yields due to the water stress conditions to which the crop is subjected when the percentage of available moisture in the soil passes from Field Capacity (Fc) to the Permanent Wilting Point (PWP). Therefore, the requirements and costs of a given irrigation system depend on designing it for a given crop, using the water application technology that is appropriate to meet the water demand of the crop during its various vegetative stages. For example, irrigation systems with high flow rates (irrigation by flooding) will result in high rates of backflush runoff (surplus flows at the end of the furrow that result in lower final irrigation efficiency). In this case, more water is used and irrigation costs are higher, considerably increasing the loss of water and contaminating the soil by the accumulation of salt that results from the high rates of evapotranspiration. Therefore, this approach requires the integration of various models, based on a temporal and spatial analysis, to calculate soil moisture (available water), application efficiency of irrigation (hydraulics of furrow irrigation) and crop production (transformation of m3 of water into tons of production); this might allow to design optimal strategies for balancing production costs. In general, the integration of these models to improve the efficiency of furrow irrigation helps optimize planting schedules, irrigation programs, applied flows and harvest time (Raghuwanshi & Wallender, 1994).
The minimal cost approach consists in increasing the efficiency of furrow irrigation by optimizing the length of the furrows, without considering irrigation programs or the minimal discharge required for the water to reach the end of the plot, avoiding excessive backflush runoff that result in loss of efficiency by taking into account the physical properties of soils (slope, permeability, texture, hydraulic conductivity, cation exchange capacity, etc.) and the shape of the agricultural plots (Raghuwanshi & Wallender, 1997a; Raghuwanshi & Wallender, 1997b). For example, Holzapfel, Marino and Morales (1986; 1987) used linear and nonlinear optimization models to design surface irrigation systems taking into account the physical-chemical properties of soils and the correlation between the irrigation efficiency and the design variables of agricultural plots. An alternative to evaluate methods to the increased efficiency of furrow irrigation under the minimum production cost approach is the use of Geographic Information Systems (GIS) and remote sensing, which in recent decades have been used for precision farming (El Nahry, Ali, & El Baroudy, 2011). The use of these tools has allowed the implementation of decision-making strategies aimed to increase crop production (National Research Council, 1997). The most prominent applications include spatial and temporal analysis of field samples, mapping, analysis and management of specific areas according to the physicochemical properties of the soil, management of pest populations, analysis of the phenological characteristics of crops, etc. (Weiss, 1996; Nemenyi, Mesterhazi, Pecze, & Stepan, 2003). The development of maps of agricultural areas that include information relevant for the management of all factors involved is essential for the implementation of strategies that lead to a more efficient and sustainable production (Fridgen et al., 2004). Fleming, Westfall, Wiens and Brodahl (2000) analyzed maps of agricultural areas and concluded that the color of soil, the topography and the historical data of previous farming experiences are useful data for improving crop productivity. Remote sensing is a very powerful tool in precision agriculture, where its application is mainly based on the spectral response of soils and crops to different wavelengths (Beˇıgueˇı et al., 2008; Lee, Cohen, Kennedy, Maiersperger, & Gower, 2004; Fleming et al., 2000; Daniel, Tripathi, Honda, & Apisit, 2004; Seelan, Laguette, Casady, & Seielstad, 2003; Sullivan, Shaw, & Rickman, 2005; Moreenthaler, Khatib, & Kim, 2003; Lark & Stafford, 1997; Johnson, Mortensen, Wienhold, Shanahan, & Doran, 2003; Brock, Brouder, Blumhoff, & Hofmann, 2005; De Wit & Clevers, 2004; Buenemann et al., 2011; Löw, Michel, Dech, & Conrad, 2013; Löw, Fliemann, Abdullaev, Conrad, & Lamers, 2015; Murakami, Ogawa, Ishitsuka, Kumagai, & Saito, 2001; Wardlow & Egbert, 2008; Sharma, Yadav, Prawasi, Kumar, & Hooda, 2011; Martínez-Casasnovas, Martín-Montero, & Casterad, 2005).
The overall objective of this research was to determine the relationship between the inefficiency of furrow irrigation, the geometric characteristics of agricultural plots, and the depletion of the aquifer of the basin of Laguna de Bustillos (Chihuahua, Mexico) recorded in recent decades (1991-2002). For this purpose, the following specific objectives were defined: i) digitalization of all agricultural plots located in the basin of the Laguna Bustillos; ii) determination of the geometric characteristics and shape parameters of the agricultural plots; iii) establishment of an index of the inefficiency of furrow irrigation according to the maximum allowed length of the furrows; iv) determination of the depletion of the aquifer in recent decades (1991-2002); v) analysis of the spatial correlation between the inefficiency of furrow irrigation and the geometric characteristics of agricultural plots.
Study area and local issues
The study area is located in the basin of the Laguna de Bustillos, between coordinates 28° 13' 19'' and 28° 59' 35'' N, and 106° 34' 39 '' and 107° 10' 33'' W (Figure 1A), with a total area of 3298 km2. It is a closed basin of an irregular shape with internal drainage, geographically bounded by the mountain ranges of Pedernales, San Juan, Salitrera, Chuchupate, Sierra Azul and Rebote; the only supply of water is from rain. The basin has an average elevation of 2000 meters above sea level (masl), and is surrounded on the north, east, west and southwest by several peaks averaging 2400 meters masl, with some peaks reaching up to 2887 masl. (Figure 1B). The National Water Commission (Conagua, 2010) indicates that the place has an average annual rainfall of 415.7 mm, with tempered semi-dry climate, an average temperature of 14.6 °C and a maximum of 38 °C throughout the year.
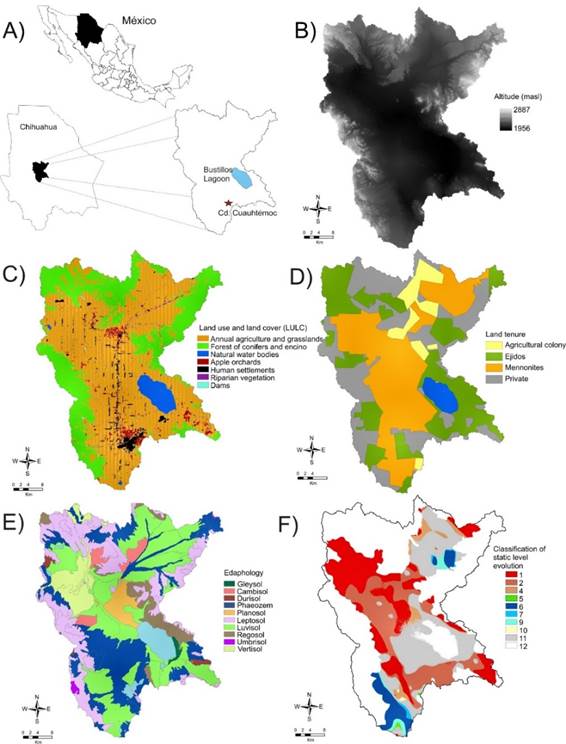
Figure 1 Geographical characteristics of the study area: A) general location of the basin of the Laguna de Bustillos; B) Digital Terrain Model (DTM) and limits of the aquifer of the basin of the Laguna de Bustillos; C) LULC for the year 2014 (Bravo, Alatorre, Díaz, Wiebe, & Moreno, 2015); D) land tenure (Chihuahua State Government); E) edaphological units (INEGI, 2014; vectorial data set of edaphological characteristics, scale 1:250 000, series II); F) temporal and spatial evolution of the static level of the aquifer of the basin of the Laguna de Bustillos during the years 1973, 1991 and 2000 (Alatorre et al., 2015).
Regarding the types of land use and land cover (LULC) in the basin of the Laguna de Bustillos (Figure 1C; Bravo, Alatorre, Díaz, Wiebe, & Moreno, 2015), annual agricultural cover and grasslands are mainly located in the valley (fluvial system). This type of cover extends near the foothills and occupies a large area of 1972 km2 (59.80%) bordered by oak-pine forest in the surrounding mountains and foothills, which cover an area of 981 km2 (29.76%; other types of cover occupy a small proportion of the study area (< 5%) (Table 1).
Table 1 Spatial distribution of the types of land use and land cover (LULC) in the basin of the Laguna de Bustillos.
| Categories | Area (km2) | % |
|---|---|---|
| Annual agricultural and grasslands | 1972 | 59.80 |
| Oak-pine forest | 981 | 29.76 |
| Natural water bodies | 114 | 3.47 |
| Apple orchards | 85 | 2.57 |
| Human settlements | 106 | 3.20 |
| Riparian vegetation | 32 | 0.96 |
| Dams | 9 | 0.26 |
| Total | 3298 | 100 |
The area is mostly owned by Mennonites, who occupy an area of 1256 km2 (Figure 1D; Table 2). Mennonites arrived in Chihuahua in 1921, when they bought 112 000 hectares belonging to old cattle ranches of the nineteenth century; these ranches were located in the catchment area of the aquifer. The lands not purchased by Mennonites were distributed as Ejidos under postrevolutionary agrarian reform policies (Castro-Martínez, 1999) or sold to ex-cowboys and ex-laborers of the old ranches in the region as private properties or agricultural colonies (Castro-Martínez, 2000).
Table 2 Spatial distribution of land tenure in the basin of the Laguna de Bustillos
| Land tenure | Area (km2) | % |
|---|---|---|
| Agricultural colony | 214 | 7 |
| Ejidos | 906 | 28 |
| Mennonites | 1256 | 36 |
| Private | 922 | 29 |
| Total | 3298 | 100 |
The arrival of foreign immigrants with a different culture, and how the land was sold established a particular form of spatial organization of the agricultural properties in the basin. Mennonite properties dominate the bottom of the valley, which has the best conditions for agriculture. In contrast, Ejido properties, which occupy an area of approximately 906 km2 are located mainly in the mountains and piedmont areas, where physiographic characteristics do not allow for intensive agricultural exploitation. Private cattle ranches are also found in the mountains; agricultural colonies are the type of land tenure that occupies the smallest area.
Regarding the spatial distribution of FAO soil properties, the bottom of the valley (fluvial system) is mainly occupied by Phaeozem soils (Figure 1E), which are characterized by a marked accumulation of organic matter in the topsoil, which makes them fertile soils that can support a variety of crops and pastures. There are also Vertisol soils, whose main characteristic is the alternation between expansion and contraction of the clay, which makes these soils friable during the dry season and plastic during the wet season. This makes tilling very difficult and hinders the formation of root systems, except during the short periods of transition between the two seasons. Nonetheless, with good soil practice and management, these are very productive soils. Luvisols have great potential for a large number of crops because they are moderately weathered soils with a high degree of saturation. Leptosols predominate in the mountains and foothills. These soils are characterized by their low depth (less than 30 centimeters) and their high content of gravel. They are unsuitable for cultivation, with very limited potential for tree crops or grass. Therefore, it is a common policy in Mexico to keep them under forest cover, since their high susceptibility to erosion makes it necessary to control their use.
Previous research conducted by Alatorre et al. (2015) that analyzed the temporal and spatial evolution of the static groundwater level of the aquifer at the basin of the Laguna de Bustillos during the years 1973, 1991 and 2000, classified the behavior of the static level into twelve categories (Figure 1F). The categories were: 1) Depletion rate greater than 1 m y-1 in 1991-2000 with an increase greater than 1 m y-1 in 1991-2000 compared to 1973-1991 (high depletion with a high increase): 2) Depletion rate greater than 1 m y-1 in 1991-2000 with an increase or decrease between -1 and 1 m y-1 in 1991-2000 compared to 1973-1991 (high depletion rate with a low increase or decrease); 3) Depletion rate greater than 1 m y-1 in 1991-2000 with a decrease greater than -1 m y-1 in 1991-2000 compared to 1973-1991 (high depletion rate with a high decrease); 4) Depletion rate lower than 1 m y-1 in 1991-2000 with an increase greater than 1 m y-1 in 1991-2000 compared to 1973-1991 (low depletion rate with a high increase); 5) Depletion rate lower than 1 m y-1 in 91-00 with a decrease greater than -1 m y-1 in 91-00 compared to 73-91 (low depletion rate with a high decrease); 6) Recharge rate greater than -1 m y-1 in 91-00 with a decrease greater than -1m y-1 in 91-00 compared to 73-91 (high recharge rate with a high decrease); 7) Recharge greater than -1 m y-1 in 91-00 with an increase or decrease between -1 and 1 m y-1 in 91-00 compared to 73-91 (high recharge rate with a low increase or decrease); 8) Recharge rate greater than -1 m y-1 in 91-00 with an increase greater than 1 m y-1 in 91-00 compared to 73-91 (high recharge rate with a high increase); 9) Recharge rate lower than -1 m y-1 in 91-00 with a decrease greater than -1 m y-1 in 91-00 compared to 73-91 (low recharge rate with a high decrease); 10) Recharge rate lower than -1 m y-1 in 91-00 with an increase greater than 1 m y-1 in 91-00 compared to 73-91 (low recharge rate with a high increase); 11) Depletion or recharge rate between -1 and 1 m y-1 in 91-00 with an increase or decrease between -1 and 1 m y-1 in 91-00 compared to 73-91 (low depletion or recharge rate with a low increase or decrease). Overall, the categories that predominate in the study area are related to those areas that showed a greater depletion rate between 1991 and 2000 compared to the 1973-1991 period; these are the areas with the highest extraction of water, which has continued to increase in recent years (shown in red, Figure 1F).
Materials and methods
Digitization of agricultural plots
The digitization of agricultural plots in the basin of the Laguna de Bustillos was based on SPOT-5 satellite images with a high spatial resolution (color fusion mode; 2.5 m) taken in 2012. The images were provided by the Receiving Station in Mexico, which is part of the SPOT constellation (ERMEXS) and is administered by the Mexican Navy. Three scenes (60 x 60 km) were used to cover the study area; they were georeferenced with a quality assurance/quality control (QA/QC) aiming at a root mean square error (RMSE) that remained below 0.5 pixels (<1.25 m), and were projected to the coordinate system UTM-13N, with WGS84 datum and ellipsoid (Figure 2). The digitization process was done following photo-interpretation criteria based on the shape and the elements associated with each polygon, at an observation scale of 1:10 000.

Geometric characteristics of agricultural plots
The geometric characteristics of agricultural plots, and the physical and chemical characteristics of the soils, establish the minimum criteria necessary to determine the inefficiency of the flow, distribution and application of water in an irrigation system. In this study, in addition to determining the basic geometric characteristics of agricultural plots, such as length, width and perimeter, some shape parameters were analyzed to assess their likely spatial correlation with the inefficiency of furrow irrigation and the depletion of the aquifer.
The most widely used shape parameter is the Gravelius coefficient, also called compactness coefficient (Gravelius, 1914). It indicates the relationship between the perimeter of an area with the perimeter of a theoretical circular area of the same surface. Its expression is as follows:
Where Cg is the Gravelius or compactness coefficient, P is the perimeter of the area, and A is the surface area. The more irregularly shaped an area is, the higher the compactness coefficient. A perfectly circular area would have a value of Cg= 1; the more irregular the area, the more the value of Cg will differ from 1.
Miller's circularity coefficient (Rc) (Miller, 1953) compares the surface of an area with the surface of a circle whose circumference is equal to the perimeter of the area in question; it is given by:
Where A is the surface and P the perimeter of the area, this expression can take values between 0 and 1, with 1 corresponding to a circular area.
The elongation ratio (Re) is defined as the ratio of the perimeter of a circle to the maximum length of a surface with the same area. The formula proposed by Schumm (1956) is as follows:
Where A is the surface area and L is the maximum length of the area. Values of Re lower than 1 correspond to elongated shapes; the lower the Revalue, the more elongated the shape of the surface.
Inefficiency of furrow irrigation
The efficiency of furrow irrigation depends on several variables such as the volume of irrigation water, the application time, the length, spacing and shape of the furrows, the roughness and slope of the terrain, the infiltration characteristics of the soil, and the water demand of the crop, among others. Therefore, the length of the furrows directly affects the efficiency of furrow irrigation affecting the amount of water applied for agriculture. The maximum length of the furrows is limited by the slope of the terrain, the geometric characteristics of the agricultural plots, and the physical and chemical properties of the soil ( Yitayew, Letey, Vaux Jr., & Feinerman, 1985; Wallender & Rayej, 1987; Raghuwanshi & Wallender, 1996; Raghuwanshi & Wallender, 1998).
Thus, in this study we determined the maximum length of the furrows for each agricultural area according to the characteristics of the soil and the slope of the terrain, considering an irrigation depth of 10 cm (Table 3; adapted from Palacios, 1999). From these data, we determined an index of inefficiency of furrow irrigation based on the relationship between the proportion of the length of the actual furrow and the maximum allowed the length of the furrow according to the criteria shown in Table 3. A value between 0 and 1 indicates that the length of the actual furrow does not exceed its maximum allowed length; a value greater than 1 indicates that the actual length exceeds the maximum allowed length. For example, a value of 3 indicates that the length of the actual furrow exceeds three times its maximum allowed length, with a negative impact on irrigation efficiency. For this study, we considered a value of 1.25 as acceptable for the inefficiency coefficient; this value indicates that the actual length of the furrow exceeds its maximum allowed length by 25%. To determine the spatial distribution of the values indicated by this index of irrigation inefficiency in each of the agricultural plots, we used slope maps (%) and maps of soil properties (Figure 3).
Table 3 The maximum length of furrows (m) as a function of the slope, net depth (cm) and basic infiltration (BI; cm hr-1) (Withers & Vipond, 1980; Palacios, 1999).
| Soil type | Net depth of water (cm) |
Slope (%) | |||||
|---|---|---|---|---|---|---|---|
| Texture | BI (cm/hr) |
0.25 | 0.5 | 1 | 1.5 | 2 | |
| Light | > 5 | 5 | 150 | 120 | 70 | 60 | 50 |
| 10 | 210 | 150 | 110 | 90 | 70 | ||
| 15 | 260 | 180 | 120 | 120 | 90 | ||
| Medium | 1 .- 3 | 5 | 250 | 170 | 130 | 100 | 90 |
| 10 | 375 | 240 | 180 | 140 | 120 | ||
| 15 | 420 | 290 | 220 | 170 | 150 | ||
| Heavy | < 0.5 | 5 | 300 | 220 | 170 | 130 | 120 |
| 10 | 450 | 310 | 250 | 190 | 160 | ||
| 15 | 530 | 380 | 280 | 250 | 200 | ||
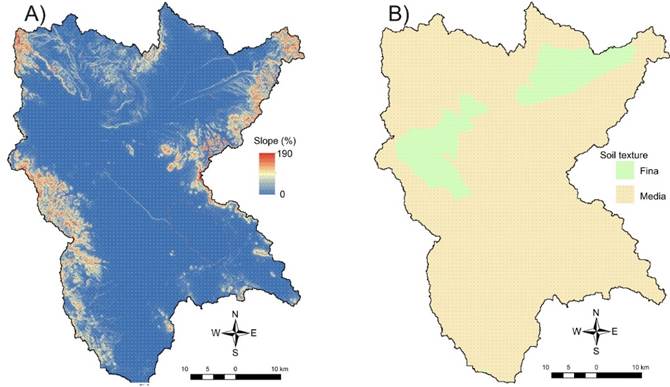
Figure 3 Characteristics used to determine the maximum length of the furrows for each agricultural state: A) slope of the terrain according to the "Modelo Continuo de Elevaciones Mexicano 3.0" (CEM 3.0) with a 15-meter resolution (INEGI, 2013). B) soil texture, obtained from the vectorial data set of edaphological characteristics; scale 1: 250 000, Series II (INEGI, 2014).
Depletion of the static water level (SWL) of the aquifer (1991-2002)
Depletion of static water level (SWL) is a common impact at overpumped aquifers, affecting its natural conditions. In numerical analysis, the term "interpolation" refers to the estimation of new data points based on the knowledge of a discrete set of points. In engineering and certain sciences, a certain number of data points can be often obtained by sampling or from an experiment, and it is possible to build a function that fits these points and that can be used to predict the spatial distribution and values of new points for which there is no data. Thus, interpolation methods can be used to predict unknown values of any parameter characterizing a geographical point, such as elevation, rainfall, chemical concentrations, noise levels, etc. In our case, we used interpolation methods to perform a temporal and spatial analysis of the depletion of the SWL of the aquifer of the basin of the Laguna de Bustillos.
Equipotential lines corresponding to the SWL of the aquifer at the basin of the Laguna de Bustillos were digitized from images produced by geo-hydrological studies carried out by the National Water Commission in the years 1991 and 2002 (Figure 4). These are the most recent measurements of the SWL of this aquifer. We then determined the vertices of each equipotential line to evaluate the interpolation methods contained in the Geostatistical Analysis module of the ArcGis 9.3 software.

The following interpolation methods were used: i) Inverse Distance Weighting (IDW); ii) Global Interpolation Polynomial; iii) Local Interpolation Polynomial; (iv) Radial Basis Function (RBF). Radial basis functions include the following techniques: completely regularized spline, spline with tension, multiquadric, inverse multiquadric and thin-plate spline; each of these techniques can be used to make interpolations of the parameters of a surface with an optimal smoothing level, depending largely on the mean square error, which should be as close to zero as possible. The last interpolation method used was: iv) Ordinary Kriging. After obtaining predicted values with each of the interpolation methods, we evaluated the prediction errors (mean error and mean square error) and selected the most optimal method for creating maps of the zone based on the data for 1991 and 2002 (Alatorre et al., 2015). Finally, we determined the degree of depletion of the aquifer of the basin of the Laguna de Bustillos by subtracting the values of 1991 from those of 2002; positive values should be interpreted as recharge areas and negative values as depletion.
Statistical correlation between irrigation inefficiency, geometric characteristics and level of aquifer depletion
Pearson's linear correlation test was used to determine the existence of statistically significant spatial correlation between the index of inefficiency of furrow irrigation, the geometric characteristics of agricultural plots (length, width, perimeter, compactness, circularity and elongation) and the behavior in recent decades of the SWL of the aquifer of the basin of Laguna de Bustillos. For this, we conducted a sampling of 1000 random points over the study area, determining the index of inefficiency of furrow irrigation, geometric characteristics and the behavior of the SWL of the aquifer for each point (Figure 5). Before using these data to calculate Pearson correlation coefficients, we verified that there were no outliers, which may cause erroneous results.

Results and discussion
Geometric characteristics of the agricultural plots
The digitization of the information that characterizes the agricultural plots located in the study area took about a year; the result is shown in Figure 6A. The basin of the Laguna de Bustillos contains 19 994 agricultural plots, with an average area of 6.9 ha (STD ± 7.46 ha), giving a total of 137.892 hectares. These results show that the smaller agricultural plots are ejidos, while the largest ones are Mennonite properties or agricultural colonies (Figure 1D and 6B).
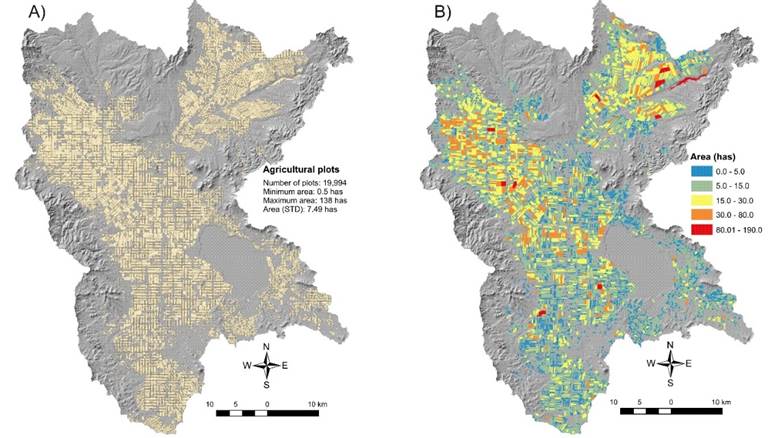
Figure 6 Result of the digitization of agricultural plots located in the basin of Laguna de Bustillos: A) agricultural plots; B) spatial distribution of the surface (ha) of the agricultural plots.
From these results, we determined basic geometric characteristics such as length, width and perimeter, as well as shape parameters such as compactness, circularity and elongation (Figure 7). Agricultural plots of 600-1000 m dominate most of the study area to 1000-2000 m in length, mainly Mennonite properties and agricultural colonies; plots shorter than 420 m were all ejidos (Figure 1D and 7A). Most agricultural plots are less than 400 m in width, mainly Mennonite properties and agricultural colonies; in the north, some scattered properties are ranging from 400 to 1000 m in width; these plots include Mennonite properties, agricultural colonies and ejidos (Figure 1D and 7B). The perimeter of most agricultural plots measures 1500-5000 m; these are mostly Mennonite properties and agricultural colonies. Agricultural plots with perimeters of less than 1500 m can be found to the southwest of the area, where many ejidos are located (Figure 1D and 7C). The analysis of the length, width and perimeter of the agricultural plots shows that Mennonite properties are the largest, longest and less wide agricultural plots; consequently, they have the largest perimeters, which means that they are not very suitable for the application of furrow irrigation; nonetheless, the dominant irrigation system on these ag-fields is furrow irrigation, which is the less efficient.

Figure 7 Basic geometric characteristics and shape parameters of the agricultural plots found in the basin of the Laguna de Bustillos. A) Length (m); B) Width (m); C) Perimeter (m); D) Compactness; E) Circularity; F) Elongation.
Regarding the shape parameters, agricultural plots with values of compactness close to 1 (i.e., with less irregular areas or almost equal in length and width) are mostly ejidos and agricultural colonies, although in the northwestern part of the study area there are some Mennonite properties with this feature. However, most agricultural plots in the central part of the study area, which are mostly Mennonite properties, are irregularly shaped, with values of compactness greater than 1 (Figure 1D and 7D). The same can be said of circularity; less irregular agricultural plots, with values closer to 1, are ejidos and agricultural colonies, while most Mennonite properties are irregularly shaped and have values of circularity closer to 0 (Figure 1D and 7E). Regarding the elongation ratio, the most elongated agricultural plots, with values lower than 1, are Mennonite properties, while the less elongated plots are ejidos and agricultural colonies (Figure 1D and 7F). Thus, the shape parameters of the agricultural plots in this area indicate that Mennonite properties use space very differently than ejidos and agricultural colonies, which undoubtedly influences how groundwater is used for irrigation.
These results coincide with the findings of Bravo et al. (2015), who used landscape ecology indicators to analyze the spatial heterogeneity and structure of different land uses under the same types of land tenure in this and other nearby areas. Although these authors did not work at the level of individual agricultural plots and studied large patches of land use instead, they also found that Mennonite properties have a smaller ratio between area and perimeter (i.e. the perimeter is very large compared to the area) than other forms of land tenure. This finding is clarified and confirmed by this study, which shows that most individual agricultural plots in the basin are greatly elongated compared to the area they occupy.
Very elongated agricultural plots, as are most Mennonite properties in the study area, are qualitatively and quantitatively different from agricultural plots under other types of land tenure. The shape of these properties is clearly reminiscent of the agricultural plots observed in regions of the Netherlands and Germany, from where this religious group emerged during the protestant Reform in Europe (Warkentin, 1959). In those regions, most agricultural plots were located along rivers and floodplains, and their elongated shape was meant to provide all farmers equal access to water.
This type of spatial arrangement, practiced by the ancient Mennonites, is known as "joint occupation of space" (Francis, 1948), and made sense under biophysical and water availability conditions that were very different from those observed in the basin of the Laguna de Bustillos. In this area, unlike the region from which the first Mennonites emerged, there is very little surface water, and virtually all water used for irrigation is obtained from groundwater sources. It is certainly a spatial arrangement of great historical and cultural value, but in this case, has the disadvantage of favoring irrigation inefficiency.
Determination of an index of the inefficiency of furrow irrigation
To determine the index of inefficiency of furrow irrigation, we determined first the maximum allowed length of the furrows determined according to the characteristics of the soils and the slope. That maximum allowed length ranged from 70 to 300 m, but in most of the area, the maximum allowed length was between 100 and 250 m (Figure 8A). The index of inefficiency of furrow irrigation, based on the ratio between the length of the actual furrow and the maximum allowed length, shows that the study area contains agricultural plots that meet the criteria of maximum allowable length (values of less than 1.25); these plots are mainly located in the south of the study area and more frequently in the foothills (ejido properties), although it is worth noting that there are other agricultural plots that meet this criterion scattered throughout the basin and under other types of land tenure (Figure 1D and 8B). This result shows that most of the agricultural plots in the study area do not meet the criteria of the index of inefficiency of furrow irrigation (with values ranging from 1.25 to 13.0), as some of them exceed 1.25 to 13 times the maximum allowed length of the furrows. As demonstrated by the basic geometric characteristics and shape parameters of the agricultural plots located in the study area, the Mennonite properties have the worst conditions of inefficiency for furrow irrigation, with index values of 3.5-5.0 to 5.0-13.0.

Figure 8 Determining the maximum length of the furrows (A) and the index of irrigation inefficiency (B).
Numerous studies have shown that when furrow irrigation is used under certain conditions (establishment of an irrigation calendar, control of the application time, timely change of siphons, slope control, reduction of runoff at furrow ends), the efficiency values range from 40 to 70% (Oster et al., 1986; Battikhi & Abu-Hammad, 1994; Chimonides, 1995; Zalidis et al., 1997). These results demonstrate that, in our study area, it would be a challenge to have minimum acceptable irrigation efficiencies (50%) if the maximum length of the furrows is exceeded, even when controlling parameters such as the volume of irrigation water delivered, cutting time, spacing and shape of the furrows, roughness, slope and infiltration characteristics of the soil. It is worth noting that if the efficiency of irrigation is measured in economic terms (t ha-1 mm-1), the system of furrow irrigation is the least efficient. Al-Jamal et al. (2001) conducted a study comparing the economic efficiency of different methods of irrigation and found that the best results are obtained with the sprinkler system, followed by drip and furrow irrigation. However, they also mention that the drip system is the best to maximize production (t ha-1), followed by the sprinkler system and by furrow irrigation.
Spatial and temporal evolution of the SWL of the aquifer of the basin of the Laguna de Bustillos (1991-2002)
The values of the static level of the aquifer of the Laguna de Bustillos (Figure 4) were used to compare different interpolation methods according to their prediction errors (the mean error and the mean square error) (Alatorre et al., 2015). The regularized Spline method showed the most optimal values according to the work done by Alatorre et al. (2015). The results of the interpolation process show that in 1991 the static level had higher values than those observed in 2002 (Figure 9A and B), indicating a decrease of the static level of the aquifer of the basin of the Laguna de Bustillos. To estimate the depletion rate, we subtracted the values of 1991 from those of 2002 (Figure 9C). The result of this subtraction shows a maximum depletion of -80 m in just 12 years (red zone); this translates into a depletion rate of -7.2 m y-1, but there are also recharge areas where the SWL increase 20 m, at a recharge rate of +1.8 m y-1; these could be natural recharge areas. In general, the average SWL for the entire basin stood at -22 m, which translates into a depletion rate of 2 m y-1.

Figure 9 Temporal and spatial evolution of the static level of the aquifer of the basin of the Laguna de Bustillos (Map A and B represent depletion areas): A) static level in 1991; B) static level in 2002; C) subtraction of the static levels of 1991 from those 2002, showing depletion and recharge.
A previous work by Alatorre et al. (2015) carried out mathematical modeling of the evolution of the SWL of the aquifer of the Basin of Laguna de Bustillos, and compared the periods 1973-1991 and 1991-2000. That work showed that the period 1991-2000 had a higher rate of depletion than that observed in the period 1973-1991; the area corresponding to this level of depletion was mainly located in the lowlands, which are dominated by Mennonite properties. A study by Conagua (2002) showed that the evolution of the static level of the aquifer during the period 1988-1997 was marked by widespread depletion. The largest decreases were recorded in the lower portions of the valley with values in the range of -20 to -25 m (-2.2 to -2.8 m y-1); decreases of between -10 and -25m (-1.1y 2.8 m y-1) were recorded near the town of Cuauhtémoc, and of -15 m (-1.7 m y-1) around the Laguna de Bustillos, which indicates that these decreases were caused by excessive extraction of groundwater. The average annual rate of depletion for this period was -2.0 m y-1. In general, if these trends continue, the conclusions of the report of Conagua and Colpos of 2007 (Conagua & Colpos, 2007) will be confirmed. That report said that the solution to the problem of groundwater depletion in the region of Cuauhtémoc, Chihuahua, Mexico, exhibits a very high degree of complexity, mainly due to the huge recharge deficit, and that by 2019 the aquifer could become depleted.
Statistical correlation between variables
Our main result is that the index of inefficiency of furrow irrigation shows correlation with the geometric characteristics of the agricultural plots and with the level of depletion of the aquifer of the basin of Laguna de Bustillos in recent decades. The results of the Pearson's correlation test are shown in Table 4. The correlation between the variables had a high level of statistical significance (<0.01); only the width of agricultural plots showed no relationship with the index of inefficiency of furrow irrigation. In general, the results show that the inefficiency of furrow irrigation has a high correlation with the geometric characteristics of agricultural plots, and it's also statistically correlated with the depletion of the aquifer of the basin of Laguna de Bustillos.
Table 4 Results of Pearson's correlation test and level of statistical significance.
| Length | Width | Perimeter | Compactnees | Circularity | Elongation | SWL 2002-1991 | ||
|---|---|---|---|---|---|---|---|---|
|
Inefficiency Furrow irrigation |
Pearson correlation |
0.690** | 0.006 | 0.630** | 0.467** | -0.445** | -0.428** | 0.141** |
|
Sig. (bilateral) |
0.000 | 0.886 | 0.000 | 0.000 | 0.000 | 0.000 | 0.000 | |
| N | 1000 | 1000 | 1000 | 1000 | 1000 | 1000 | 1000 | |
**. The correlation is significant at the 0.01 level (bilateral).
*. The correlation is significant at the 0.05 level (bilateral).
These correlation coefficients indicate that the differences in the shape of agricultural plots have a significant effect on the sustainability of groundwater. These differences are linked to the social practices of the human groups living in the catchment area of the aquifer, and put into perspective the importance of the cultural and historical aspects of environmental management and the regulation of groundwater use. Very elongated agricultural plots made sense in a different environmental reality, under different conditions of access to water. However, elongated agricultural plots are not suited for conditions characterized by water scarcity and the need to make efficient use of agricultural irrigation.
These correlation coefficients show the need to rearrange the shape and geometry of agricultural plots. Although it seems a matter of simply shortening the length of the plots, cultural motivations and resistances should be taken into account. If it is not possible to overcome these cultural aspects, the focus should turn to develop and adopting technologies that optimize the use of irrigation water in elongated plots.
Conclusion
The results of this research make a significant contribution to the understanding of the impact of anthropogenic activities on the land, including the ways in which the land is appropriated and exploited. The combination of remote sensing through SPOT images with photo-interpretation techniques showed to be a great tool for generating detailed maps of the agricultural plots located in the basin of the Laguna de Bustillos.
The following results are worth highlighting: the analysis of the geometric characteristics and shape parameters of agricultural plots showed that Mennonite properties have the least favorable conditions for the use of furrow irrigation, as they are excessively elongated. The index of inefficiency of furrow irrigation, based on the physicochemical properties of the soil and the slope of the terrain, confirms this finding; the values of the index for Mennonite properties indicate that these agricultural plots exceed by 2.5 to 13 times the maximum allowed the length of the furrows.
Moreover, the analysis of the spatial and temporal evolution of the depletion of the aquifer in recent decades (1991-2002) shows that the areas with the highest levels of depletion (up to -80 m) correspond mainly to Mennonite properties. The analysis of the correlation between variables showed that the index of inefficiency of furrow irrigation is directly related to the geometrical characteristics of the agricultural plots and the level of aquifer depletion. Finally, it is clear that addressing this problem will require a system of territorial planning that includes the geometrical rearrangement of the agricultural plots located in the basin or the use of new technologies such as sprinkler and drip irrigation, as well as territorial strategies that increase the areas of natural and artificial recharge of the aquifer.

