


Services on Demand
Journal
Article
 text in
  English (pdf)
 Article in xml format
 Article references
 Send this article by e-mail
Indicators
-
 Cited by SciELO
 -
 Access statistics
Related links
-
 Similars in
SciELO
Similars in
SciELO
Share

 Permalink
Tecnología y ciencias del agua
On-line version ISSN 2007-2422
Tecnol. cienc. agua vol.10 n.5 Jiutepec Sep./Oct. 2019 Epub Feb 15, 2020
https://doi.org/10.24850/j-tyca-2019-05-08
Articles
Incidence of the pressure on roughness coefficient C of Hazen-Williams

1Universidad Agraria del Ecuador, Guayaquil, Ecuador, fgavilanez@uagraria.edu.ec
The objective of this research was to evaluate the incidence of pressure in the friction coefficient C used in the Hazen-Williams expression, as an argument to define the diameters to reduce costs in installations using pressurized plastic pipes. For this purpose, 10 test pressures were evaluated, using 88 m polyethylene hose, two glycerin manometers, a medium flow sprinkler and a three-inch centrifugal turbine pump. The load losses were evaluated with each pressure in triplicate, with the appropriate altimetric correction of the surface, and the respective flows produced in the sprinkler. With the experimental information obtained the coefficient C was calculated, using the expression of Hazen-Williams cleared for this coefficient. With the load data and the C value, a regression model was established, determining its goodness through the respective coefficient of determination (r 2). When verifying the results it was possible to establish that the coefficient C is affected by the pressure by means of a quadratic type relation, increasing as the load increases; and maintaining more or less the same loss of energy at each of the test pressures. This result allowed to conclude that for smooth pipes such as plastic, it is possible to consider coefficient C values above 150 indicated for plastic; which consequently reduces the costs of pressurized piping systems.
Keywords: Coefficient of friction; turbulent flow; Hazen-Williams; Reynolds number; energy loss
Esta investigación tuvo como objetivo evaluar la incidencia de la presión en el coeficiente C de rozamiento utilizado en la expresión de Hazen-Williams, como argumento para definir los diámetros que permitan reducir los costos en las instalaciones que utilizan tuberías plásticas presurizadas. Para este propósito se evaluaron 10 presiones de prueba, utilizando 88 m de manguera de polietileno, dos manómetros de glicerina, un aspersor de mediano caudal y una bomba con turbina centrífuga de tres pulgadas. Se evaluaron las pérdidas de carga con cada presión por triplicado, con la debida corrección altimétrica de la superficie y los caudales respectivos producidos en el aspersor. Con la información experimental obtenida se calculó el coeficiente C, empleando para ello la expresión de Hazen-Williams despejada para este coeficiente. Con los datos de carga y del valor de C se estableció un modelo de regresión, determinando su bondad a través del respectivo coeficiente de determinación (r 2). Al verificar los resultados se pudo establecer que el coeficiente C se afecta por la presión mediante una relación de tipo cuadrática, incrementándose conforme aumenta la carga y manteniendo más o menos la misma pérdida de energía en cada una de las presiones de ensayo. Este resultado permitió concluir que en tuberías lisas como las plásticas es posible considerar valores del coeficiente C arriba de los 150 indicados para el plástico, lo que en consecuencia hace posible disminuir los costos de los sistemas de tuberías presurizadas.
Palabras clave: coeficiente de rozamiento; flujo turbulento; Hazen-Williams; número de Reynolds; pérdida de energía
Introduction
For the pressurized irrigation of crops or for drinking water installations, a series of pipes are used, which in the full context of the installation generate the most important costs of the entire system; whose proportion must be at least approximately 60%. In this respect, the design or dimensioning of diameters plays an important role in order to the installation won’t oversize or sub-dimension. When the design oversizes the installation it causes important costs in the pipes, due to the fact that will be diameters taken beyond the technically necessary ones; However, when the diameters are sub-dimensioned, the requirements in terms of pumping equipment and operating costs for energy consumption increase. From there the need to use the formulas of hydraulic calculations for the design of pipes, together with their parameters, suitable to a certain reality.
Although for the design of installations of pressurized water conduction there is an expression like Darcy-Weisbach, based on classical physics, which provides a rational basis for the analysis and calculation of pressure losses in pipes (Saldarriaga, 2007), its use in practice is not preferential, due to how tedious could be to calculate one of its parameters known as the coefficient of friction f using the most appropriate formula, but with an implicit characteristic. Situation that induces to resort to a process of mathematical iterations as, for example, Newton-Raphson, which adds a certain complexity in the calculations.
Nevertheless, to determine the coefficient of friction f there are several alternatives proposed by various authors that consider the roughness of the pipe and the type of existing flow. In the case of laminar flow, this coefficient has an exclusive dependence on the value of the Reynolds number, where the predominance of the viscous shear is important according to the law of Hagen-Poiseuille (Luszczewski, 2004); However, the problem of having expressions in the ranges of transitional to turbulent flow right, is what has given rise to several authors that have made many proposals in this regard. Hence, the Colebrook-White expression, in addition to be in function of the Reynolds number, also includes the various pipe roughnesses that define it as one of the most used and accepted for being used in the formula of Darcy-Weisbach (Giles, Evett, & Liu, 1994; Anaya, Cauich, Funabazama, & Gracia, 2014), although it is also implicit.
In contrast of the tedious process of resorting to mathematical procedures of successive iterations for the determination of the coefficient of friction f of implicit expressions such as Colebrook-White, and which can partially be solved when computers are used, in 1902 one of the most widely and empirical formula was proposed for the calculation of load losses in pipelines up to the present moment, due precisely to the large amount of existing information regarding their use, known as the Hazen-Williams equation (Méndez, 2007). Given the empirical characteristic of this formula, whose approach was made to hasten the design of potable water pipes in the USA at the beginning of 1900, leaving aside the expression of Darcy-Weisbach, its use has exclusive restrictions regarding its application; should be used only for water at room temperature, in diameters above 50 mm and flow rates less than 3 m/s (Mott, 2006).
Although the expression of Hazen-Williams is the one that is mostly used in the design of pipes due to its ease of calculation and wide acceptance among technicians, its empirical foundation means that one of its components is defined in a subjective way; which is selected based on the roughness of the internal walls of the pipes. This parameter is known as coefficient C of Hazen-Williams and was established for extreme conditions of high and medium roughness, as well as for smooth walls; adopting values of 50, 100 and 150, respectively. However, these limiting conditions do not allow to consider the influence of the pressure, and therefore, the velocity of the flow on the true value of this coefficient. In this sense, the selection of values of the roughness coefficient C to be used in the Hazen-Williams formula is a decision of great uncertainty, which is adopted customarily and with a high probability of having an oversized pipe diameter. This decision, at the end, becomes an economic limitation when it is desired to implement, for example, irrigation systems such as sprinkler systems; whose demand of pressure is relatively important.
Faced with the dilemma of selecting economically adequated coefficients C, there is the little or no information that exists about the effect that this coefficient has on the operating pressure of a pipe system; adopting fixed values, published in the literature for any flow condition and that they are only different by the different materials with commercial pipes are made.
The requirement of plastic pipes such as polyvinyl chloride (PVC) or polyethylene (PE) for the design and installation of pressurized irrigation systems, in recent times have increased substantially due to purchase of irrigation systems much more efficient in water management. Nevertheless, this need is becoming more intense due to the problems of shortage of fresh water, but at the level of small farmers the implementation of irrigation systems that allow a more optimized water management is restricted by economic issues.
The situation indicated in the preceding paragraph is a reality for Ecuador, where approximately the efficiency of application of irrigation systems reaches 61%; creating this imperative need to use efficient infrastructures in the management of irrigation water due to the scarcity of this resource and the globalized demand to improve agricultural profitability, whose only alternative lies in pressurized systems and where pipes play a huge role importance. However, given the economic constraints especially for the small farmer, this situation has affected the fact that in the country only 22.2% of the total area under pressurized irrigation has been covered in 2000 and in recent years was registered an insignificant average increase of 5.7% in the coverage mentioned (MAGAP, 2013).
Before the detailed in previous paragraphs this study was developed, whose purpose was to evaluate the incidence of the pressure on the Hazen-Williams roughness coefficient, accounting the load losses when ten working pressures are being applied and verifying the behavior or the tendence of the magnitude of the value of this coefficient. This study was carried out to corroborate the criterion that the coefficient of roughness C, in the case of plastic pipes such as PVC, can have values above 150; with which it is possible to decrease costs of pressurized irrigation facilities by selecting, according to the design, smaller diameter pipes.
Materials and methods
The research was conducted on the campus of the Agrarian University of Ecuador, located at the geographic coordinates of 02°07'56 "S and 79°35'02"W. It was proposed under an experimental design, evaluating the pressure losses produced by the effect of initial work pressures that are indicated in the second column of Table 1.
Table 1 Test pressures and pressure losses produced.
| N° | Initial pressure (kPa) |
Final pressure (kPa) |
Load losses (m) |
Height difference (m) |
Corrected load losses (m) |
|---|---|---|---|---|---|
| 1 | 137.299 | 128.117 | 0.937 | 0.05 | 0.887 |
| 2 | 179.088 | 167.606 | 1.171 | 0.05 | 1.121 |
| 3 | 206.179 | 193.091 | 1.335 | 0.05 | 1.285 |
| 4 | 245.213 | 230.059 | 1.546 | 0.05 | 1.496 |
| 5 | 275.747 | 267.482 | 0.843 | 0.05 | 0.793 |
| 6 | 310.187 | 298.939 | 1.147 | 0.05 | 1.097 |
| 7 | 345.316 | 336.596 | 0.889 | 0.05 | 0.839 |
| 8 | 376.085 | 363.914 | 1.241 | 0.05 | 1.191 |
| 9 | 415.119 | 409.147 | 0.609 | 0.05 | 0.559 |
| 10 | 443.126 | 436.699 | 0.656 | 0.05 | 0.606 |
For the test, a double nozzle sprinkler was used, whose diameter at the outlet of the main nozzle was 7.94 mm and the secondary diameter was 3.97 mm; with a flow of operation, according to its catalog, from 4.44 to 6.29 m3/h; and a maximum reach diameter of 47.3 m. The conduit used to measure the effect of friction in the reduction of hydraulic energy was a high density polyethylene hose, with an internal diameter of 54.8 mm and 88.0 m in length. It should be noted that the purpose of using hose and not pipe was to avoid the pressure losses that occur in the joints of the latter, which would complicate the definition of having friction-only head losses.
Two glycerin manometers were also used in units of lb/in2; whose readings were transformed to kPa, using the constant of 6.888. One of these gauges was installed at the beginning of the route and the other at the end of the 88.0 m length of the hose, with the previous calibration that these two pressure gauges were working in a similar way. Although the surface on which the hose was located was relatively flat, in order to have the necessary precision, the respective corrections were made for the differences in dimensions between the starting point and the end, for which a level was used. Likewise, the pressure was supplied by an internal combustion pump, with centrifugal turbine of 10 HP of power, 3 inches in the suction and discharge, and with a maximum flow rate of approximately 20 m3/h. For the adjustment of the test pressures, a ball valve was used.
The procedure consisted on measuring the flow rate at each test pressure and the respective pressure loss given by the readings on the pressure gauges, a procedure that was carried out three times for each test pressures. Finally, the value of the roughness coefficient C of Hazen-Williams was established using Expression 1, which is the proposal of these authors, but defined in metric units and from which this coefficient has been cleared. In this formula,
With the obtained data, a regression model was adjusted to verify the tendency, determining at the same time, the magnitude of the adjustment by means of the respective determination coefficient.
Results and discussion
The head losses obtained at each test pressure recorded a range from 0.559 m to 1.496 m, as shown in Table 1; no functional behavior was evidenced, because a mathematical model with an important adjustment between these two variables was not obtained. It is necessary to indicate that losses were corrected by the difference of levels between the initial and the final point, with a height of 0.05 m; which was subtracted from the loss recorded by the manometers, because the final level was higher, in this magnitude, than the initial one.
Using the expression (1), for a constant diameter and length, besides considering the load losses of Table 1, the coefficients of friction C indicated in Table 2 were determined. It is observed that the value of this coefficient is presented with an important range, ranging from 117.5 to 262.4, for flows that were between a minimum of 4.738 m3/h and a maximum of 8.615 m3/h, respectively.
Table 2 Experimental values of the Hazen-Williams coefficient of roughness C, for each test pressure.
| N° | Flow rates measured (m3/h) |
Length (m) |
Internal diameter (mm) |
Loss of charge (m) |
Coefficient C of Hazen-Williams |
Reynolds number R |
|---|---|---|---|---|---|---|
| 1 | 4.738 | 88.0 | 54.8 | 0.887 | 117.5 | 30 366 |
| 2 | 5.384 | 88.0 | 54.8 | 1.121 | 117.6 | 34 507 |
| 3 | 5.818 | 88.0 | 54.8 | 1.285 | 118.1 | 37 288 |
| 4 | 6.562 | 88.0 | 54.8 | 1.496 | 122.7 | 42 057 |
| 5 | 6.818 | 88.0 | 54.8 | 0.793 | 179.5 | 43 697 |
| 6 | 7.330 | 88.0 | 54.8 | 1.097 | 162.0 | 46 979 |
| 7 | 8.000 | 88.0 | 54.8 | 0.839 | 204.3 | 51 273 |
| 8 | 8.411 | 88.0 | 54.8 | 1.191 | 177.8 | 53 907 |
| 9 | 8.772 | 88.0 | 54.8 | 0.559 | 279.0 | 56 221 |
| 10 | 8.615 | 88.0 | 54.8 | 0.606 | 262.4 | 55 214 |
What must be highlighted when comparing the flows with the experimentally obtained load losses, indicated in Table 2, is the lack of agreement with what is established mathematically in the Darcy-Weisbach expression; that in the criterion of Trueba (1965), it is said that "for a constant diameter, the head loss is proportional to the square of the expense (or the velocity); that is, if the flow increases twice, the loss of friction load will be four times greater”. Situation that does not conform to the conception of empirical formulas, such as Hazen-Williams, where the loss of friction load also has a direct proportionality relationship with the flow to different exponents.
However, considering the proposal of Colebrook and White (1937) on the coefficient of friction f for the expression of Darcy-Weisbach, designed to be applied from the transition zone between the laminar and turbulent flows, and in all turbulent hydraulically smooth flows and hydraulically rough (Saldarriaga, 2007), which uses the Nikuradse criteria of artificial roughness, defined a function that includes the effects of relative roughness and Reynolds number (Streeter, Wylie, & Bedford, 2000). Therefore, given that turbulent flows (R> 4000) presented in all the test cases (Table 2), the component of the roughness in the head loss tends to decrease; in fact, this is visible by having a value of C that decreases with increasing flow velocity or flow. This decrease in the coefficient C as the pressure increases in a pipe of constant diameter, is what has not allowed the criterion that the loss of load has a certain proportionality with the speed of the flow in power ranges of 1.75 to 2.00 (Tarjuelo, 1999); rather, as can be seen in Tables 1 and 2, loss mentioned experienced some decrease each time the pressure increased.
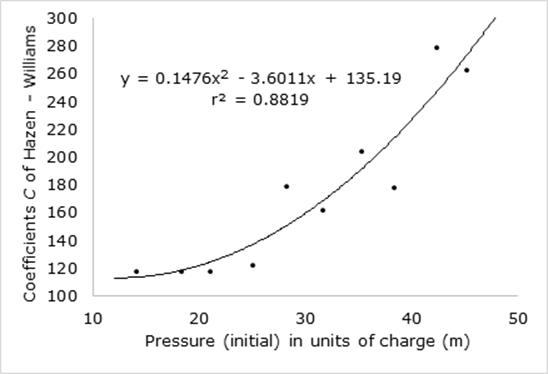
By relating the load or initial test pressure with the values of the roughness coefficient C obtained, it can be verified that these parameters are adjusted to a quadratic function in an important way, according to the determination coefficient established (r2=0.8819); as can be seen in figure 1. According to the results, the value of the coefficient C has a dependence on pressure, and therefore, on the type of flow (Saldarriaga, 2007); since at values of the Reynolds number of 30 366, the value of C was 117.5, while at values of 55 214, the value of C was increased to 262.4 (Table 2). That is, the coefficient C increases as the Reynolds number increases; which contrasts with the statement made by Streeter et al. (2000), who indicates that C must be reduced as the Reynolds number increases for a given diameter.
For a constant diameter, in smooth pipes such as plastic pipes, the coefficient C of Hazen-Williams indicates a less influence of the roughness each time the pressure (also the flow or speed) increases; hence, using values of 150 for plastic can result in an overestimation in the dimensioning of pipes. In fact, if we consider that the function indicated in Figure 1 established for a value y (coefficient C) of 150, the load to obtain said value must be 28 m (274.4 kPa); which in the case of irrigation systems such as sprinklers, whose pressure requirements go beyond 300 kPa, can result in an increase in the cost of the installation due to oversized pipes.
Conclusions
For pipes of plastic material such as polyethylene and in diameters of approximately 50 mm, the coefficient of friction C of Hazen-Williams is affected by the increase in pressure with exponential increases, which together with the recommendation given by the authors of this expression regarding the use of diameters higher than the one experienced and when a load higher than 30 m is required, in the design of the pipes that transport the same flow along their entire length (conduit pipe), values of the aforementioned coefficient can be used. "Constant" 150, established in the literature for the conductions of plastic materials. This value that, for common situations of pressurized irrigation and for irrigation areas that go beyond 10 ha, a maximum value of 220 can be adopted.
Referencias
Anaya, A., Cauich, G., Funabazama, O., & Gracia, V. (2014). Evaluación de ecuaciones de factor de fricción explícito para tuberías. Educación Química, 25(2), 128-134. [ Links ]
Colebrook, C., & White, C. (1937). Experiments with Fluid friction in roughened pipes. Proceedings of the Royal Society of London. Series A, Mathematical and Physical Sciences, 161(906), 367-381. [ Links ]
Giles, R., Evett, J., & Liu, C. (1994). Fluid mechanics and hydraulics. New York, USA: McGraw-Hill Education. [ Links ]
Luszczewski, A. (2004). Redes industriales de tubería: bombas para agua, ventiladores y compresores. Barcelona, España: Editorial Reverté, S. A. [ Links ]
MAGAP, Ministerio de Agricultura, Ganadería, Acuacultura y Pesca. (2013). Plan Nacional de Riego y Drenaje 2012-2017. Quito, Ecuador: Ministerio de Agricultura, Ganadería, Acuacultura y Pesca. [ Links ]
Méndez, M. (2007). Tuberías a presión en los sistemas de abastecimiento de agua. Caracas, Venezuela: Universidad Católica Andrés Bello. [ Links ]
Mott, R. (2006). Mecánica de fluidos. Atlacomulco, México: Pearson Educación. [ Links ]
Saldarriaga, J. (2007). Hidráulica de tuberías. Bogotá, Colombia: Alfaomega- Universidad de los Andes. [ Links ]
Streeter, V., Wylie, E., & Bedford, K. (2000). Mecánica de fluidos. Bogotá, Colombia: McGraw-Hill Interamericana, S. A. [ Links ]
Tarjuelo, J. (1999). El riego por aspersión y su tecnología. Madrid, España: Ediciones Mundi Prensa. [ Links ]
Trueba, S. (1965). Hidráulica. Ciudad de México, México: Compañía Editorial Continental S.A. [ Links ]
Received: August 08, 2017; Accepted: March 20, 2019
 Este es un artículo publicado en acceso abierto bajo una licencia Creative Commons
