


Servicios Personalizados
Revista
Articulo
 texto en
  Inglés (pdf)
 Artículo en XML
 Referencias del artículo
 Enviar artículo por email
Indicadores
-
 Citado por SciELO
 -
 Accesos
Links relacionados
-
 Similares en
SciELO
Similares en
SciELO
Compartir

 Permalink
Tecnología y ciencias del agua
versión On-line ISSN 2007-2422
Tecnol. cienc. agua vol.10 no.5 Jiutepec sep./oct. 2019 Epub 15-Feb-2020
https://doi.org/10.24850/j-tyca-2019-05-07
Articles
Factors affecting depletion and pollution by marine intrusion in the La Yarada´s coastal aquifer, Tacna, Peru
1
 http://orcid.org/0000-0001-7432-4364
2
http://orcid.org/0000-0003-3946-7188
4
http://orcid.org/0000-0002-1919-8200
5
http://orcid.org/0000-0002-8445-8996
6
http://orcid.org/0000-0003-2282-9170
1Universidad Nacional Jorge Basadre Grohmann, Tacna, Perú, epino68@hotmail.com, epinov@unjbg.edu.pe
2Universidad Nacional Agraria La Molina, Lima, Perú, liarf@lamolina.edu.pe
3Autoridad Nacional del Agua, Lima, Perú, oavalos@ana.gob.pe
4Universidad Nacional Jorge Basadre Grohmann, Tacna, Perú, num_principe@hotmail.com
5Universidad Nacional Agraria La Molina, Lima, Perú, echavarri@lamolina.edu.pe
6Universidad Privada de Tacna, Tacna, Perú, oangulo@upt.edu.pe
7Universidad Nacional Agraria La Molina, Lima, Perú, dascensios@lamolina.edu.pe
8Universidad Nacional Agraria La Molina, Lima, Perú, jabel@lamolina.edu.pe
The La Yarada aquifer, located in the Tacna region, is the most arid zone of the Peruvian coast, characterized by the scarcity of water resources. For several decades this situation resulted to the use of groundwater for the development of agriculture and other economic activities. However, due to the lack of a program for operating the aquifer it is being overexploited generating a permanent lowering of water tables, compromising their non-renewable reserves, which has caused the phenomenon of seawater intrusion due to the high concentration of groundwater wells operating in the zone next to the coastline. In this common sense, it is intended to determine the factors that affecting the depletion and contamination by seawater intrusion, characterizing the aquifer's hydrogeology and explaining the correlation between geology, hydrochemistry, geophysics and other tools used to characterize aquifers. A critical area of groundwater quality degradation in the aquifer was determined, comprising an approximate 131 km2 (60 km2 by marine intrusion) with very high values of sodium, indicating a gradual increase of this ion in response to the greater penetration of the saline wedge in areas closer to the coast and by other factors in other areas. There is also overlap between the direction of groundwater flow and the increase in chloride content, although some deviations are locally appearing. According to the geoelectric sections, there is a lower layer with low and very low resistivity’s, which indicates that the aquifer is highly mineralized in the littoral zone, a situation that denotes to the seawater intrusion processes.
Keywords: Groundwater depletion; La Yarada aquifer; hydrogeology; seawater intrusion
El acuífero de La Yarada, emplazado en la zona más árida de la costa peruana, se caracteriza por la escasez de recursos hídricos. Por tanto, desde hace varias décadas se utilizan aguas subterráneas para el desarrollo de la agricultura. Debido a la falta de un programa de explotación, el acuífero se ha venido sobreexplotando, generando un permanente descenso del nivel freático, comprometiendo sus reservas no renovables; esto ha causado el fenómeno de la intrusión marina debido a la alta concentración de pozos de explotación en la zona próxima a la línea del mar. En tal sentido, se pretende determinar los factores que inciden en el agotamiento y la contaminación por intrusión marina, caracterizando hidrogeológicamente el acuífero, y explicando la asociación entre geología, hidroquímica, geofísica y otras herramientas utilizadas para caracterizar acuíferos. Se determinó un área crítica de degradación de la calidad del agua subterránea de unos 131 km2 (60 km2 por intrusión marina), con valores muy altos de sodio, lo que indica un aumento paulatino de este ion, en respuesta a la mayor penetración de la cuña salina en las zonas más cercanas a la costa y por otros factores en otras áreas. Existe coincidencia entre la dirección del flujo subterráneo y el aumento en el contenido de cloruros, aunque localmente se aprecian algunas desviaciones. Las secciones geoeléctricas permiten identificar una capa inferior con resistividades bajas y muy bajas, lo que expresa un acuífero altamente mineralizado en el litoral, lo cual denota procesos de intrusión marina.
Palabras clave: agotamiento de acuíferos; acuífero La Yarada; hidrogeología; intrusión marina
Introduction
The rapid economic growth creates serious problems in the use of groundwater in arid zones, which usually have high rates of depletion. The integration of hydrochemical research entailing chemical and statistical analysis is carried out to evaluate the factors that control hydrochemistry and potential contamination in an arid region. The spatial distribution of nitrate shows that nitrate pollution is a persistent problem that affects a large area of the aquifer (El Alfy, Aref, Fathy, & Abdulaziz, 2017).
The need to meet the increasing demand for water is the key driver of managed recharge of aquifers, it is a standard technique to replenish and /or to improve the groundwater resources availability. One of the objectives of aquifer recharge is to provide aquifers with good water quality, even when lower quality water is used to recharge the aquifer, for example effluents from treatment plants or runoff water (Valhondo et al., 2016).
According to data obtained through the Grace satellites and made public by NASA, the major aquifers in the world on which hundreds of millions of people depend are depleting at an alarming rate. Of the 37 largest aquifers scattered around the world, from India and China to the USA or France, 21 have exceeded their sustainability point, which means that more water has been extracted from them than has been incorporated over the ten years of observation. The NASA study confirms the suspicions that many researchers already had, especially in the cases of aquifers that are not rechargeable by rain (Todd, 2015).
Climate change is affecting the production and profitability of the agricultural systems, and it is expected to continue in the future. The projections show an increase in temperature, changes in precipitation cycles, higher frequency of extreme weather events such as hurricanes and droughts, decrease in soil surface moisture, and displacement of pest populations (Vergara, Ríos, Trapido, & Malarín, 2014).
The Tacna region is located in the most arid zone of the Peruvian coast, and corresponds to the head of Atacama Desert, characterized by the scarcity of water resources, which has led, for several decades, to the use of existing groundwater in the subsoil of Caplina valley and especially of the pampas of La Yarada for the development of agriculture and other economic activities. However, due to the lack of an exploitation program, the aquifer has been overexploited (Pino, Chávarri, & Ramos, 2018), which has resulted in a gradual and permanent decrease in the water table, compromising its non-renewable reserves, which has caused the phenomenon of marine intrusion due to the high concentration of groundwater exploitation wells in the area close to the coastline. According to studies carried out by ANA (2010), a critical area of degradation of groundwater quality in the aquifer was determined, which comprises an approximate area of 131 km2 (60 km2 corresponding to marine intrusion) where the highest sodium values are located, which indicates a gradual increase of this ion in response to the greater penetration of the salt wedge, in the areas closest to the coast and by other diverse factors in other areas.
To that effect, it is intended to determine the factors that affect depletion and contamination by marine intrusion in the coastal aquifer of La Yarada, hydrogeologically characterizing the aquifer and explaining the association between geology, hydrochemistry, geophysics and other tools used to characterize aquifers.
Equipment and methods
Historical data was collected from studies, reports and technical reports. It also took part in monitoring and sampling campaigns, and the analysis of the interrelations between climate, geology, hydrochemistry, geophysics and water quality in the aquifer system has been carried out. With this comprehensive approach, we look for the interactions between the aforementioned elements to explain the response (external and internal interactions to explain the water quality in the aquifer). Therefore, this work is part of this approach. In this sense, the hydrogeological characterization and the environmental, geological and anthropic elements, would explain the resulting water quality in La Yarada aquifer, its depletion and its relationship with marine intrusion.
Gathering Information and Data Source
La Yarada aquifer is being studied for many years by different public and private institutions such as the Instituto Geológico Minero Metalúrgico - INGEMMET - (Geological, Mining and Metallurgical Institute), Autoridad Nacional del Agua - ANA - (National Water Authority), Gobierno Regional de Tacna - GORE - (Tacna Regional Government) and Proyecto Especial Tacna - PET - (Tacna Special Project) among others. Also, the World Health Organization (WHO) and the Superintendencia Nacional de Servicios de Saneamiento de Perú - SUNASS - (National Superintendence of Sanitation Services of Peru) were taken as reference of Regulatory Agencies. It has participated in several monitoring campaigns as well as in teams responsible for the studies of the aquifer; field work was carried out to verify the geological, hydrological, geophysical, and water quality information, contrasting with In Situ measurements made in the points of greatest relevance.
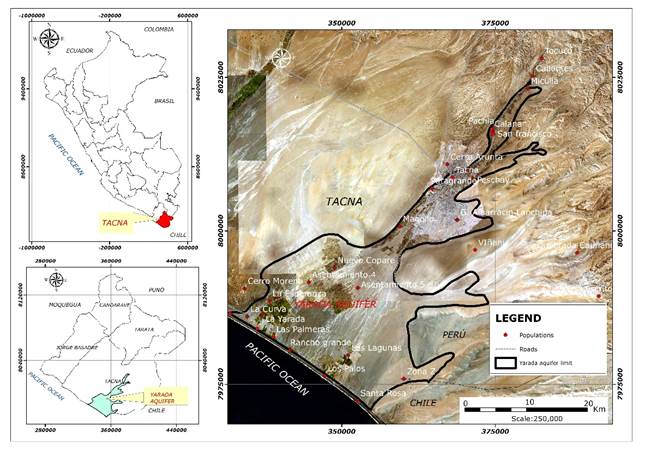
Description of the study area
The coastal aquifer of La Yarada, is located in Tacna region of southern Peru, bordering Chile and Bolivia (Figure 1), a region characterized by scarcity of surface water, a condition that has been exacerbated in recent decades due to the frequent occurrence of droughts, the expansion of the agricultural frontier with the resulting incorporation of new groundwater exploitation wells and the accelerated population growth of Tacna city.
La Yarada aquifer which is located in Caplina basin of Tacna region, is located at the head of the Atacama Desert, also La Yarada aquifer has a desert climate, whose annual rainfall is scarce and can be nil. The highest rainfall recorded in the last 20 years at Palca and Toquela stations reached 129 mm per year. The rainfall that generates runoff is in the geomorphological unit Cordillera, which presents minerals of volcanic origin, rich in Arsenic, Boron, Iron, Aluminum and Manganese, added to the climatic condition that reaches minimum temperatures of -15 ° C in winter and the effects of daytime solar radiation cause the rock to be altered and be more susceptible to river weathering and erosion. For this reason, the water that falls is combined with the sediments produced by erosion with a high content of Sulfur, Copper and other metals that constitute a natural source of pollution of Caplina River. In addition to presenting sulfide metals, the pH of the water decreases, and it generates that the water has a greater power of dissolution. The temperature presents little inter-annual variation, an annual average of 12 ° C at 3,000 m.a.s.l, with maximums of 22°C in summer and minimums of 4°C in winter, while for altitudes higher than 4,000 m.a.s.l the average reaches 3°C, maximum of 20°C in summer and minimum -15°C in winter.
The Tacna region, geographically, being located in the head of Atacama Desert, is deficient in water availability, this situation is evidenced when making a comparison with the average monthly discharges of the rivers of the Peruvian coast (Figures 2a, 2b and 2c), according to reports made for the study area.
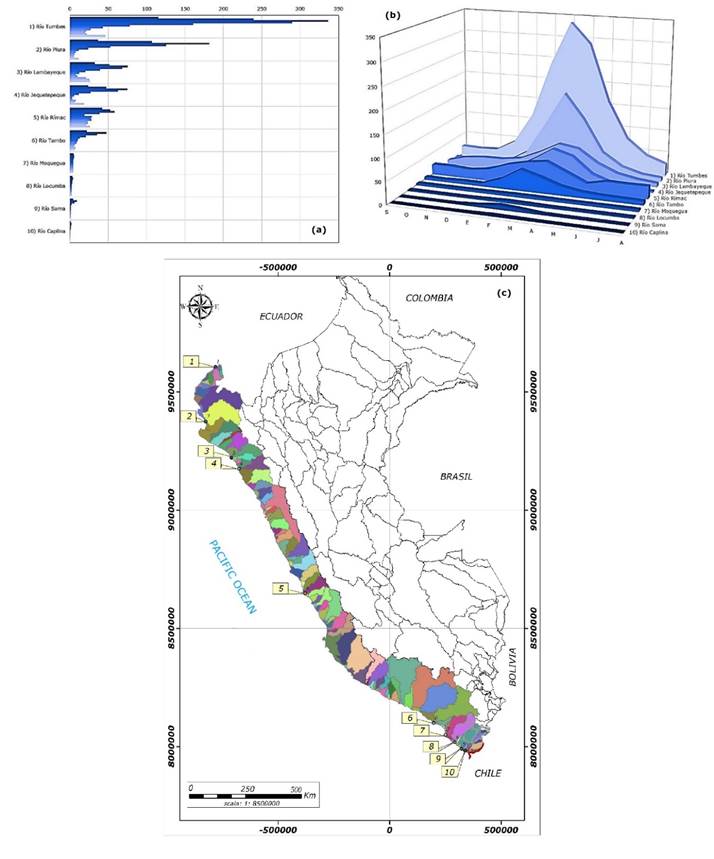
Figure 2 Monthly average downloads 2D representation (a), 3D representation (b), Location map (c), of rivers of Peruvian coast.
Faced with this situation of low availability of water for economic activities in the study area, the number of wells increased, so that, at the beginning of the exploitation of the aquifer in 1967, 31 wells were logged that exploited 13 Hm3.
Subsequently, with the operation of the Aricota hydroelectric plant, the electrification of the pumping equipment of the existing wells began and drilling of deeper wells was carried out. Therefore, in 1971, 55 wells that exploited 27 Hm3 were registered.
In 1976 there were 70 wells that exploited 30 Hm3, and in the following years, with investments from the State, settlements No. 3, 4, 5 and 6 of La Yarada Media were put into operation, as well as others made with private funds; increasing the number of operating wells to 127 in 2003, exploiting a volume of 63 Hm3.
In 2009, 251 wells in operation were inventoried, which recorded an exploited volume of 111 Hm3, in the year 2013, 502 wells were reported with an exploitation volume of 116 Hm3, this volume corresponds only to the wells with use license (PET, 2013), of the total of 502 inventoried wells in operation 105 have a license and 397 do not have it, being configured as non-authorized wells.
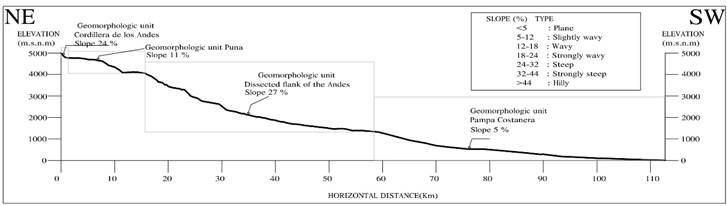
In the same way, the increased exploitation is due to a direct relation of the increase in irrigated area in the study area (Figure 3). In the longitudinal profile of Caplina basin, the altitudinal development is observed from 5000 to 0 masl on the beach line. The high slope of the upper and middle basins is noticeable, being considerably reduced in the lower part of the basin where La Yarada aquifer is located (Figure 4).

According to ANA (2011) the aquifer is overexploited and the discharge is greater than recharge, this is manifested by the steady decline of the water table. The progressive advance of the marine intrusion, reaches 60 km2 in surface and the degradation of the water quality in an area of 127 km2 that includes Los Palos, El Chasqui and Los Olivos sectors, including La Esperanza, Las Palmeras and Rancho Grande. The volume of the renewable reserve is in the order of 54 Hm3/year and the exploitation is 111 Hm3/year, therefore, the overexploitation reaches 57 Hm3/year.
Geology and stratigraphy
The geological survey of the quadrangles of La Yarada and Tacna, located in the Tacna region, comprises an extension of 2320 km2 (Figure 5a), in Figure 5b, the stratigraphic column of Caplina river basin is shown. Next, we describe the geological units: Volcanic Chocolate (Ji-ch), Moquegua Formation (Po_mos), Huaylillas Formation (Nm_hu), Millo Formation (Np_mi), Fluvial-alluvial Deposits (Qh_fa), Beach Deposits and Aeolian Deposits (Qh_e).
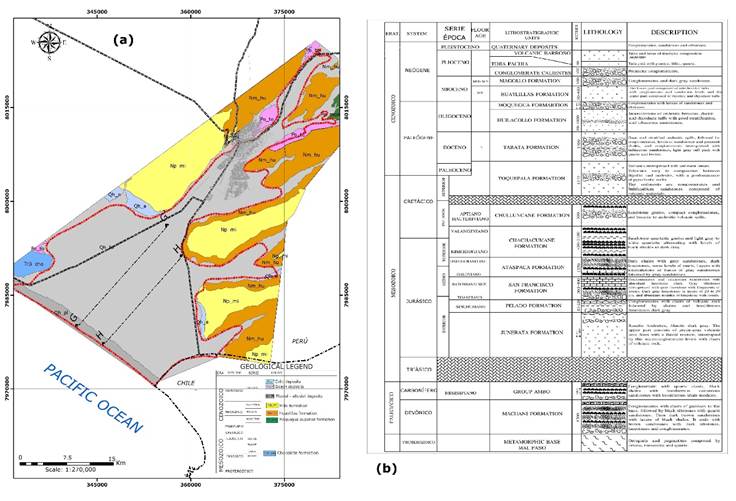
Volcanic Chocolate (Ji-ch); described for the first time by por Jaén, Ortiz and Wilson (1963) using the nomenclature that (Jenks, 1948) proposed in Yura, Arequipa. The latest reviews by the INGEMMET, describe the outcrops of the Chocolate Formation as an intercalation of volcanic and sedimentary rocks located in the extreme SW of the Coastal Range (Acosta, Mamani, Alván, & Rodríguez, 2012).
Moquegua Formation (Po_mos); is made up of detrital materials that decrease in grain size towards the southwest. In the proximal areas of the basin, that is, close to the source of supply between the mountains Pirámide, Jachacollo, Colorado, Condorire, Piedras Anchas and at the bottom of the Viñani and Cauñani streams to the north and northwest of the Tacna and Huaylillas quadrangles are thick stratigraphic successions (Acosta et al., 2012).
Huaylillas Formation (Nm_hu) is described by three members, the lower, middle and upper. The lower one is composed of pinkish tuffs with abundant lithic fragments and fragments of pumice interspersed with levels of conglomerates with sedimentary and volcanic subrounded clastic rock. The middle member comprises a succession of rhyolitic and rhyodacitic tuffs of pinkish color with pumice and lithic fragments, interspersed with thin levels of massive green sandstones (Acosta et al., 2012). According to the studies carried out by Flores and Sempere (2002) and Flores, Sempere and Fornari (2004) the sediments of the upper member consist of conglomerates and sandstones of dark gray coloration, with clasts mostly andesitic and thin evaporitic levels.
Millo Formation (Np_mi) is emerging mainly at the bottom of the streams in the form of broad and flat areas that serve as a base for Caplina, Sama, Hospicio and Escritos rivers. Its floor relation is given by the degree of erosion of the stream, observing that, by the northern area of the Tacna quadrangle, by the Perdido and Pirámide hills, they are overlying in erosive contact with the upper Moquegua Formation (Acosta et al., 2012). The size of its clasts decreases towards the southwest, also increasing the thickness of the strata. This variation is observed in the majority of exploratory wells drilled in the Pampas of La Yarada (Martines, Vargas, Montoya, Chamorro, & Zenteno, 1996; Acosta, Benavente, Cotrina, Peña, & Alván, 2008).
Fluvial-alluvial deposits (Qh_fa) constitutes mainly the permeable and exploitable horizons of underground water reaching thicknesses of up to 446 m. Lithologically they are constituted by conglomerates, sands and clays that are interspersed irregularly. In the study area these deposits constitute the dejection cone of Caplina River and its tributaries.
Beach deposits (Qh_pl), these deposits do not have major incidence in the hydrogeology of the area, due mainly to their marginal character and to constitute a strip of sand and very narrow edges, which is distributed along the coast and is related to emerged coastal escarpments.
Wind deposits (Qh_e) are accumulations of sand of wind origin, are found in the pampas of La Yarada and Hospicio, forming a thin discontinuous cover that sometimes constitute dunes and sand dunes.
The aquifer
It has been possible to determine that the aquifer is mainly of alluvial origin of quaternary age, has the shape of a rectangular polygon with a flat bottom and steep and abrupt sides. Downstream, the ejected cone of Caplina River constitutes a physiographic unit that begins in the Magollo gorge, and progressively widens downward in a delta form until it reaches the beach line. The aquifer is delimited from Calientes to the beach line from northeast to southwest by rocky outcrops with incipient wind cover, also by deposits of volcanic ash (upper part). The aquifer thicknesses (ANA, 2009) are: Calientes - Calana (139 m), Calana - Pocollay (121 m), Tacna - Magollo (86 m), Pampas San Francisco (493 m) and Viñani (316 m).
The aquifer is constituted mainly by alluvial fillings of quaternary age. Lithologically, it consists of gravels, fine to coarse sands, ridges that vary from rounded to sub-rounded; silts and clays, all of character typically fluvial. Towards the northwest and southeast sectors, the sediments come mainly from the Huaylillas and Moquegua formations, which, due to the effect of the wind, the sands undergo movements and become part of the aquifer. It has as main sources of water leaks that occur in Caplina River, Uchusuma channel and water contributions according to the occurrence of rains from the Palca, Vilavilani, Viñani, Cauñani, Espíritus and Honda gorges, which run and infiltrate in the valley and the pampas of La Yarada. On the other side, there is water infiltration that occurs in the humid zone, upper part of the basin; through fractures or rock faults, passing later to the clastic materials of the quaternary deposits.
For the analysis of the phreatic surface morphology, it has been divided into four (04) zones that are shown in Figure 6a and Figure 6b shows the average hydrodynamic parameters for each zone of the aquifer (ANA, 2010). In zones I, II, III and IV, the underground flow mainly presents orientation from Northeast to Southwest, fluctuating its hydraulic gradient between 0.20% (zone IV) and 2.75% (zone I). In certain sectors of Zone III (Yarada Antigua) such as La Esperanza and San Antonio, the direction of the underground flow reverses and has a direction of the sea towards the inland (southwest to northeast), also observing negative water levels, which is product of intense exploitation in that sector, causing the phenomenon of marine intrusion. Table 1 shows the characteristics of the phreatic surface morphology.
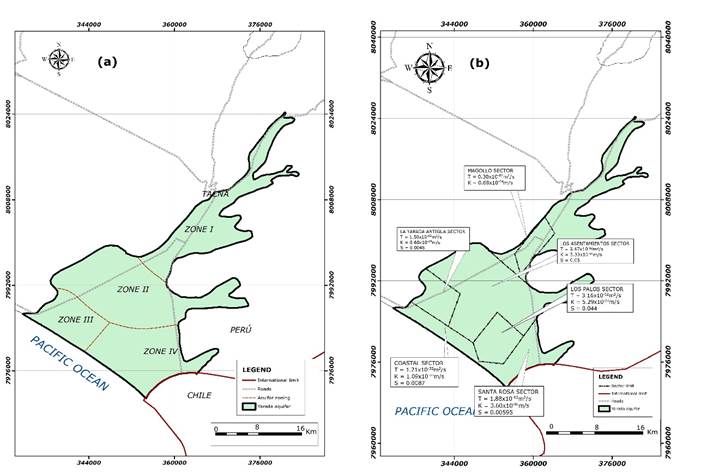
Table 1 Characteristics of the Phreatic Aquifer.
| Zone | Sector | Flow direction | Gradient Hidráulica (%) | Height Rangge (masl) |
|---|---|---|---|---|
| I | Pocollay - Tacna | NE a SO | 2.50 | 300 - 600 |
| Para-Viñani | NE a SO | 1.25 | 280 - 330 | |
| Magollo | NE a SO | 2.75 | 170 - 280 | |
| II | El Hospicio Zona Z | N a S | 1.50 0.36 | 45 - 120 |
| Yarada Alta AA.HH. Pachacútec | NE a SO | 1.40 0.50 | 45 - 145 20.00 - 45.00 | |
| Irrigación Copare Asentamiento Nº 4 - Asentamiento Nº 3 | NE a SO | 1.52 0.39 | 35 - 165 5.00 - 35.00 | |
| III | La Esperanza - Fdo. Valdivia | NE a SO | 0.47 | 6 - (-10) |
| Yarada Antigua - Fdo. Valdivia | SO a NO | -0.22 | (-10) - 0.50 | |
| Yarada Media | NE a SO | 0.26 | 8 - 0 | |
| Rancho Grande | NE a SO | 0.02 | 0 - (-0.20) | |
| IV | Los Palos - Asociación San Pedro | NE a SO | 0.24 | (-0.50) - 20 |
| Las Salinas - Balneario Santa Rosa | NE a SO | 0.20 | 20 - 0 |
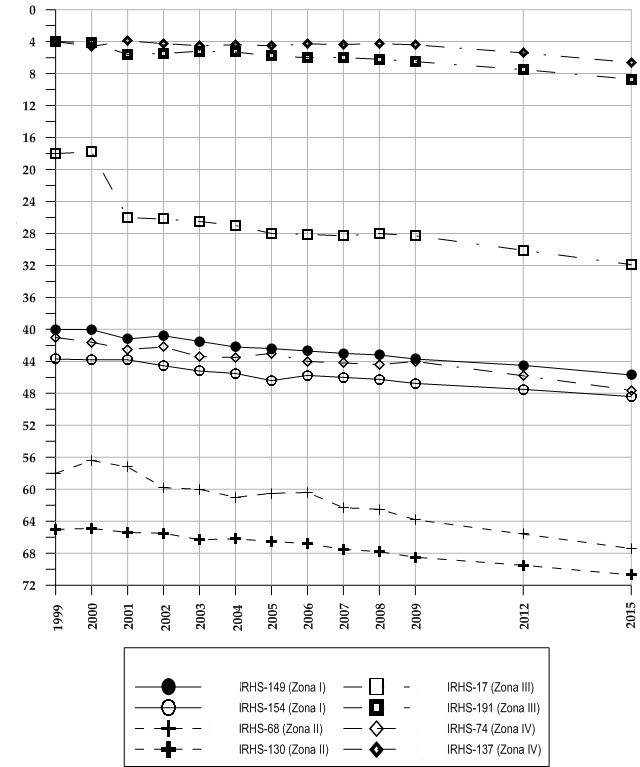
Variations in water level generally have seasonal behavior. The evaluation was made taking into account the critical periods of low water levels of the rivers and the minimum rainfalls that occurred in the upper part of Caplina basin, which are the main sources of recharge of the aquifer. In zone I, we have an average decrease of 0.40 m/year, in zone II decreases between 0.54 and 1.14 m/year, in zone III we recorded average decreases between 0.13 and 0.30 m/year and in zone IV decreases between 0.03 and 0.43 m/year. Figure 7 shows the year-on-year variations in the different zones of the aquifer between 1999 and 2015, in zone I there is an average decrease of 5.2 m, in zone II of 7.6 m, in zone III of 9.3 m and in zone IV an average decrease of 4.6 m, zones II and III, recorded the greatest decreases in the period analyzed.
Hydrochemistry
Based on hydrochemistry, we seek answers about the origin and distribution of groundwater, the physical-chemical processes that affect water and water quality: degradation and presence of pollutants. This information is essential to establish the evolution of the aquifer in time and space, to assess the vulnerability of the aquifer, to detect conditions and establish corrective measures: contamination, salinization, loss of quality and management of water resources. A comparative spatial and temporal analysis of the main parameters between 2010 and 2016 was established. In Caplina basin, where La Yarada aquifer is located, the rainwater that recharges the aquifer has little ionic content. In the surface runoff and through the unsaturated zone and the saturated zone there is a water-solid phase interaction through which the water acquires chemical substances as dissolved species (Pino et al., 2017). During the inventory of wells, in-situ water analyzes were carried out in 261 wells that were in operation in 2016, in which water data on temperature, electrical conductivity and hydrogen potential were measured, from which samples were taken in 55 of them, the ions Ca ++, Mg ++, Na +, K +, Cl-, SO4 =, HCO3- and CO3 = were analyzed in the laboratory.
Results and discussion
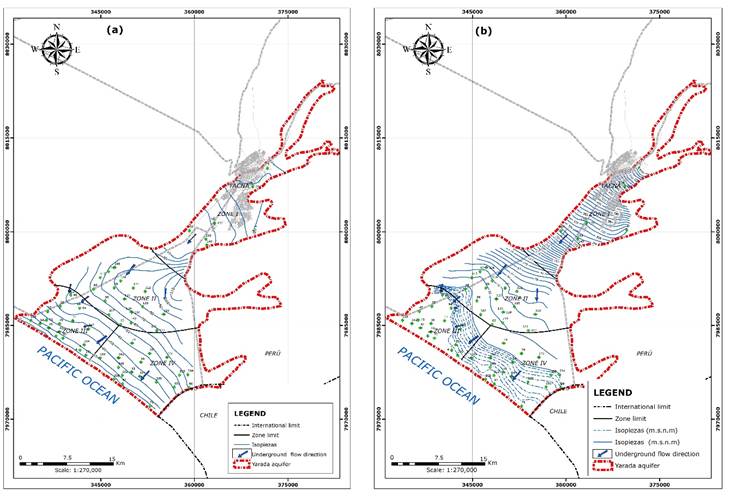
The variations of the phreatic levels generally have seasonal behavior; that is, they vary according to the time of year; rising mainly in the summer months (January - March), which is mainly due to rainfall in the upper area of the basin. While the opposite happens in the dry season, where the aquifer decreases its recharge due to the effect of scarce precipitation. Consequently, the water levels decrease. The evaluation of the aquifer was made taking into account the critical periods of low water levels in the rivers and the minimum rainfalls in the upper part of Caplina basin, which are the main sources of recharge of the aquifer. Figures 8a and 8b show the arrangement of the aquifer isohypses in two periods in the years 2010 and 2016, representing predominant flow directions and areas with levels below sea level, closely linked to processes of marine intrusion. The groundwater extraction wells in this affected area report high salinity values. Concerning the time period from 2010 to 2016, there is a significant increase in the decreases in groundwater levels.
The results of the physical-chemical analyzes of the water samples that were collected in the study area were grouped by zones (I to IV) and their analysis and interpretation is described below.
Electrical conductivity
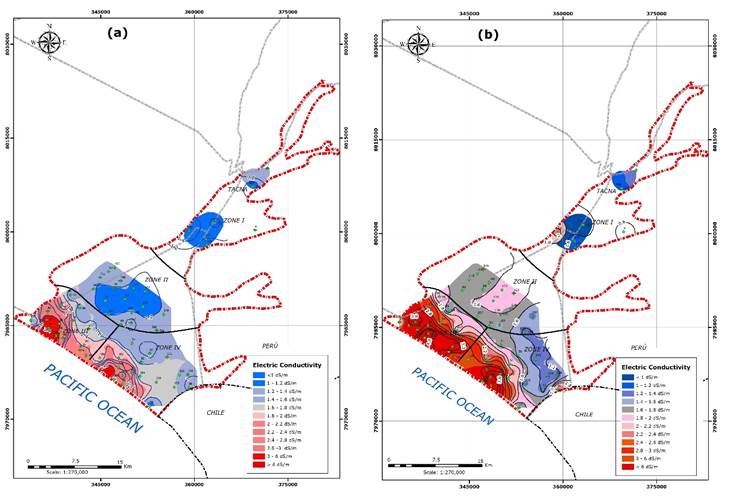
The electrical conductivity is a good measure of the risk of salinity for crops. The normal value ranges between 0.044 and 0.648 dS/cm (Eyankware, Obasi, & Akakuru, 2016). In Table 2, the obtained values are shown. In Zone I between 0.56 and 2.18 dS/cm, representing waters of medium, high and very high mineralization. In Zone II, 0.96 and 1.81 dS/cm, which are classified as high mineralization waters. In Zone III between 1.32 and 7.13 dS/cm, high water, very high mineralization (brackish water) and salty water. In Zone IV from 0.84 to 7.95 dS/cm, classified as high waters, very high mineralization (brackish waters) and salty waters (Figures 9a and 9b). The results shown in the isoconductivity maps (2010 and 2016) show an increase of this parameter in space and time.
Table 2 Electrical conductivity values.
| Zone | Sector | Electrical Conductivity | Classification |
|---|---|---|---|
| I | Hospicio -Magollo irrigation | 0.61 - 2.18 | Medium, High and Very High Mineralization |
| Viñani | 0.56 - 0.96 | ||
| Pocollay (Sobraya) - Cercado Tacna | 0.62 - 1.74 | ||
| II | Settlement Nº 3 - Copare | 1.00 - 1.42 | High Mineralization |
| Settlement Nº 5 y 6 - AA.HH. Pachacútec | 1.81 - 1.58 | ||
| Hospice Limit - Zona “Z” | 1.77 - 0.96 | ||
| III | La Esperanza - Ranch (Valdivia) | 1.53 - 2.61 | High, Very High Mineralization (brackish water) and Salt Water |
| Yarada Antigua - Las Palmeras | 3.30 - 7.13 | ||
| Los Olivos - El Progreso-La Noria | 1.32 - 1.65 | ||
| Virgen Chapi Ranch - Rancho Grande | 1.37 - 5.32 | ||
| IV | Customs Complex -Obelisco Concordia | 0.84 - 2.30 | High, Very High Mineralization (brackish water) and Salt Water |
| Curva Los palos y Salinas | 0.94 - 1.19 | ||
| Perú Posible Association y Frontera del Sur | 1.11 - 1.45 | ||
| Los Palos (Parte Baja)- San Pedro-Macheros Association | 1.37 - 7.95 | ||
| Ash y Santa Rosa Resort | 0.89 - 3.01 |
Potential of hydrogen (pH)
The pH fluctuates between 6.12 and 9.33, values representing acid to highly alkaline waters (OMS, 2006; Sunass, 1995). In zone I, the water is slightly acidic to slightly alkaline, with values of 6.56 to 7.52. In zone II, between 6.73 and 7.83, values corresponding to slightly acid to alkaline waters. In zone III, from 6.12 to 9.33, values corresponding to acid to highly alkaline waters. In zone IV, between 6.25 and 8.22, waters being identified as alkaline acids (Table 3).
Hardness
The total hardness of the waters in the study area varies from 171.5 to 3021.5 ppm (CaCO3), values that represent slightly hard to very hard waters (OMS, 2006; Sunass, 1995). In Zone I, from 171.5 to 827.5 ppm, values indicative of slightly hard to very hard water. In Zone II from 295.5 to 776.5 ppm, identified as moderately hard to very hard water. Zone III from 210 to 3021 ppm, values that indicate slightly hard to very hard waters. In zone IV, from 263 to 2419 ppm, values representing moderately hard to very hard water (Table 4).
Major cations and anions
The found values of the calcium ion (Ca ++) range between 58 mg/l (Zone I) and 927 mg/l (Zone III). For the Magnesium ion (Mg ++) values were found ranging between 5.88 mg/l (Zone IV) and 168.96 mg/l (Zone III). Sodium (Na +), between 42.09 mg/l (Zone I) and 842.95 mg/l (Zone IV). Potassium (K +) reports values ranging between 2.34 mg/l (Zone I) and 38.22 mg/I (Zone III), this value exceeds the expected values in groundwater, which indicates the presence of brines.
The found values of the Chloride ion range between 69.23 mg/l and 1846.71 mg/l (zone III) (Figures 10a and 10b). Sulfate (SO4 =) presents values that range between 119.23 mg/l and 2557.69 mg/l (between zones I and IV). The found values of the Bicarbonate ion (HCO3-), range between 56.12 mg/l and 184.83 mg/l (between zone II and I). The results of parameters analyzed for the 55 groundwater samples are shown in Table 5. The results shown in the maps of isochlorides correspond to the years 2010 and 2016, noticing an increase of this parameter in the space - time, it is possible to identify the effect of the salinization taking as a base the chlorides in the aquifer medium as the surface has increased affected within the years analyzed.
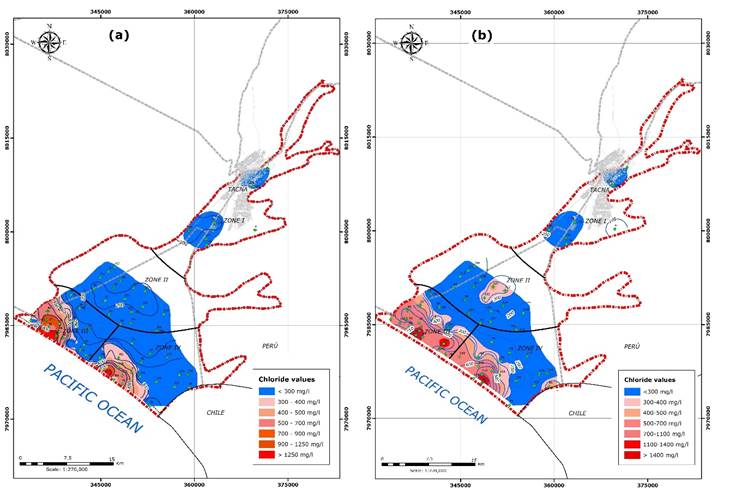
Table 5 Results of physical-chemical analysis.
| ZONE | IRHS | Cations (meq/l) | Anions (meq/l) | |||||||
|---|---|---|---|---|---|---|---|---|---|---|
| Ca++ | Mg++ | Na+ | K+ | Cl- | SO = 4 | HCO - 3 | NO - 3 | CO = 3 | ||
| I | 4 | 2.90 | 0.53 | 1.83 | 0.07 | 2.57 | 1.24 | 1.34 | 0.01 | 0.00 |
| 5 | 11.25 | 3.17 | 7.48 | 0.44 | 9.51 | 11.21 | 2.11 | 0.04 | 0.00 | |
| 85 | 12.30 | 4.25 | 5.00 | 0.48 | 5.65 | 14.45 | 1.78 | 0.07 | 0.00 | |
| 173 | 10.62 | 2.50 | 4.26 | 0.32 | 4.60 | 10.38 | 2.60 | 0.18 | 0.00 | |
| 209 | 8.74 | 1.52 | 3.87 | 0.06 | 3.66 | 6.71 | 3.03 | 0.04 | 0.00 | |
| 302 | 12.90 | 2.75 | 3.91 | 0.33 | 8.57 | 8.56 | 2.09 | 0.08 | 0.00 | |
| II | 107 | 6.35 | 2.08 | 3.39 | 0.26 | 3.90 | 9.91 | 1.21 | 0.00 | 0.00 |
| 112 | 4.85 | 1.06 | 6.48 | 0.31 | 4.48 | 8.81 | 0.92 | 0.00 | 0.00 | |
| 115 | 9.80 | 2.75 | 3.87 | 0.32 | 5.84 | 10.02 | 1.69 | 0.00 | 0.00 | |
| 130 | 8.95 | 2.25 | 3.61 | 0.32 | 5.65 | 9.75 | 1.59 | 0.01 | 0.00 | |
| 146 | 12.20 | 3.33 | 3.61 | 0.42 | 10.33 | 7.26 | 1.54 | 0.00 | 0.00 | |
| 188 | 6.79 | 1.38 | 2.87 | 0.10 | 3.78 | 6.73 | 1.74 | 0.02 | 0.00 | |
| 270 | 5.53 | 1.00 | 2.35 | 0.19 | 3.55 | 3.14 | 1.86 | 0.01 | 0.00 | |
| 307 | 9.32 | 2.50 | 3.61 | 0.38 | 3.90 | 10.20 | 1.44 | 0.02 | 0.00 | |
| 316 | 6.44 | 1.43 | 2.39 | 0.17 | 4.05 | 3.40 | 1.71 | 0.02 | 0.19 | |
| 321 | 9.64 | 1.76 | 3.35 | 0.17 | 6.00 | 5.37 | 1.59 | 0.05 | 0.00 | |
| 322 | 6.24 | 1.38 | 2.43 | 0.19 | 3.74 | 3.82 | 1.69 | 0.05 | 0.00 | |
| 331 | 11.00 | 2.58 | 3.96 | 0.34 | 4.91 | 10.42 | 1.98 | 0.04 | 0.00 | |
| 332 | 9.80 | 3.08 | 4.17 | 0.43 | 5.22 | 10.02 | 1.74 | 0.03 | 0.00 | |
| III | 7 | 9.65 | 2.75 | 3.74 | 0.31 | 6.82 | 8.53 | 1.21 | 0.00 | 0.00 |
| 16 | 7.65 | 2.17 | 3.30 | 0.29 | 5.07 | 8.09 | 1.38 | 0.00 | 0.00 | |
| 25 | 9.50 | 2.33 | 8.74 | 0.46 | 13.05 | 6.99 | 1.67 | 0.01 | 0.00 | |
| 36 | 18.70 | 6.75 | 11.43 | 0.65 | 27.08 | 12.45 | 1.46 | 0.00 | 0.00 | |
| 45 | 19.05 | 3.50 | 9.78 | 0.56 | 24.35 | 8.59 | 1.42 | 0.03 | 0.00 | |
| 94 | 5.45 | 2.33 | 4.13 | 0.33 | 3.51 | 4.38 | 1.44 | 0.01 | 0.00 | |
| 96 | 3.65 | 0.55 | 7.04 | 0.31 | 9.59 | 3.84 | 1.48 | 0.00 | 0.00 | |
| 142 | 23.30 | 4.42 | 2.26 | 0.64 | 18.70 | 14.81 | 1.44 | 0.02 | 0.13 | |
| 191 | 6.20 | 4.92 | 10.65 | 0.51 | 10.13 | 13.17 | 1.80 | 0.01 | 0.13 | |
| 214 | 46.35 | 14.08 | 13.17 | 0.98 | 52.02 | 19.95 | 2.28 | 0.00 | 0.00 | |
| 217 | 5.90 | 2.00 | 4.04 | 0.33 | 1.95 | 8.84 | 1.57 | 0.00 | 0.00 | |
| 304 | 20.45 | 7.17 | 13.43 | 0.72 | 30.39 | 13.75 | 1.34 | 0.01 | 0.00 | |
| IV | 50 | 12.90 | 3.42 | 6.26 | 0.38 | 14.03 | 10.30 | 1.98 | 0.00 | 0.00 |
| 51 | 17.00 | 5.42 | 10.70 | 0.48 | 23.38 | 12.96 | 1.86 | 0.02 | 0.00 | |
| 57 | 6.75 | 0.67 | 5.09 | 0.07 | 5.84 | 6.34 | 2.38 | 0.11 | 0.00 | |
| 59 | 5.55 | 1.67 | 4.30 | 0.25 | 4.01 | 4.79 | 1.84 | 0.01 | 0.13 | |
| 79 | 6.53 | 1.47 | 3.04 | 0.23 | 3.97 | 4.11 | 1.84 | 0.00 | 0.10 | |
| 99 | 12.75 | 1.75 | 7.04 | 0.20 | 16.21 | 5.69 | 1.21 | 0.02 | 0.19 | |
| 152 | 6.12 | 1.38 | 2.74 | 0.12 | 5.26 | 4.59 | 1.48 | 0.08 | 0.08 | |
| 162 | 7.10 | 3.67 | 6.87 | 0.35 | 6.62 | 9.05 | 1.40 | 0.10 | 0.10 | |
| 169 | 10.55 | 4.25 | 8.96 | 0.48 | 12.86 | 10.37 | 1.38 | 0.01 | 0.13 | |
| 184 | 7.60 | 2.33 | 4.52 | 0.27 | 5.65 | 6.88 | 1.63 | 0.01 | 0.06 | |
| 192 | 36.30 | 12.08 | 36.65 | 0.97 | 51.63 | 26.60 | 1.69 | 0.04 | 0.10 | |
| 249 | 16.80 | 5.33 | 10.83 | 0.56 | 18.90 | 15.60 | 2.15 | 0.02 | 0.06 | |
| 257 | 6.50 | 1.71 | 2.61 | 0.29 | 4.60 | 4.81 | 1.29 | 0.04 | 0.00 | |
| 266 | 9.19 | 1.83 | 3.00 | 0.37 | 4.36 | 6.02 | 1.50 | 0.09 | 0.10 | |
| 272 | 7.10 | 1.00 | 2.83 | 0.19 | 2.81 | 6.27 | 1.61 | 0.00 | 0.00 | |
| 277 | 5.69 | 1.28 | 2.43 | 0.14 | 3.31 | 4.27 | 1.40 | 0.01 | 0.00 | |
| 308 | 9.60 | 3.00 | 5.91 | 0.41 | 8.77 | 9.89 | 1.42 | 0.00 | 0.00 | |
| 314 | 5.94 | 1.18 | 2.70 | 0.09 | 3.35 | 5.08 | 1.60 | 0.01 | 0.00 | |
| 315 | 5.41 | 0.94 | 2.83 | 0.11 | 4.33 | 3.34 | 1.66 | 0.02 | 0.00 | |
| 333 | 4.78 | 0.49 | 3.87 | 0.13 | 6.00 | 2.27 | 1.36 | 0.02 | 0.00 | |
| 334 | 5.60 | 0.50 | 4.13 | 0.12 | 6.47 | 2.32 | 1.39 | 0.02 | 0.00 | |
| 335 | 5.39 | 1.05 | 2.61 | 0.14 | 4.17 | 3.39 | 1.79 | 0.03 | 0.00 | |
| 336 | 6.27 | 1.16 | 2.52 | 0.17 | 4.01 | 5.19 | 1.64 | 0.02 | 0.00 | |
| 338 | 5.70 | 1.41 | 2.91 | 0.23 | 3.51 | 5.46 | 1.54 | 0.01 | 0.00 | |
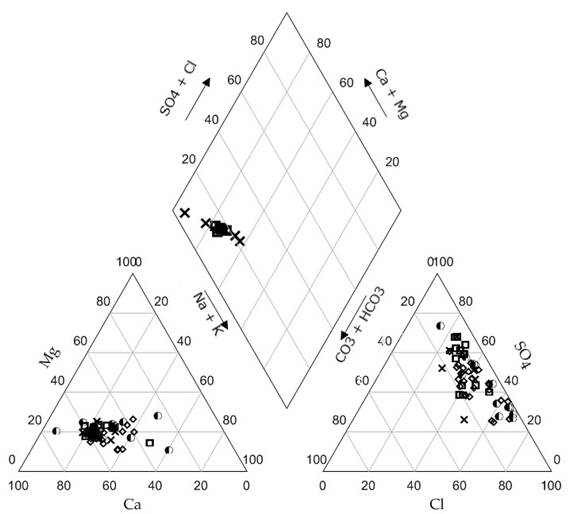
In zone I, according to laboratory results and triangular diagrams, it is shown that the waters are Sulfated and/ or calcium and/ or magnesium chlorides. In zone II, in general the samples are grouped in the region of the sulfated waters and/ or calcium and/ or magnesium chlorides, corresponding to mixing waters. In zone III, water samples are mostly grouped in the region of sulfated waters and/ or calcium and/ or magnesium chloride, and samples from wells IRHS-96 and 191 are located in the rhombus of the Chloride type and/ or sulfated sodium (facies Na-Ca-Cl-SO4 and Na-Ca-Mg-SO4-Cl respectively); reflecting the mixing zone of saline and fresh water in the interphase zone of the marine intrusion, phenomenon that is occurring in this aquifer. In zone IV, the IRHS-192 well sample shows the Na-Ca-Cl-SO4 facies, indicating water of the Chloride sodium type (saline water), in general in this zone the water samples correspond to chlorinated waters and/ or calcium and/ or magnesium sulfates (transient salt water) (Figure 11).
Quality of groundwater and hydrogeochemical families
The predominant facies in the study area are Calcium Sulfate and Calcium Chlorides, followed in a lesser proportion by the sodium chlorides and sodium sulfates (Table 6). The importance of water, sanitation, hygiene for health and development have been reflected in the final papers of various international forums (OMS, 2006). Recently, the United Nations General Assembly declared the period from 2005 to 2015 as International Decade for Action “Water for life".
Table 6 Predominant hydrogeochemical facies.
| Classification | Sample | % |
|---|---|---|
| Calcium chloride | 22 | 40.00 |
| Calcium sulfate | 30 | 54.54 |
| Chloride sodium | 02 | 3.64 |
| Sulfated sodium | 01 | 1.82 |
| Total | 55 | 100 |
The water quality standard in relation to Boron is 0.5 mg/ l (OMS, 2006). In this campaign, the minimum value presented was 0.01 and the maximum 3.72 mg/l, therefore, there are certain sectors that show absence of this element, as is the case of Viñani, Curva Los Palos, Pampas Santa Rosa and others that exceed the quality standards. Thus, 18 samples (32.72%) of the 55 groundwater samples corresponding to the campaign carried out, are above the maximum allowable for drinking water established by the current regulations, located mainly in zone I (Magollo sector), zone II (Cooperativa sector 60), zone III (La Esperanza, Los Olivos and Las Palmeras sectors) and in zone IV (Los Palos and Los Macheros sectors).
With reference to the chloride ion, it has been found that 18 samples (32.72%) are above the maximum permissible for drinking water established by Peruvian regulations. Located mainly in zone I (Magollo sector), zone II (Cooperativa 60 sector), zone III (La Esperanza, Los Olivos and Las Palmeras sectors) and in zone IV (Los Palos and Los Macheros sectors). In relation to the Sulfate ion (SO4 =) we can indicate that its content in the groundwater analyzed, most of the zones exceed the maximum tolerable limits of potability, occurring mostly in the sectors of August 28 and Settlement 5 and 6 of zone IV, La Esperanza, Los Olivos and Las Palmeras sectors, zone III and Los Palos sector in zone II. So we have 47 water samples (59%), exceeding the current Peruvian regulations (250 mg/ l) (Sunass, 1995).
In the case of Sodium, six samples (8%) exceed the maximum acceptable limit established by the WHO and are located in the Las Palmeras, La Esperanza, and Los Palos sectors. With regard to pH, the water samples analyzed vary from 6.12 to 8.21, and in the latter season acid waters are found in Los Olivos, Rancho Grande and Los Macheros sectors, which are not within the range established by the WHO (6.5 to 8.5) (Table 7).
Table 7 Variation of physicochemical parameter values.
| Parameter | Zone I | Zone II | Zone III | Zone IV |
|---|---|---|---|---|
| Boron (mg/L) | 0.39 - 1.12 | 0.03 - 3.72 | 0.13 - 1.55 | 0.01 - 3.17 |
| Chloride(mg/L) | 91.24 - 337.61 | 126.03 - 366.72 | 69.23 - 1846.71 | 99.76 - 1832.87 |
| Sulfate (mg/L) | 119.23 - 1389.42 | 301.92 - 1001.92 | 369.23 - 1918.27 | 218.27 - 2557.69 |
| Total disolved solids (mg/L) | 280 - 1180 | 490 - 965 | 565 - 3565 | 450 - 3975 |
| Sodium (mg/L) | 42.09 - 172.04 | 54.05 - 149.04 | 51.98 - 308.89 | 55.89 - 842.95 |
| pH | 6.56 - 8.21 | 6.93 - 8.14 | 6.12 - 7.72 | 6.25 - 8.15 |
Marine intrusion
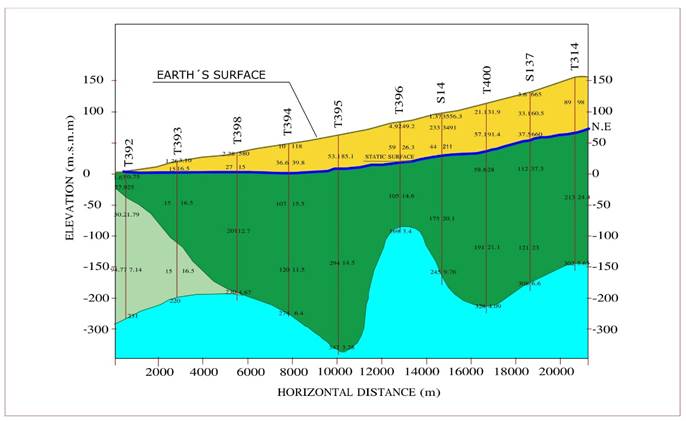
Geoelectric sections were built, of which one of the main ones corresponds to the H-H' section (Figures 5a and 12), has a length of 19.30 km, from the coastline and passes through Los Palos and zone Z sectors, until the limit with the district Coronel Gregorio Albarracín Lanchipa. It presents four main geoelectric horizons: The first horizon, consisting of one or more geoelectric layers that make up the unsaturated aquifer. Together they have thicknesses ranging from 0.0 m on the coastline line to 101 m. The second horizon is the saturated aquifer and is made up of two geoelectric layers. As a whole, its thickness decreases from 359 m on the coast to 161 m. From this point the thicknesses increase until reaching 279 m and from here, again the thickness decreases until reaching 87 m. The upper layer, where the average resistivities predominate, from 11 to 20 ohm-m and thicknesses that vary from 88 m to 279 m, where it covers the entire thickness of the saturated aquifer. The lower layer with low and very low resistivities, between 5.2 and 6.6 ohm-m, expresses that the aquifer is highly mineralized in the littoral. The clay content is also responsible for the low resistivities of this layer. The thicknesses of the lower layer decrease from 269 m on the coast, until disappearing with continental direction. The third horizon, present in the initial and final part of the section, with resistivities of 2.4 to 9.5 ohm-m, indicative of a high clay content that makes it impermeable. The fourth horizon, constituted by the impermeable rocky basement.
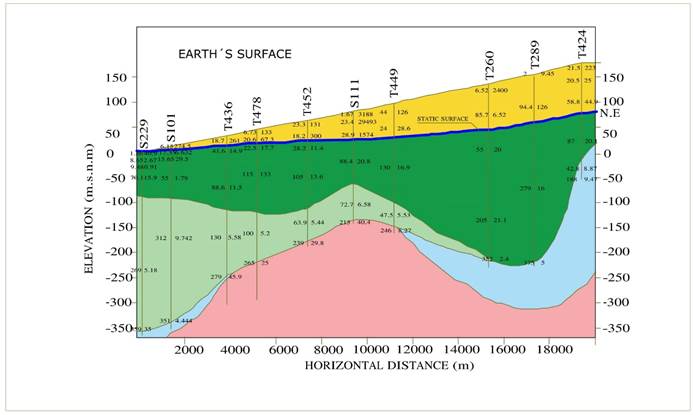
On the other hand, it has a G-G' section of 19.25 km and includes Las Palmeras, San Antonio, El Progreso and Settlement No. 03 sectors. It presents three geoelectric horizons (Figures 5a and 13). The first is made up of two or more layers and is in a dry state. Their thicknesses vary from 0 m in the littoral up to 89 m, with resistivities that reach 660 ohm-m and even 3500 ohm-m. The second horizon represents the saturated aquifer, currently in exploitation, it is constituted by several layers with thicknesses that reach up to 294 m; presents resistivities that mostly vary from 11.5 to 37.3 ohm-m. A special feature of this horizon are the low resistivities (near the Littoral Zone) that fluctuate between 0.75 and 7.14 ohm-m, which indicates mineralized waters, product of marine intrusion (Las Palmeras sector). The third horizon that underlies the saturated aquifer presents very low resistivities that vary from 3.28 to 8.1 ohm-m. Represents the clayey waterproof basement. This section confirms the non-existence of a permeable horizon that underlies the saturated aquifer; consequently, the possibility of locating a deep aquifer is ruled out.
The salinization of coastal aquifers is the result of poor or uncontrolled management, which generates an overexploitation that can be prevented (Cabrera & Custodio, 2004). One measure of mitigation is the negative hydraulic barriers, which pump near the shore intercepting the salt water; in aquifers under marine intrusion processes, they have been proposed as a corrective measure for the intrusion of seawater, in cases in which low hydraulic loads must be maintained (Pool & Carrera, 2010). The main disadvantage of these barriers is that they pump a significant proportion of fresh water, which is mixed with salt water in the well.
Having identified that La Yarada aquifer is undergoing marine intrusion, Pino (2014) proposes to set out a double negative hydraulic barrier pilot project, with 10 double-row wells aligned in the normal direction to the predominant flow direction. Being a measure of remediation of the intrusive process of seawater. We consider it of immediate applicability, which may bring with it rapid results, also will allow us to study its operation in greater detail and make decisions about its incorporation on a larger scale. It was considered that the location zone of the pilot barrier should be the right bank downstream of the aquifer, that is to say the zone adjacent to the named Cerro Moreno, assuming that said hill would function as an impermeable barrier and it would prevent unwanted flows in the outline of the battery.
Conclusions
La Yarada aquifer is currently overexploited (exploitation volume not controlled by unauthorized wells) in relation to its renewable reserve (PET, 2013). The exploitation exceeds the recharge, this is manifested by the constant decrease in the level of the aquifer and the ongoing progress of marine intrusion, which currently reaches 60 km2 and the degradation of water quality in an area of 127 km2 comprising Los Palos, El Chasqui and Los Olivos sectors, including La Esperanza, Las Palmeras and Rancho Grande.
The renewable reserve is of the order of 54 Hm3/ year, the exploitation 111 Hm3/ year, therefore, the over exploitation reaches 57 Hm3/ year. Due to this situation and the scarce recharge of the aquifer, water coming from the permanent or non-renewable reserve has been extracted. If the measures of the case are not taken in a timely manner, the situation may reach higher risk levels and the deterioration of the water quality may increase due to the progressive advance of the marine intrusion.
There is a coincidence between the direction of the underground flow and the increase in chloride content, although some deviations are locally observed. The distribution of the isolines can be considered homogeneous from 200 to 250 mg/ l, starting from 300 mg/ l it begins to generate the existence of two large nuclei (La Esperanza-Las Palmeras and Los Palos sectors) with abnormally high content of chlorides, as well as the generalized increase in the concentration of said parameter as we approach the coast. The sudden increase that occurs in the Lower Terrace, is not a product of the increase of chlorides in the direction of flow, but of pollution with seawater. This increase in chloride concentrations is attributable to several processes that can be spatially or non-coincidentally.
According to the geoelectric sections, there is a lower layer with low and very low resistivities, between 5.2 and 6.6 Ohm-m, which expresses that the aquifer is highly mineralized in the littoral, that is, near the Pacific Ocean, a situation that denotes marine intrusion processes.
In the future, measures must be sought in the short, medium and long term that include the progressive reduction of the exploitation of groundwater or the artificial incorporation of water into the system, in different stages, allowing sequentially, to decrease the rate of descent of the phreatic level, stabilize it and finally achieve its recovery.
Acknowledgements
My special gratitude to the professionals and relevant authorities of the National Water Authority, Lima, Peru, for providing the base information required in this work.
REFERENCES
Acosta , H., Benavente, C., Cotrina, G., Peña, F., & Alván, A. (2008). Estudio geológico del valle del río Caplina Tacna-Perú, base para el estudio hidrogeológico de compatibilizacion del reservorio acuífero de la Yarada, Tacna, Perú , Convenio PET-INGEMMET (INGEMMET, 82). Lima. Perú. [ Links ]
Acosta, H., Mamani, M., Alván, A., & Rodrígues, J. (2012). Geología de los cuadrángulos de la Yarada, Tacna y Huaylillas Hoja 37-u, 37-v y 37-x. Carta Geológica Nacional. Boletín 145, Serie A, 87. Recuperado de http://repositorio.ingemmet.gob.pe/handle/ingemmet/107 [ Links ]
ANA, Autoridad Nacional del Agua. (2009). Caracterización hidrogeológica del acuífero del valle del Caplina-La Yarada. Lima, Perú: Autoridad Nacional del Agua, Dirección de Gestión de Calidad de los Recursos Hídricos. [ Links ]
ANA, Autoridad Nacional del Agua. (2010). Caracterización hidrogeoquímica del acuífero Caplina. Lima, Perú: Autoridad Nacional del Agua, Dirección de Gestión de Calidad de los Recursos Hídricos . [ Links ]
ANA, Autoridad Nacional del Agua. (2011). Informe técnico 03. Calidad de agua cuenca Caplina Tacna. Lima, Perú: Autoridad Nacional del Agua, Dirección de Gestión de Calidad de los Recursos Hídricos . [ Links ]
Cabrera, M., & Custodio, E. (2004). Groundwater flow in a volcanic-sedimentary coastal aquifer: Telde area, Gran Canaria, Canary Islands, Spain. Hydrogeology Journal, 12(3), 305-320. DOI: 10.1007/s10040-003-0316-y [ Links ]
El Alfy, M., Aref, L., Fathy, A., & Abdulaziz, A.-B. (2017). Assessing the hydrogeochemical processes affecting groundwater pollution in arid areas using an integration of geochemical equilibrium and multivariate statistical techniques. Environmental Pollution, 229(2017), 760-770. DOI: 10.1016/j.envpol.2017.05.052 [ Links ]
Eyankware, M., Obasi, P., & Akakuru, O. (2016). Use of hydrochemical approach in evaluation of water quality around the vicinity of Mkpuma Ekwaoku Mining District, Ebonyi State, SE. Nigeria for Irrigation Purpose. Indian Journal of Science, 23(88), 881-895. [ Links ]
Flores, A., & Sempere, T. (setiembre, 2002). Avances sobre la historia geológica del valle de Tacna. Congreso Peruano de Geología . Trabajos Científicos-Sociedad Geológica del Perú. Lima, Perú. [ Links ]
Flores, A., Sempere, T., & Fornari, M. (octubre, 2004). Síntesis actualizada de la estratigrafía del Cenozoico en el extremo sur del Perú. Congreso Peruano de Geología. Resúmenes extendidos-Sociedad Geológica del Perú (pp. 444-447). Lima, Perú. [ Links ]
Jaén, H., Ortiz, G., & Wilson, J. J. (1963). Geología de los cuadrángulos de la Yarada, Tacna y Huaylillas. Comisión Carta Geológica Naciona l. Boletín 6, 70. Recuperado de http://repositorio.ingemmet.gob.pe/bitstream/ingemmet/561/1/A006-Boletin_Huaylillas-37x.pdf [ Links ]
Jenks, W. F. (1948). Geología de la hoja de Arequipa al 200,000 Geology of the Arequipa Quadrangle of the Carta Nacional del Perú. Instituto Geológico del Perú. Boletín 9, 204. Recuperado de http://repositorio.ingemmet.gob.pe/handle/ingemmet/2198. [ Links ]
Martines, C., Vargas, R., Montoya, J., Chamorro, C., & Zenteno, E. (1996). Estudio hidrogeológico de las pampas de la Yarada y Hospicio, Tacna. Lima, Perú: Ministerio de Agricultura, Instituto Nacional de Recursos Naturales. [ Links ]
OMS, Organización Mundial de la Salud. (2006). Guías para la calidad del agua potable. Recuperado de https://es.scribd.com/document/263887495/Guias-Para-La-Calidad-Del-Agua-Potable-OMS [ Links ]
PET, Proyecto Especial Tacna. (2013). Diagnóstico situacional del acuífero Caplina en el ámbito del sector La Yarada. Tacna, Perú: Proyecto Especial Tacna. [ Links ]
Pino, E. (2014). Diagnóstico para la ubicación preliminar de una barrera hidráulica piloto en el acuífero de La Yarada con fines de contener la intrusión marina. Lima, Perú: Autoridad Nacional del Agua. [ Links ]
Pino, E., Tacora, P., Steenken, A., Valle, A., Chávarri, E., Ascencios, D., & Mejía, J. (2017). Efecto de las características ambientales y geológicas sobre la calidad del agua en la cuenca del río Caplina, Tacna, Perú. Tecnología y ciencias del agua, 8(6), 77-99. DOI: 10.24850/j-tyca-2017-06-06 [ Links ]
Pino, E., Chávarri, E., & Ramos, L. (2018). Crisis de gobernanza y gobernabilidad y sus implicancias en el uso inadecuado del agua subterránea, caso acuífero costero de La Yarada, Tacna, Perú. Idesia (Arica), 36(3), 77-85. DOI: https://dx.doi.org/10.4067/S0718-34292018005001301 [ Links ]
Pool, M., & Carrera, J. (2010). Dynamics of negative hydraulic barriers to prevent seawater intrusion. Hydrogeology Journal, 18(1), 95-105. DOI: 10.1007/s10040-009-0516-1 [ Links ]
Sunass, Superintendencia Nacional de Servicios de Saneamiento de Perú. (1995). Reglamento de calidad de agua para consumo humano, Perú. Lima, Perú: Superintendencia Nacional de Servicios de Saneamiento de Perú. [ Links ]
Todd, F. (2015). New NASA data show how the world is running out of water. The Washington Post. Recuperado de https://www.independent.co.uk/environment/nasa-data-shows-the-world-is-running-out-of-water-10325188.html [ Links ]
Valhondo, C., Martínez-Land, L., Carrera, J., Hidalgo, J. J., Tubau, I., De Pourcq, K., Grau-Martínez, A, & Ayora, C. (2016). Tracer test modeling for characterizing heterogeneity and local-scale residence time distribution in an artificial recharge site. Hydrology and Earth System Sciences, 20, 4209-4221. DOI: 10.5194/hess-20-4209-2016 [ Links ]
Vergara, W., Ríos, A., Trapido, P., & Malarín, H. (2014). Agricultura y clima futuro en América Latina y el Caribe: Informe del Banco Interamericano de Desarrollo. Washington, DC, USA: Banco Interamericano de Desarrollo. Recuperado de https://publications.iadb.org/publications/spanish/document/Agricultura-y-clima-futuro-en-Am%C3%A9rica-Latina-y-el-Caribe-impactos-sist%C3%A9micos-y-posibles-respuestas.pdf [ Links ]
Received: July 07, 2017; Accepted: March 20, 2019
 Este es un artículo publicado en acceso abierto bajo una licencia Creative Commons
