


Servicios Personalizados
Revista
Articulo
 texto en
  Inglés (pdf)
 Artículo en XML
 Referencias del artículo
 Enviar artículo por email
Indicadores
-
 Citado por SciELO
 -
 Accesos
Links relacionados
-
 Similares en
SciELO
Similares en
SciELO
Compartir

 Permalink
Tecnología y ciencias del agua
versión On-line ISSN 2007-2422
Tecnol. cienc. agua vol.10 no.5 Jiutepec sep./oct. 2019 Epub 15-Feb-2020
https://doi.org/10.24850/j-tyca-2019-05-04
Articles
Evaluation of effect of inclined face bridge pier on the local scour
1Universidad Privada de Piura, Instituto de Ingeniería Hidráulica, Hidráulica y Sanitaria, Piura, Perú, paul.jaramillo.mejia@gmail.com
2Universidad Privada de Piura, Instituto de Ingeniería Hidráulica, Hidráulica y Sanitaria, Piura, Perú, jorge.reyes@udep.pe
Understanding the channel depth around bridge piers, whose side face is inclined as a consequence of local scour, requires the analysis of the interaction between flow and structure through the physical and numerical simulation and field measurements. Over the years, tests have been performed through physical simulation and field measurements; however, this paper contributes through the numerical simulation to the study of the effect produced by the inclination of the pier face on the phenomenon of local scour. The three-dimensional software ANSYS CFX was used which has the capacity to simulate the flow dynamics through the bridge pier. Thus, water flow patterns such as direction and velocity have been analyzed to find the relationship that they have with the local scour. The study was made with two shapes of piers; the first one reduces the transversal section from the top to the smaller bottom base, and the second shape reduces the transversal section from the bottom to the smaller top base. The results show that the first type of shape was favorable to generate greater scour depth, finding velocities greater than 50% in the pier face.
Keywords: Bridge pier; local scour; computational fluid dynamics
Comprender la profundización del cauce alrededor de pilares con el paramento inclinado, como consecuencia del fenómeno de socavación local, requiere del análisis de la interacción entre el flujo y la estructura mediante modelos físicos, numéricos y mediciones en campo. A lo largo de los años se ha experimentado mediante la simulación física y mediciones en campo, sin embargo, este trabajo de investigación contribuye, a través de la modelación numérica, al estudio del efecto en la socavación local del cauce que produce la inclinación del paramento del pilar. Se utilizó el software tridimensional ANSYS CFX, el cual tiene la capacidad de simular la dinámica del flujo a través del pilar, llegando a poder visualizar velocidades y dirección de líneas de corriente. Por otro lado, se analizó la relación indirecta que estos parámetros del flujo tienen en la socavación local. El estudio se les realizó a dos formas de pilares: el primero reduce la sección transversal desde la superficie hasta la base, y la segunda forma reduce la sección transversal desde la base hasta la superficie. Los resultados mostraron que el primer tipo de pilar es más favorable para generar socavación local, encontrándose velocidades en la cara del pilar mayores a 50%.
Palabras clave: pilar; socavación local; dinámica computacional de los fluidos
Introduction
During the last years, several researchers have studied the local scour of the channel around bridge piers with the inclined face. The research of the inclination in the lateral face of the pier, allows the local scour calculations to be more accurate and to increase the structural security of the bridge. Breausers and Raudkivi (1991), Yanmaz (2002), and Jaafar (2005) studied the piers by means of physical models whose cross section is reduced in the upper part and the lower part, respectively; showing that with the second type of pillar greater depth of the channel was generated. Jaafar (2005) says that the difference in the erosive effect can be understood by the vertical and horizontal components of the resultant of the downward flow that collides with the face of the piers in the upstream direction, as shown in Figure 1. On the one hand, in the pier with reduction in the upper part, the horizontal component of the downward flow is in the opposite direction to the horseshoe vortex, therefore, interference occurs and causes a lower capacity that these vortices can transport the sediment downstream, while the vertical component of the downward flow weakens towards the bottom of the channel because its action impinges on the inclined face of the pier. However, in the pier with reduction in the lower part, the vertical component of downward flow impacts the bottom directly and more sediment is collected, but its resistance decreases towards the base due to the reduction of the pier section.

Figure 1 Flow components in the upstream direction of the bridge pier with reduction in the upper part (left) and with reduction in the lower part (right).
In addition to the studies using physical model and field measurements of the piers with the inclined face, this article contributes to such knowledge through numerical modeling, which provides a three-dimensional visualization of the interaction between the pier, the water and the channel, enabling the analysis in more detail of current lines and velocities, which in comparison with analytical and experimental fluid dynamics could not be performed.
The ANSYS CFX three-dimensional software was used, which has shown the flow conditions that favor a greater degradation of the channel around the pier that reduces its cross section from the surface to the base.
Materials and methods
Based on the shape of pier with conical profile to evaluate the effect of the slope in the flow direction, two forms of rectangular section pillars are used, the first reduces its section from the surface to its base, and the second reduces its section from the base towards the surface.
The experimental program was carried out using the three-dimensional software ANSYS CFX, which represented three-dimensionally the dynamics of the flow around the piers, being able to observe the lines of currents and velocities. On the other hand, it is important to point out that ANSYS CFX cannot represent the channel change through the simulation time, which would have allowed us to observe the local erosion around the piers. However, the erosive effect could be evidenced through the study of flow parameters. To do this, the piers were analyzed in two types of channel scenarios; the first, with the bottom of the channel without eroding around the piers and called flat bottom, and the second, with a deepening of the channel around the piers and called eroded bottom. In this way, we represented the process of local erosion in two periods.
The initial parameters of the numerical model were taken from the study in physical model of the piers of Cáceres Bridge in the Piura River, which were subjected to extraordinary flows of El Niño of the year 1998; this study was carried out by the University of Piura (2001).
General transport formulas
The ANSYS CFX software is based on the CFD (Computational Fluid Dynamics) methodology, with which it obtains the solution of the Fluid Mechanics problems, solving numerically the Navier-Stokes equations and Reynolds averaging, indicated as follows:
• Mass conservation:
• Momentum conservation:
• Energy conservation:
Where:
Where p is the pressure;
To solve the closure problem (system with more questions than equations), algorithms have been developed which take into account turbulence models of different degrees of complexity, ranging from vorticity algebraic models to viscosity
Numerical model
The geometric characteristics of the piers were taken from the Cáceres bridge (Figure 2). It is evident that the shape of the pier presents reduction of its section in the lower part; however, for research purposes a similar pier was made but with reduction in the upper part.

In Figure 3 we observe both pier models, which present the rectangular cross section and the conical profile.
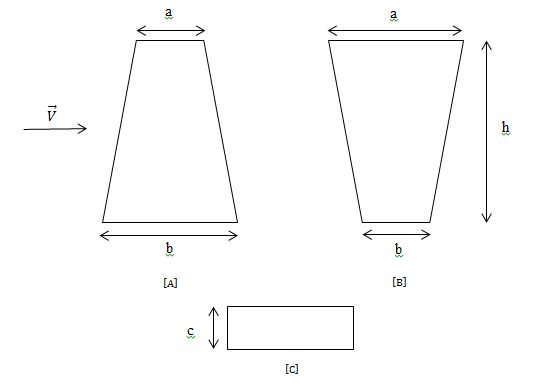
Figure 3 Pier models. [A] Pier with the face inclined downstream, [B] Pier with the face inclined upstream, [C] Cross section.
We have already mentioned that ANSYS CFX cannot represent channel erosion over time, therefore, the piers were emplaced within two scenarios; the first with the channel bottom without eroding or flat bottom (Figure 4), representing an initial condition of the flow when it has not eroded the channel, and on the other hand, with an eroded pit or bottom (Figure 5), representing a final condition of the flow when it has already eroded the channel.

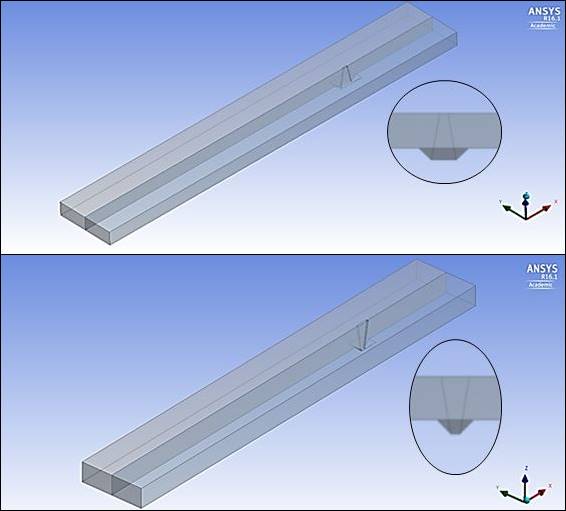
Table 1 shows the geometric parameters of the piers in both scenarios.
Table 1 Geometrical parameters of the piers.
| Test | Type of Scenario | Pier Model | Geometrical parameters | |||
|---|---|---|---|---|---|---|
| Length | Width | Height | ||||
| a(m) | b(m) | c(m) | h(m) | |||
| 1 | Flat Bottom | A | 3 | 6 | 1 | 9 |
| 2 | B | 6 | 3 | 1 | 9 | |
| 3 | Eroded Bottom | A | 2 | 6 | 1 | 12 |
| 4 | B | 6 | 2 | 1 | 12 | |
The initial flow conditions were taken from the physical model study of the Cáceres Bridge (University of Piura, 2001), which was subjected to extraordinary flows of 3900
In addition, complementary numerical models that represented the problem studied were used, such as the k-ε turbulence model, the multiphase model and the buoyancy model.
Results and discussion
It is the first time that the numerical modeling applied to the study of piers with the inclined face is done, therefore it is expected that the results will be of valuable utility as a reference for later analyzes.
Flow lines
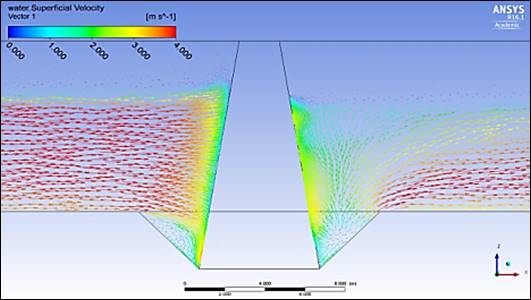
The flow lines were analyzed in a cross section parallel to the flow direction and in the center of the piers. The results are shown in the flat bottom (Figure 6 and 7) and eroded bottom scenarios (Figure 8 and 9).
In all cases, it is observed that the flow lines are disordered downstream after the impact with the piers, until be directed again in the same direction. Also, note that for the eroded bottom scenario, the order originates after leaving the pit. On the other hand, note that when impacting on the face of the pier with reduction in the lower part the flow lines are directed with greater freedom towards the channel; this shows that the shape of the lateral face enables the flow to direct towards the channel with greater flow and velocity. By contrast, the shape of the pier lateral face with enlargement in the lower part does not allow the flow to go towards the bottom but towards the surface instead.
It was necessary to calculate in the upstream direction of the piers the % within the average width of the pit (Figure 8 and 9) of the lines that have velocities lower than 1 m/s since it is considered that those do not generate a considerable effect on the channel . In the pier with reduction in the lower part is 20%, therefore, the other 80% could continue generating an erosive effect; and in the pier with expansion in the lower part is 40%, therefore, 60% could continue generating an erosive effect.
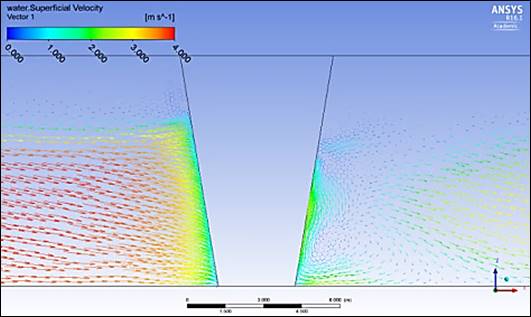
Figure 6 Flow lines through the pier with reduction in the lower part in the scenario with no eroded bottom.

Figure 7 Flow lines through the pier with reduction in the upper part in the scenario with no eroded bottom.
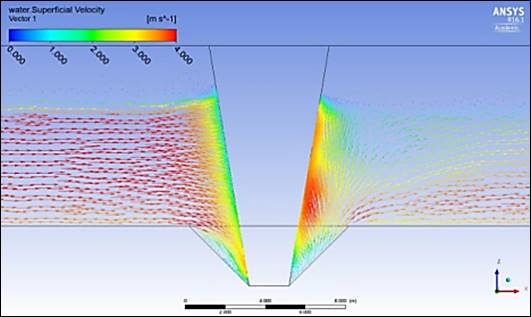
Figure 8 Flow lines through the pier with reduction in the lower part of the scenario with eroded bottom.
Flow velocity
In the same way as the flow lines, velocities were analyzed in a cross section parallel to the flow direction and in the center of the pier. The results are shown in the flat bottom scenarios (Figure 10 and Figure 11) and eroded bottom (Figure 12 and Figure 13).
In all cases, it is observed in the upstream direction that the flow loses velocity uniformly until it reaches the face, and in the downstream direction, the velocity field is disordered or non-uniform after colliding with the piers. Note, however, that the flow accelerates again and becomes uniform in the flat bottom scenario at a considerable distance until it regains its initial velocity, and in the eroded bottom scenario, it does so immediately after leaving the pit.

Figure 10 Flow velocity through the pier with reduction in the lower part in the scenario with no eroded bottom.

Figure 11 Flow velocity through the pier with reduction in the high part in the scenario with no eroded bottom.
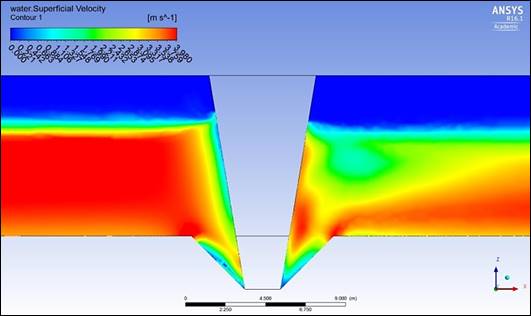
Figure 12 Flow velocity through the pier with reduction in the lower part in the scenario with eroded bottom.
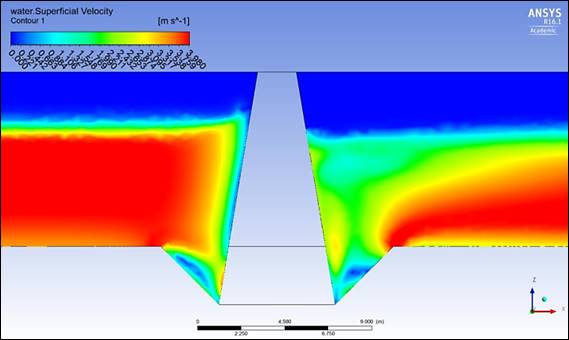
Figure 13 Flow velocity through the pier with reduction in the high part in the scenario with eroded bottom.
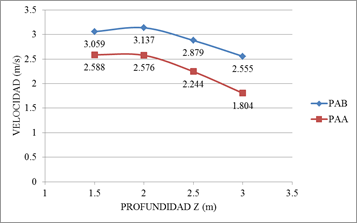
In order to determine the influence of the shape of the piers on the velocities, they were calculated very close to the face upstream of the piers. The results corresponding to the flat bottom scenario (Figure 14) and eroded bottom are shown (Figure 15). In the first scenario, velocities are greater in the pier with reduction in the lower part, appreciating that close to the bottom is 1.12 times greater and far from the bottom is 1.64 times greater. In the second scenario, the velocities are also higher in the pier with reduction in the lower part, appreciating that close to the bottom is 1.18 times greater and far from the bottom is 1.42 times greater. According to the graphs, it is evident that there is a greater effect in the velocities when using the piers with reduction in the lower part, generating a greater force in the flow to erode the channel.

Figure 14 Velocity values at the pier face for the flat bottom scenario. Pier with reduction to the lower part (PAB), Pier with the reduction towards the upper part (PAA).
Conclusions
This research work contributes to the body knowledge of the type of piers with the inclined face, which was made through the numerical modeling tool. The Ansys CFX software calculations allowed us to visualize the flow dynamics around the piers and perform a detailed and precise analysis of the hydraulic parameters, such as current lines and flow velocity, to understand the effect on the local scour of the channel that the inclination of the lateral face of the pier produces. As for the velocities, in both channel scenarios are higher in the pier with reduction in the lower part; in the first scenario it was observed that close to the bottom is 1.12 times greater and far from the bottom is 1.64 times greater, and in the second scenario, it was observed that close to the bottom is 1.18 times greater and far from the bottom is 1.42 times greater. As for the current lines, the pier with reduction in the lower part invites the flow to be directed towards the bottom of the channel, generating higher concentrations of bottom stress and velocities. Then, the erosion process since it starts is seen with greater force in the pier with reduction in the lower part.
With the observations of the physical model of the Cáceres Bridge piers and studies in similar piers, it is concluded that the pier with reduction in the lower part favors the phenomenon of local scour. It is suggested to protect the channel around the bridge pier with rock riprap in order to reduce the kinetic energy produced by the effect of the flow.
REFERENCES
ANSYS CFX. (2006). Solver theory guide. Canonsburg, USA: ANSYS, Inc. [ Links ]
Breausers, H., & Raudkivi, A. (1991). Scouring, hydraulic structures design manual. Florida, USA: CRC Press. [ Links ]
Jaafar, S. (Oct., 2015). Reduction of scour by using tapared pier. 2nd International conference of building and environmental engineering. Simposio llevado a cabo en la conferencia de la University of Technology, Iraq and American University of Beirut, Líbano. [ Links ]
Universidad de Piura. (2001). Estudio del tratamiento integral del río Piura entre la presa los Ejidos y el puente Cáceres. Piura, Perú: Universidad de Piura. [ Links ]
Yanmaz, A. (2002). Köprü Hidroliği. Ankara, Turquía: METU Press. [ Links ]
Acknowledgment
To Universidad de Piura, for the support of this research.
Received: February 21, 2018; Accepted: March 19, 2019
 Este es un artículo publicado en acceso abierto bajo una licencia Creative Commons
