


 text new page (beta)
 English (pdf)
 Article in xml format
 Article references
 Send this article by e-mail
 Cited by SciELO
  Similars in
SciELO
Similars in
SciELO 
 Permalink
Introduction
Excessive soil salinity can inhibit or restrain crop growth, irrigation results in the accumulation of salt to above-normal concentrations in the rooting zone of arable land because high rates of evaporation and transpiration draw soluble salts from deeper layers of the soil profile in arid and semiarid climatic zones (Rozema et al. 2008). According to the National Agricultural Sustainable Development Planning (2015-2030), Huang Huai Hai plain is one of the important agricultural optimization development areas in China, although its environmental resource-carrying capacity does not meet the planning requirements (Yang et al. 2016). Water resources allocation technology was initiated in Huang Huai Hai plain starting in the 1950s in China, and it included the comprehensive management of the groundwater depth and crop growth to increase crop yields (Shi et al. 2013). The early water and salt balance estimation results of the plain showed that 25.7% of the water consumption entered the sea, and the majority of water consumption occurred via evaporation and transpiration. For example, 0.04 ‰ to 0.4 ‰ salinity levels were found in the precipitation and Yellow river water, respectively, and they may enrich the soil salinity by 0.04 billion tons per year (Wei, 1995), which corresponds to 0.16 million tons per year of salinity accumulating in the soil horizon in the People’s Victory Canal irrigation district. In recent years, the ratio of agricultural water to water consumption in the Huang Huai Hai Plain has declined each year regardless of the advantages of various practices to promote the safe use of limited water resources for agriculture (Yang et al. 2016, Yang et al. 2013). As a result of the decreased agricultural water consumption, the gap of agricultural water demand in the Huang Huai Hai plain exceeded 10 billion m3 (Yang et al. 2015), and many questions have been raised with regard to changes in groundwater depth and accumulation of salt in soil profiles, which may consequently degrade the soil quality and crop yield. For instance, the sliding average precipitation value of 3 years was reduced by 2.92 mm/an according to a regression analysis, and the agricultural water consumption in the past 5 years was nearly 75% of the annual average value of agricultural water consumption in the People’s Victory Canal irrigation district (Li et al. 2017), however, the topsoil salinity was elevated (Han et al. 2016, Mora et al. 2017).
Most studies on agricultural water management have focused on developing optimal algorithms for allocation models and determining the water availability and water resource carrying capacity in arid and semi-arid irrigation areas (Wang et al. 2016, Fulazzaky et al. 2014, Bekchanov et al. 2010, Sadati et al. 2014, Wu et al. 2016, Parna et al. 2015, Esmaeili et al. 2015, Al-Omari A et al. 2009), where excessive groundwater exploitation would lead to a sharp drop in groundwater level and raise the groundwater salinity (Mo et al. 2016), and inappropriate water management would improve root layer soil salinity and soil secondary salinization (Singh et al. 2012). Additionally, decreases in precipitation in arid and semi-arid areas have led to excessive groundwater exploitation and basin closure (Molden et al. 2007, Molle et al. 2010).
This study was conducted to estimate the effect of water allocation on soil profiles salinity, groundwater depth and groundwater hydro-chemical characteristics in western 3rd main canal area using location monitoring methodology. Although researchers mentioned above tried to determined water allocation patterns in well canal combined irrigation district, the highlight of the paper over the other in that in our methodology, we imposed soil profiles desalination and groundwater hydro-chemical characteristics, and the suitable water allocation pattern was put forward for well canal combined irrigation district.
The Study Area
General Description. The western 3rd main canal irrigation area lies in the center of the People’s Victory canal irrigation district, the area of which is about 800 hm2, the average annual precipitation is about 580 mm with about 70% of the precipitation occurring from June to September, while the average annual water surface evaporation is about 1860 mm, with most of the irrigation events occurring in January, March, May and June. The western 3rd main canal irrigation area, shown in Figure 1 includes three branch canals. The research area is a typical intensive combined well-canal irrigation area in the People’s Victory Canal irrigation district, which is characterized by an equipped foundation and a complete system of distribution canals, and three branch canals belong to the 3rd western main canal. The irrigation areas of the Branch 1, Branch 2, and Branch 3 are 300, 213.3 and 286.7 hm2, respectively. Additionally, approximate indexes of cropping rotational system, water use habits and irrigation technology in the research area are available for the research area, and the irrigation schedule employed is the traditional border irrigation schedule that occurs in winter, the green stage of winter wheat, and the summer maize seeding stage with surface water and groundwater in the normal hydrological year, 1200 to 1800 m3/hm2 irrigation amount applied per time. The water allocation practices of branch canals operations are shown in Table 1. The total dissolved solids content of surface water and groundwater employed is 390 to 452, 762 to 1464 mg/L, respectively.
where CWWR represents the canal-well water ratio, which is the ratio of SWIM to GWIM, SWIM represents the surface water irrigation amount, and GWIM represents the groundwater irrigation amount.
Table 1 Irrigation amounts from surface water and groundwater for the branch canal areas in 2013-2015.
| Year | Branch 1 | Branch 2 | Branch 3 | ||||||
|---|---|---|---|---|---|---|---|---|---|
| SWIM (×10 4 m 3 ) | GWIM (×104 m3) | CWWR | SWIM (×104 m3) | GWIM (×104 m3) | CWWR | SWIM (×104 m3) | GWIM (×104 m3) | CWWR | |
| 2013 | 207.87 | 201.67 | 1.03 | 208.44 | 79.11 | 2.63 | 213.69 | 169.01 | 1.26 |
| 2014 | 140.11 | 161.33 | 0.87 | 158.06 | 63.29 | 2.50 | 129.83 | 135.21 | 0.96 |
| 2015 | 128.08 | 177.00 | 0.72 | 181.13 | 70.40 | 2.57 | 121.33 | 186.33 | 0.65 |
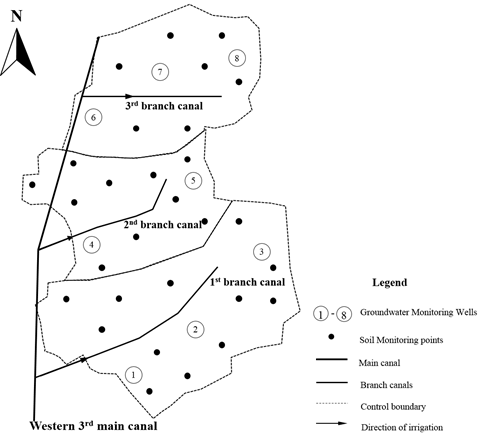
Soil Sampling. Soils were sampled at fixed locations at winter wheat seeding stage (approximate 15th Oct. per year). Soil samples were collected at depth of 0 to 10cm, 10 to 20cm, 20 to 30cm, 30 to 40cm, 40 to 60cm, 60 to 80cm and 80 to 100cm with a standard 3.5 cm Ø soil auger, 5 samples were collected per plot and stored at room temperature before analyzing for electrical conductivity (EC). The EC was measured in extracts of soil pastes (1:5 soil to water ratio). Soil samples locations are shown in Figure 1.
Groundwater Monitoring. Groundwater sampled at 20th per month, depth-setting sampler (Solinst 425, Solinst, Canada) was employed below 20 cm of groundwater depth (phreatic aquifer). The pH was measured in pH meter method (PHSJ-5, Leici, Shanghai). The EC was measured in conductivity meter method (DDSJ-308A, Leici, Shanghai). K+, Na+, Ca2+, Mg2+ concentration in the groundwater was determined using atomic absorption method (AA-7000, SHIMADZU, Japan), CO3 2-, HCO3 -, SO4 2-, Cl- concentration in the groundwater was determined using ion chromatography method (ICS-1500, Dionex, USA). Groundwater samples locations are shown in Figure 1.
Soil Desalination Rate Calculation.
where DR represents the soil desalination rate (%) [22], N th SS represents the soil horizons salinity in winter wheat seeding stage of N th year, (N+1) th SS represents the soil horizons salinity in winter wheat seeding stage of (N+1) th year, N represents the number of the natural years.
Results and Discussion
Characteristic of Precipitation and Irrigation Implementation
Characteristic of precipitation and irrigation implementation was shown in Figure 2. The average annual precipitation is about 574 mm in the study area, while the yearly precipitation in 2013, 2014 and 2015 was 466.9, 558.5 and 569.6 mm, respectively. Additionally, precipitation occurred in major flood period accounted for 67.08%, 73.36% and 51.74% in 2013, 2014 and 2015, respectively. According to seasonal period, precipitation occurred in spring season was 135.0 mm, increased by 20.11% compared with the average annual seasonal precipitation, while precipitation occurred in summer, autumn and winter season was 306.2, 111.0, 17.4 mm, respectively, increased by -10.57%, 10.89%, -8.90% compared with the average annual seasonal precipitation in 2015, respectively.
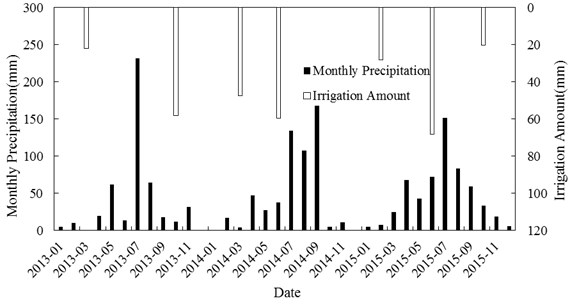
Irrigation was employed in the seeding stage and green up stage of winter wheat in 2013, irrigation amount was 22.2, 58.2 mm, respectively. While irrigation was employed in green up stage of winter wheat and seeding stage of summer maize in 2014, irrigation amount was 47.6, 59.8 mm, respectively. And irrigation was employed in green up stage of winter wheat, seeding stage of winter wheat and summer maize in 2015, irrigation amount was 28.3, 68.2, 20.3 mm, respectively.
Dynamic of Root Layer Salinity
The dynamics of soil layer salinity by date in the study area are shown in Figure 3. It may be observed that soil salinity accumulated in the soil profile (0-10 cm) in the seeding stage of winter wheat in 2013-2015, varied from 0.2839 to 0.4129 mS/cm. The dynamic of soil salinity in examined soil profiles had similar distribution trends in soil horizons in 2013 to 2015, with the salinity of the top 10 cm layer in the irrigation area presenting higher values compared with the content in other soil profiles. At a lower depth of 30 cm, lower salinity was found in the soil profiles from 2013 to 2015. Compared with the values in the same period in 2013, the average soil salinity in the seeding stage decreased by 9.04 to 26.18%, 9.78 to 33.28%, and 4.56 to 36.35% in the soil profiles (0-100 cm) in the irrigation area of the Branch 1, Branch 2, and Branch 3, respectively, in 2014, whereas the average soil salinity in 2015 was reduced by 1.05 to 31.26%, 8.34 to 27.18%, and 9.72 to 18.06% in the soil profiles (0-100 cm) in the irrigation area of the Branch 1, Branch 2 and Branch 3, respectively.
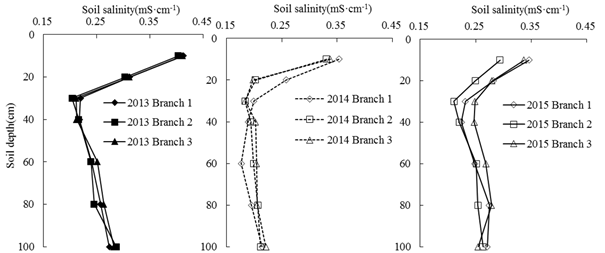
In the irrigation areas of Branch 1, Branch 2, Branch 3, the ratio of surface water to groundwater irrigation ranged from 0.72-1.03, 2.50-2.63, 0.65-1.26 in 2013, 2014, and 2015, respectively (Table 2). The accumulation salinity for the top 100 cm horizons in Branch 2 irrigation area decreased slightly compared with the values in Branch 1, Branch 3 irrigation district by 1.63% to 8.90%, which might be caused by salts in the surface water as well as a preponderance of downward water movement and subsequent leaching to subsoil and groundwater (Molle et al. 2010). The standard deviation of soil salinity calculated from 2013 to 2015 in the study area and the crops tolerances to salinity (Turkan et al. 2009) indicate that the accumulated salinity in the root soil layer will likely represent a serious problem as long as water allocation method increases the soluble salt input levels in the study area (Gao et al. 2015). In addition, compared with the concentration in 2014, the average TDS concentration of groundwater in 2015 increased by 18.66% in the study area. Under certain conditions, soil salinity may be significantly reduced after the irrigation because under the high rates of irrigation with surface water of low salinity, continual leaching of salts to lower horizons will occur (Daou et al. 2016).
Table 2 Salinity and salinity desalination rate in different soil layers.
| Soil Horizons (cm) | Irrigation Area | 2013-2014 | 2014-2015 | Desalination rate in 2013-2015 (%) | ||||
|---|---|---|---|---|---|---|---|---|
| Initial soil salinity (mS·cm-1) | Final soil salinity (mS·cm-1) | Desalination rate (%) | Initial soil salinity (mS·cm-1) | Final soil salinity (mS·cm-1) | Desalination rate (%) | |||
| 0-10 | Branch 1 | 0.4129 | 0.3535 | 14.40 | 0.3535 | 0.3459 | 2.15 | 16.24 |
| Branch 2 | 0.4034 | 0.3308 | 17.99 | 0.3308 | 0.2938 | 11.20 | 27.18 | |
| Branch 3 | 0.4111 | 0.3375 | 17.90 | 0.3375 | 0.3368 | 0.20 | 18.06 | |
| 10-20 | Branch 1 | 0.3114 | 0.2578 | 17.21 | 0.2578 | 0.2819 | -9.34 | 9.48 |
| Branch 2 | 0.3034 | 0.2024 | 33.28 | 0.2024 | 0.2494 | -23.21 | 17.80 | |
| Branch 3 | 0.3111 | 0.1980 | 36.35 | 0.1980 | 0.2794 | -41.13 | 10.18 | |
| 20-30 | Branch 1 | 0.2194 | 0.1996 | 9.04 | 0.1996 | 0.2316 | -16.04 | -5.55 |
| Branch 2 | 0.2034 | 0.1835 | 9.78 | 0.1835 | 0.2107 | -14.81 | -3.59 | |
| Branch 3 | 0.2111 | 0.1843 | 12.66 | 0.1843 | 0.2485 | -34.82 | -17.75 | |
| 30-40 | Branch 1 | 0.2178 | 0.1895 | 12.98 | 0.1895 | 0.2245 | -18.46 | -3.09 |
| Branch 2 | 0.2162 | 0.1938 | 10.33 | 0.1938 | 0.2206 | -13.80 | -2.05 | |
| Branch 3 | 0.2122 | 0.2025 | 4.56 | 0.2025 | 0.2472 | -22.09 | -16.53 | |
| 40-60 | Branch 1 | 0.2399 | 0.1771 | 26.18 | 0.1771 | 0.2484 | -40.30 | -3.58 |
| Branch 2 | 0.2392 | 0.1989 | 16.83 | 0.1989 | 0.2513 | -26.33 | -5.07 | |
| Branch 3 | 0.2512 | 0.2043 | 18.68 | 0.2043 | 0.2682 | -31.27 | -6.74 | |
| 60-80 | Branch 1 | 0.2569 | 0.1950 | 24.09 | 0.1950 | 0.2746 | -40.83 | -6.90 |
| Branch 2 | 0.2452 | 0.2070 | 15.57 | 0.2070 | 0.2542 | -22.80 | -3.67 | |
| Branch 3 | 0.2633 | 0.2055 | 21.95 | 0.2055 | 0.2784 | -35.49 | -5.76 | |
| 80-100 | Branch 1 | 0.2737 | 0.2144 | 21.67 | 0.2144 | 0.2709 | -26.32 | 1.05 |
| Branch 2 | 0.2868 | 0.2117 | 26.20 | 0.2117 | 0.2629 | -24.19 | 8.34 | |
| Branch 3 | 0.2819 | 0.2213 | 21.49 | 0.2213 | 0.2545 | -14.99 | 9.72 | |
Spatial Dynamic of Soil Salinity with Irrigation Area
The spatial dynamics of soil salinity in 20 cm profile in 2013 to 2015 are shown in Figure 4. The EC values averaged for the top 20 cm horizons in 2013, 2014, and 2015 were 0.3456, 0.2820 and 0.2991 mS/cm in the study area, respectively, whereas the standard deviations of the EC values were 0.071, 0.058 and 0.029. For the whole examined soil profile (0-20 cm), the area of EC value exceeded 0.32 mS/cm (equal to 1.50 g/kg soil salinity) was calculated by Sufer 13.0 (Golden Software, LLC ), 60.38%, 59.61% and 84.40% were presented respectively from Branch 1, Branch 2 and Branch 3 irrigation area in 2013. To 2014, 25.99%, 0.94% and 41.87% were presented respectively from the above mentioned irrigation area, in comparison with 2013, the area of EC value exceeded 0.32 mS/cm from Branch 1, Branch 2 and Branch 3 irrigation district has been decreased by 56.95%, 98.42% and 50.39%, respectively. In addition, 41.16%, 8.81% and 52.49% were obtained respectively from above mentioned irrigation area, in comparison with 2013, the area of EC value exceeded 0.32 mS/cm from above mentioned irrigation district has been decreased by 31.83%, 85.22% and 37.81%, respectively.
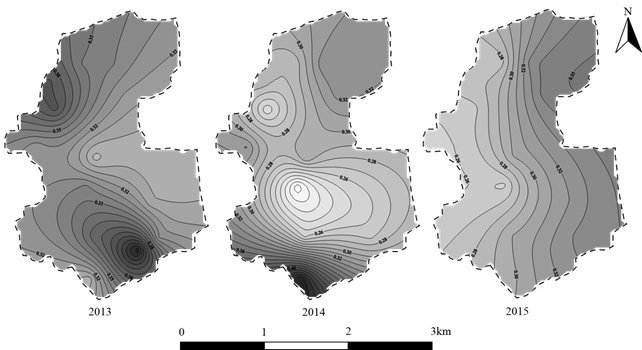
Figure 4 Distribution of average soil salinity of 0 to 20 cm soil layer in research areas from 2013 to 2015.
Compared with the area in the hydrological period in 2013, the area of average soil salinity exceeded 0.32 mS/cm for the top 20 cm horizons decreased notably due to low salt precipitation leaching caused by the high rate of medium concentration water employed for irrigation in the study area (Li et al. 2016). In the present study, the area of average soil salinity exceeded 0.32 mS/cm for the top 20 cm horizons was a negative relationship with canal well water ratio, that is, on top 20 cm layers, average soil salinity content in higher CWWR irrigation area was lower as compared to content in soil from lower CWWR irrigation area (Ghazaryan et al. 2016). The results for the soil desalination rate for the top 100 cm horizons showed that areas with higher CWWRs presented increased values at all sampled depths of the profile and the EC values declined with increasing CWWRs because under the high CWWRs, continual leaching of salts to lower layers occurs. In addition, irrigation with low-salt water caused a drop in the root layer salinity. No doubt, surface water application caused an appreciated decrease in soil salinity, which may eliminate the risk of crop salt stress (Dai et al. 2015).
Effect of Soil Profile Desalination with Branch Canal Irrigation Area
The results from soil horizon desalination calculations of the branch canal irrigation area showed that irrigation by the water allocation patterns caused increases in salinity levels in the lower layer (20-80 cm), and decreased in salinity levels in the top layer (0-20 cm). It was observed that average EC value at all sampled depths of the profile in 2014 was lower than that of 2013, by 9.04% to 36.35%, while average EC value at examined soil profile (0-10, 10-20 and 80-100 cm) in 2015 was lower than that of 2013, by 1.05% to 27.18%. Additionally, compared with Branch 1, Branch 3 irrigation district, soil desalination rate for top 20cm horizons in 2013 to 2015 in Branch 2 was 23.15%, increased by 73.65%, 57.86%, respectively. Furthermore, in comparison with 2013, average EC values for 20-30, 30-40, 40-60 and 60-80 cm layer in 2015 has slightly accumulated, meaningfully, for the examined soil profiles (20-80cm), soil desalination in the Branch 2 irrigation area was -5.78%, which was higher than that in the Branch 1, Branch 3 irrigation area by 21.84% and 60.99%, respectively.
Effect of Groundwater Hydro-Chemical Characteristics with Branch Canal Irrigation Area
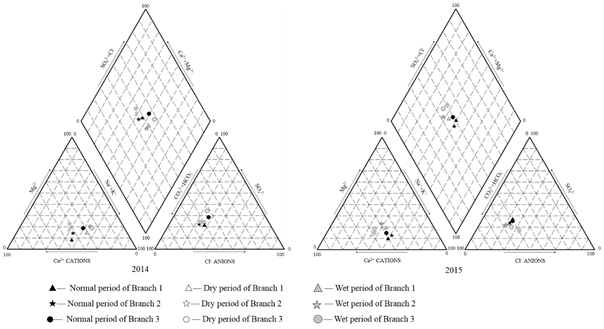
The hydro-chemical characteristics of examined groundwater in Branch 1, Branch 2, Branch 3 irrigation areas are shown in table 3. The water types are generally distinct zones in which the cation and anion concentrations are described within the defined composition categories, and the dominant anion species of water changes systematically from HCO3 -, Cl- to SO4 2- along groundwater flow direction from the irrigation area (Wang et al. 2014, Reddy et al. 2012). The Piper diagram (Wen et al. 2005) in Figure 5 shows that the water type in above-mentioned irrigation areas had similar change trends as groundwater. That is, during the dry period (December, January and February), normal period (March, April, May, October and November), wet period (June, July, August and September), the cation types were Ca2+/Na+, Na+/Ca2+, Ca2+/Na+, respectively. This result indicates that groundwater type had an obvious alkaline trend because of cation change of Ca2+/Na+ in the dry period to Na+/Ca2+ in the normal period. Under certain conditions, groundwater hydro-chemical characteristics may be significantly impacted during winter wheat growth stage because under the high rates of phreatic evapotranspiration with unsuitable water allocation there would concentrate groundwater TDS (Rozema et al. 2008, Karmegam et al. 2011, Brunner et al. 2008). Additionally, in comparison with the dry period in 2014, average TDS concentrations of groundwater in 2015 were increased by 30.28%, 21.83%, 33.95% in Branch 1, Branch 2, Branch 3 irrigation area, respectively. While the normal period in 2014, average TDS concentrations of groundwater in 2015 were increased by 13.35%, 27.88%, 5.17%, and wet period, the increasing values of TDS in 2015 was 0.81%, 18.29% and 16.43% in the above mentioned area, respectively. It was observed that compared with 2014, average TDS concentration has been increased by 1.28, 1.15, 1.12 fold in the dry period, normal period and wet period with study area. From normal period groundwater with Branch 2 irrigation area, in comparison with Branch 1 and Branch 3 irrigation area, value added of TDS was improved by 1.23, 3.48 fold, respectively. No doubt, water allocation employed in the study area caused appreciable increased TDS in groundwater, which may improve the risk of groundwater irrigation occurring normal period.
Table 3 Annual dynamics of groundwater hydrochemical characteristics of a typical branch canal irrigation area.
| Year | Irrigation Area | Water period | Ca2+ (mg·L-1) | Mg2+ (mg·L-1) | Na+ (mg·L-1) | K+ (mg·L-1) | CO3 2- (mg·L-1) | HCO3 - (mg·L-1) | Cl- (mg·L-1) | SO4 2- (mg·L-1) | TDS (mg·L-1) | SAR |
|---|---|---|---|---|---|---|---|---|---|---|---|---|
| 2014 | Branch 1 | Dry period | 112.88 | 11.67 | 129.25 | 0.00 | 0.00 | 403.72 | 126.37 | 131.80 | 895.63 | 16.38 |
| Normal period | 83.56 | 23.38 | 167.18 | 0.00 | 0.00 | 412.91 | 126.38 | 156.55 | 947.41 | 22.86 | ||
| Wet period | 187.18 | 43.96 | 194.63 | 0.00 | 0.00 | 485.28 | 126.38 | 145.93 | 868.49 | 18.10 | ||
| Branch 2 | Dry period | 140.40 | 28.70 | 167.70 | 0.00 | 0.00 | 555.78 | 136.18 | 178.53 | 1113.43 | 18.24 | |
| Normal period | 82.93 | 39.98 | 201.12 | 0.00 | 0.00 | 511.53 | 126.33 | 186.85 | 1009.83 | 25.66 | ||
| Wet period | 212.19 | 58.14 | 230.06 | 0.00 | 0.00 | 576.53 | 142.73 | 205.05 | 838.24 | 19.79 | ||
| Branch 3 | Dry period | 91.20 | 32.30 | 162.00 | 0.00 | 0.00 | 373.30 | 135.10 | 188.10 | 981.20 | 20.62 | |
| Normal period | 101.87 | 45.17 | 259.13 | 0.00 | 0.00 | 519.83 | 165.57 | 330.20 | 1214.30 | 30.22 | ||
| Wet period | 222.68 | 75.13 | 233.50 | 0.00 | 0.00 | 647.05 | 174.33 | 234.73 | 814.67 | 19.14 | ||
| 2015 | Branch 1 | Dry period | 130.86 | 18.71 | 149.25 | 0.00 | 0.00 | 488.97 | 133.55 | 209.33 | 1166.82 | 21.44 |
| Normal period | 111.35 | 34.58 | 185.41 | 0.00 | 0.00 | 496.35 | 119.46 | 162.86 | 1073.85 | 17.47 | ||
| Wet period | 234.12 | 33.74 | 182.68 | 0.00 | 0.00 | 371.11 | 140.07 | 112.28 | 875.51 | 15.79 | ||
| Branch 2 | Dry period | 135.42 | 28.47 | 157.24 | 0.00 | 0.00 | 609.87 | 151.12 | 211.70 | 1356.47 | 24.29 | |
| Normal period | 138.31 | 49.90 | 219.89 | 0.00 | 0.00 | 630.44 | 128.03 | 187.46 | 1291.38 | 16.21 | ||
| Wet period | 233.45 | 41.55 | 208.41 | 0.00 | 0.00 | 416.89 | 166.13 | 123.40 | 991.53 | 17.77 | ||
| Branch 3 | Dry period | 144.00 | 32.52 | 143.09 | 0.00 | 0.00 | 564.11 | 156.13 | 223.53 | 1314.34 | 20.66 | |
| Normal period | 166.28 | 39.88 | 194.06 | 0.00 | 0.00 | 642.88 | 177.58 | 187.43 | 1277.11 | 14.09 | ||
| Wet period | 239.48 | 48.45 | 207.63 | 0.00 | 0.00 | 456.63 | 178.60 | 117.13 | 948.48 | 17.30 |
In comparison with that in the hydrological period in 2014, the average groundwater TDS concentration in 2015 was increased by 22.67% in the study area, which might be due to groundwater exploration as well as a preponderance of phreatic evaporation and subsequent irrigation leaching (Rao et al. 2008). In the present study, SARs of groundwater from Branch 1, Branch 2, Branch 3 irrigation area in the normal period were greater than 18. According to the agricultural irrigation water alkalization classification standard (Li et al. 2013, Vasanthavigar et al. 2010), if SAR values of groundwater were exceeded 18, then it is not fit for irrigation. Additionally, compared with the values in 2014, the SAR values in the above-mentioned irrigation area decreased by 23.58%, 36.82%, 53.37% in normal period, respectively. Furthermore, the SAR values in the above mentioned irrigation area were less than 18 in 2015. The groundwater SAR dynamics occurred largely as a result of the input of ions by surface irrigation, the leaching of ions by precipitation, or the evaporation of ions from groundwater. The decrease of groundwater SAR values in 2015 may have increased agricultural water resources and ensured the positive effect of water allocation (Chaudhuri et al. 2014, Huang et al. 2013).
Conclusions
Larger CWWRs modify the accumulation of salinity in topsoil. Additionally, in comparison with areas exceeded 0.32 mS/cm in 0-20 cm soil profile in a lower ratio of canal well water irrigation district, the results showed that canal water irrigation caused decreased soil salinity to the depths of 20 cm in the study area. Compared with rates in the hydrological period in 2013, soil desalination rate to the depths of 20cm in 2014 and 2015 was notably increased, and the rates improved with the CWWR. For soil desalination to the depths of 100cm from 2013 to 2015, larger CWWRs promoted salinity leaching to lower soil profiles and groundwater. Thus, water allocation employed in the study area might increase groundwater TDS concentration, which can result in alkalization trend of cation types in the normal period. A decrease in the sodium adsorption ratio was observed in the normal and wet period in 2015 compared with the value in 2014 because of irrigation water recharge to groundwater caused by water with low TDS concentrations employed for irrigation in the study area. However, possible increases of TDS in the groundwater may cause potential risks after long term water allocation in the study area. Therefore, water allocation should be emphasized to maintain a healthy groundwater environment and sustainable stable yields of grain in combined canal-well irrigation areas.

