


 text new page (beta)
 English (pdf)
 Article in xml format
 Article references
 Send this article by e-mail
 Cited by SciELO
  Similars in
SciELO
Similars in
SciELO 
 Permalink
Introduction
The black soil region of Northeast China is an important and marketable grain production base, but local soil erosion poses a very serious concern. Erosion leads to decreased fertility of the black soil that directly affects its productivity. Within this context, the Chinese government, as well as scientists and farmers, have paid great attention to the erosion and degradation of the black soil region (Liu 2005). Since the 1990s, several studies have investigated local erosion (Zhang et al. 1992, 2006, 2008; Wang et al. 2008, 2012a; Fang et al. 2012), although most focused on hillslope erosion. Gully erosion also causes land degradation and is an important source of sediment. However, studies on gully erosion in the black soil area remain limited. Data collected around the world show that gully erosion represents between 10% and 94% of the total sediment yield caused by water erosion (Poesen et al. 2003), and both on-site and off-site effects can cause tremendous harm. Reasonable and effective schemes for the control and prevention of gully erosion are therefore very important for food production. Previous studies have been mostly small scale, monitoring <10 gullies over periods of 3-5 years, and using GPS to obtain gully parameters (Hu et al. 2007; Zhang et al. 2007; Wu et al. 2008; Hu et al. 2009; Dong & Wu 2010), while only a few studies have been conducted on a larger scale (Meng & Li 2009; Yan et al. 2010; Wang et al. 2012b).
Landscape ecology theory is a new application in the study of soil erosion. Land use and land cover change are important driving forces that lead to changes in landscape patterns. Furthermore, land use structures are closely related to soil and water loss, and different types of land use and structures within a landscape have a clear impact on runoff and erosion processes (Trimble 1999; Fu et al. 2003). Understanding the relationship between landscape pattern and soil erosion is important for the management of land use structures required to improve the quantity and proportion of the different landscape types, and to optimize the composition of patches to effectively prevent and control erosion (Wei et al. 2006).
This study investigates the relationship between landscape patterns and gully erosion in a typical agricultural landscape of Northeast China’s black soil region. Such landscapes have greater variability than natural landscapes because of the interplay between natural environmental factors and anthropogenic activities. The study of the agricultural landscape is important for understanding the relationships between landscape pattern, the environment, ecological processes, and socioeconomic activities, and is also important for the control and management of land resources and erosion.
Gully distribution data within the study area were obtained from Geographic Information System (GIS) and SPOT5 imagery. In addition, 93 sub-basins were extracted from a digital elevation model (DEM) using an ArcGIS hydrology analysis module. Gully density and corresponding landscape pattern metrics in each sub-basin were established based on the GIS spatial analysis function and FRAGSTATS software. Furthermore, correlation analysis was performed to evaluate the relationship between gully erosion and the agricultural landscape pattern. This study improves the understanding of the causes and effects, as well as laws controlling gully erosion in different land use types and landscape patterns. Furthermore, the results can be considered a basis for the development of land use planning schemes for the control and prevention of soil erosion and water loss.
Material and Methods
Study Area
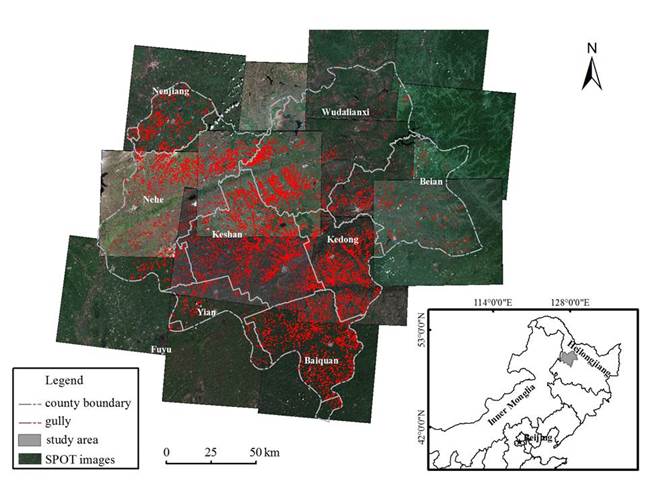
The study area is located within the Wuyuer and Nemoer River basin and is typical of the black soil region of Northeast China. Situated in the middle of Heilongjiang Province, this area covers about 23,000 km2. The cities of Wudalianchi and Beian lie to the north and east, and Mingshui and Fuyu counties lie to the south and west (Figure 1). Geomorphologically, the region is in the transition area between the Songnen Plain and Lesser Hinggan Mountains. The landscape is characterized by rolling hills with gentle slopes of mostly <5°.
The major soil types of the study area include black soil, as well as meadow soil and bog soil found mainly in the low-lying wetland plains. Black soil is characterized by high organic matter content, loose texture, and large pore gaps, the latter two of which facilitate accelerated erosion. The elevation ranges from 150 to 600 m with the highest point in the northeast highlands, while the southwest comprises lower-lying rolling hills/plains. The study area has a temperate continental monsoon climate; its mean annual temperature is 0.2-1.5°C, mean annual rainfall is 550-600 mm, and mean depth of runoff is about 75 mm. The Wuyuer, Nemoer, Shuangyang, Laolai, and Runjin rivers constitute the principal waterways within this region, and the vegetation is characteristically interwoven forest and meadow plains of the Mongolia vegetation zone.
Gully Data
Fourteen cloud-free 2.5-m resolution simulated true color SPOT5 images from 2008 were used as the source from which the gully data were obtained. Field surveys were conducted over a period of about 20 days in 2008 and 2009. The gully width, length and deposit in the gully bottom were investigated, in addition to the lithology, agrotype, land use and vegetation both in and around the gullies. After completion of the field survey, gully interpretation signs were built following the theory of gully classification and growth (Yang 2001) and with support of expert knowledge. The primary method to discriminate the gullies is according to their spectral characteristics; gullies are light green on SPOT5 images and some segments on the gully bottoms appear white. There is a clear boundary between gully and slope, and a fundamental difference in slope, erosion form, land use, soil properties, and vegetation coverage. Gully distribution data were obtained using a combination of ArcGIS 9.3, expert experience, and topographic, geomorphologic, and soil maps. An additional six days were spent conducting validation work in 2009, following which the obtained gully data were updated and finalized (Figure 1). The precision of the gully data was determined to be >90%.
Landscape Pattern Data
Landsat/Thematic Mapper (TM) images from 2008 were used as the data source for assessing landscape patterns. Although SPOT5 images can also be used to obtain landscape pattern information, this source requires considerably more analysis time and is therefore unrealistic due to the large study area (>20,000 km2). TM images are a more appropriate data source for large-scale studies. The necessary interpretation symbols were built based on imagery characteristics (e.g., color, shape, and texture), expert experience, field survey data, and other related geographical maps. ArcGIS 9.3 was then used to interpret the TM images and derive an agricultural landscape map using an interactive module. Compared with the field data, the overall precision of the interpretation was at least 95%. The landscape was classified into eight types: dry land, forest, paddy field, grass, construction land, water area, bare land, and wetland (Figure 2) based on the land use classification system established by previous studies (Liu et al. 2005), Landsat/TM image data sources, and features of the study area.

DEM and Sub-Basin Data
Contours and elevation points were obtained by vectorization using topographic maps. A 5-m resolution DEM was then built using the digital contours and elevation points in the TOPGRID module. The ArcGIS hydrology analysis module was used to extract 93 sub-basins from the DEM as the basic analysis units.
Landscape Pattern Analysis
The main quantitative method to study landscape patterns and dynamics is landscape pattern metrics (Guo et al. 1999). Accordingly, landscape pattern metrics were adopted in the present study to analyze the landscape pattern and identify potential order within the disordered landscape. The percentage of landscape (PLAND) of different land use types was selected as the metric class level with regard to its effect on soil erosion. The perimeter-area fractal dimension (PAFRAC), contagion index (CONTAG), and Shannon’s diversity index (SHDI) were selected as landscape metrics to assess the independence of individual metrics and information integration (Riitters et al., 1995). The metrics above were calculated using FRAGSTATS 3.3 software. Formulas and implications of the metrics can be found in the help file of the FRAGSTATS 3.3 software (http://www.nefu.edu.cn/other/vip/eco-space/ecosoft.him). Single and multi-factor correlation analyses were performed using SPSS 15 software to analyze the relationship between gully erosion and landscape pattern. The methods and goals of the present study are summarized as a flowchart in Figure 3.

Results and Discussion
Status of Gully Erosion
The average gully density is 4,219.2 m2/km2 (Table 1). According to the classification and gradation of soil erosion by the Water Conservancy Department of China (Water and Soil Conservation Office of Water Conservancy Department of China, 1997), there is currently no standard to define damage to planar gully density even though gully degradation poses challenges to sustainable agriculture development and can be directly detected in field investigations. A reasonable standard for the degradation of planar gully density is therefore required.
The area of eroded dry land is 10,149.5 ha (Table 1), but field surveys and interviews with local farmers indicate that the land is unsuitable for cultivation within 10 m of a gully edge. Cultivation performed in such close proximity to a gully leads to accelerated erosion and an exacerbated rate of loss of cultivable land. Therefore, the analysis was performed using a 10-m buffer zone to estimate the eroded dry land (hereafter called destroyed dry land) yielding a total area of 25,261.2 ha (Table 1).
Gully erosion within the study area presents a very serious problem with grave consequences for local agricultural production. Land management schemes and policies must be adopted to prevent gully erosion and control agricultural practices. Gully volume was not measured in the present study but future efforts to derive this parameter may provide important estimates of sediment yield (Wang et al. 2011).
Landscape Patterns and Metrics of the Study Area
According to the class-level metric PLAND, the landscape distribution includes 68.23% dry land, 1.92% paddy field, 9.38% forest, 7.25% grass, 6.57% wetland, 3.65% construction land, 2.63% water area, and 0.37% bare land. The landscape level metric CONTAG is 76.6364, PAFRAC is 1.4502, and SHDI is 1.2535. According to the values of metrics analysis, landscape types and distribution within the study area can be simplified. For example, dry land and forest form the matrix, while paddy field, grass, and construction land are present in mosaic patches, and the water area and wetland constitute corridors. Our results show that this region suffers high levels of artificial intervention, which concentrates areas of dry land and reduces diversity. The combination of these factors means that the region has evolved into an artificial agricultural ecology with low heterogeneity (Liu et al. 2002). This type of landscape has a great impact on soil erosion (Han et al. 2005).
Sub-Basin Gully Density and Landscape Metrics
A sub-basin is both an integrated unit, with runoff, erosive sediment yield, and delivery, and a basic unit over which comprehensive control of soil erosion and water loss can be implemented (Jia et al. 2005). Table 2 shows that the coefficient of variance (CV) of PAFRAC, CONTAG, and SHDI are similar (0.02, 0.82, and 0.12, respectively), which indicates that there is little difference between the landscape pattern configurations within each sub-basin. PAFRAC values range from 1.13 to 1.54 with an average of 1.28, which reveals a concerning level of human disturbance and regular shape of the sub-basins. However, SHDI values are much lower, which indicates a low degree of landscape diversity within each sub-basin. High CONTAG values imply extensive connectivity between batches of the study. The mainland use type was dry land (67.50%) followed by grass (9.74%) and forest (7.2%). All land use types showed that dry land forms the matrix with its simple shape and high levels of human disturbance.
Table 2 Extent of change of gully density and landscape metrics in sub-basins.
| index | Gully density (m2/km2) | Dryland (%) | Grass (%) | Forest (%) | PAFRAC | CONTAG | SHDI |
|---|---|---|---|---|---|---|---|
| Minimum (min) | 32.76 | 3.60 | 0.00 | 0.00 | 1.13 | 61.98 | 0.24 |
| Maximum (max) | 13789.93 | 94.93 | 81.37 | 60.35 | 1.54 | 93.15 | 1.55 |
| Mean | 3878.91 | 67.50 | 9.74 | 7.72 | 1.28 | 74.20 | 0.96 |
| Coefficient of variance (CV) | 3541.38 | 5.78 | 22.72 | 9.34 | 0.02 | 0.82 | 0.12 |
Single-Factor Correlation Analysis between Gully Density and Landscape Metrics
The relationship between gully density and landscape metrics are listed in Table 3. Our findings indicate a positive correlation between gully density and the PLAND of dry land, grass, PAFRAC, and CONTAG, while the PLAND of forest and SHDI show a negative correlation. The positive correlation of gully density with dry land suggests this land use type is a dominant factor in the generation of gully erosion. On the contrary, the negative correlation of forest with gully density implies that this land use type plays an important role in erosion prevention and control. However, in view of the centralized distribution of forest land in the northern and southeastern areas, its functionality in terms of soil and water conservation is limited. The lower correlation of grass might be related to its small coverage area.
Table 3 Correlation analysis between gully density and landscape metrics.
| Dry land (%) | Forest (%) | Grass (%) | PAFRAC | CONTAG | SHDI | |
|---|---|---|---|---|---|---|
| R | 0.58** | -0.43** | 0.25* | 0.515* | 0.48* | -0.569** |
*P < 0.05; **P < 0.01;
The positive correlations of PAFRAC and CONTAG indicate that lower PAFRAC and higher CONTAG values easily enable erosion. One possible explanation for this finding is the high level of human influence that is characteristic of an agricultural landscape. Correspondingly, the regular patch shapes and simple spatial landscape composition can also easily lead to soil erosion. The SHDI is considerably more sensitive to landscape pattern type and can reflect landscape heterogeneity. The negative correlation of SHDI demonstrates that it can serve as an indicator of erosion control. The matrix composed of dry land indicates that patches are ductile with high connectivity and low diversity. Low SHDI values and high CONTAG values bring the potential risk of erosion.
Our findings indicate that the simplified and inhomogeneous landscape pattern found in the study area accelerates gully erosion. The deep analysis shows that regulation of the percentages of grass, dry land and forest, reasonable optimization of the landscape configuration, and an increase of the SHDI can enhance the capability of the landscape to control water erosion (Wei et al. 2005).
Multi-Factor Correlation Analysis between Gully Density and Landscape Metrics
The formation of gullies is dominated by many factors, and the integrated impact between gullies and landscape pattern is interpreted according to theory. Here, using gully density as the dependent variable y and the landscape pattern metrics as independent variables (PAFRAC as x 1, CONTAG as x 2, SHDI as x 3, percent of dry land as x 4, percent of forest as x 5, and percent of grass as x 6), a linear regression was determined using SPSS 15 software. The derived equation is given as:
The results yield R = 0.534. Independent variables x 5 and x 6 were eliminated because these two metrics had little effect on the integrated analysis. The results also show that the integrated effect of multi-factors in gully formation is not particularly high. A given independent variable can only explain about 25% of the dependent variable and might be caused by small differences between the sub-basins. Therefore, landscape differences between sub-basins are not the principal reason for the observed differences in gully erosion. However, these results do suggest that flow hydraulics, rainfall, topography, soils, and land use have important effects on gully formation. The integrated effect of rainfall, land use, soil, vegetation, and landscape physiognomy on erosion needs to be determined in future work (Poesen et al. 2003; Valentin et al. 2005).
Conclusions
The average gully density within the study area is 4,219.2 m2/km2, and the areas of eroded dry land and destroyed dry land are 10,149.5 and 25,261.2 ha, respectively. These values indicate that the study area suffers from severe gully erosion, which is a threat to food production and requires strengthened control measures. The study area is typical of an agricultural landscape with dry land accounting for 68.23%, which constitutes the matrix landscape type, while other types constitute considerably smaller areas. This landscape pattern results in lower PAFRAC and SHDI values and higher CONTAG values, but the difference between the metrics in each sub-basin is insubstantial. This type of pattern accelerates erosion. Large areas of dry land are therefore the most important for concentrating soil and water conservation activities.
The gully erosion and agricultural landscape pattern show characteristic spatial heterogeneity with a range of relationships between different pattern characteristics and soil erosion. Correlation analysis between gully density and landscape pattern metrics indicates that dry land is the predominant landscape that causes gully erosion and forest plays an important part in its prevention. Based on the analysis of PAFRAC, SHDI and CONTAG, reasonable regulation of the landscape pattern configuration of dry land, forest, and grass can be effective in preventing erosion.

