


Servicios Personalizados
Revista
Articulo
 texto en
  Inglés (pdf)
 Artículo en XML
 Referencias del artículo
 Enviar artículo por email
Indicadores
-
 Citado por SciELO
 -
 Accesos
Links relacionados
-
 Similares en
SciELO
Similares en
SciELO
Compartir

 Permalink
Tecnología y ciencias del agua
versión On-line ISSN 2007-2422
Tecnol. cienc. agua vol.10 no.2 Jiutepec mar./abr. 2019 Epub 21-Abr-2021
https://doi.org/10.24850/j-tyca-2019-02-05
Articles
Numerical and experimental assessment of the reflection coefficient of rubble mound breakwaters with an “S” shaped profile

1Instituto de Ingeniería, Universidad Nacional Autónoma de México, Ciudad Universitaria, Ciudad de México, México, jdelvallem@iingen.unam.mx
2Instituto de Ingeniería, Universidad Nacional Autónoma de México, Ciudad Universitaria, Ciudad de México, México, emendozab@iingen.unam.mx
3CONACYT/El Colegio de la Frontera Sur, Chetumal, Quintana Roo, México, jcalcerreca@conacyt.mx
4Instituto de Ingeniería, Universidad Nacional Autónoma de México, Ciudad Universitaria, Ciudad de México, México, rsilvac@iingen.unam.mx
Quantification of the wave reflection from breakwaters is important due to the problems to navigation, port operation and structure stability it may induce. Given the complex interaction between waves and rough slopes, the reflection coefficient is properly unique for each dike type and shape, thus, its estimation depends not only on the wave climate conditions but on the geometry of the structure and its porosity. In this paper a numerical estimation of the reflection coefficient from “S” shaped breakwaters is given from the hydrodynamic results obtained via OpenFoam numerical tool. This information was compared to that published elsewhere and against previous available formulations. The numerical results map well within the ranges experimentally reported, while the best fit model proposed herein showed low dispersion and good precision against the previous formulations. This means that the simple model developed can be used to estimate the reflection coefficient from the originally studied structures and other several kind of structures as well.
Keywords Reflection coefficient; dikes with S-profile; OpenFOAM
La reflexión debida a obras de abrigo es un fenómeno importante de cuantificar dado que, si no se controla, puede provocar problemas a la navegación, a la operación portuaria y, en casos extremos, a la estabilidad de la misma estructura. Dada la forma en que interactúan los taludes de los rompeolas y el oleaje, el coeficiente de reflexión es prácticamente único para cada tipología y forma de dique, por lo que su cálculo depende, además de las condiciones de clima marítimo, de las propiedades geométricas de la estructura, así como de su porosidad. En este trabajo se presenta una evaluación del coeficiente de reflexión para diques rompeolas de piezas sueltas con perfil en forma de “S” a partir de resultados obtenidos con el modelo OpenFOAM. Dicha información se comparó contra datos de laboratorio publicados en otras fuentes y contra algunas formulaciones disponibles en la literatura. Los resultados que ofrece el modelo numérico son muy parecidos a los reportados de manera experimental y, el modelo para el cálculo del coeficiente de reflexión obtenido mostró poca dispersión y buena precisión, en comparación con las formulaciones previas, por lo que puede emplearse en los rompeolas originales del estudio y también en otro tipo de estructuras.
Palabras clave coeficiente de reflexión; diques con perfil en S; OpenFOAM
Introduction
The study and estimation of wave reflection from coastal structures is important because this phenomenon can adversely affect navigation or create dangerous or chaotic sea states at the entrance of ports. Additionally, wave reflection can increase scouring, leading to the destabilization or displacement of structural pieces that may eventually cause the failure of coastal structures (Zanuttigh & Lykke-Andersen, 2010).
From an engineering perspective, the magnitude of wave reflection is commonly characterized by the reflection coefficient, K r , which is defined as the ratio of the reflected wave height (H r ) to the incident wave height (H i ). Several studies have addressed and characterized reflection from breakwaters. For example, Losada and Gimenez-Curto (1981) developed an exponential mathematical model for evaluating K r considering a single rough slope and regular waves. Seelig and Ahrens (1981) integrated several methods to predict wave reflection based on simple equations for calculating the reflection coefficient for regular and irregular waves under breaking and non-breaking wave conditions. Davidson, Bird, Huntley and Bullock (1996) proposed a formula for evaluating K r considering five dimensionless parameters (including the Iribarren number, ξ); these latter authors performed a multiple regression of a data set containing data generated by other researchers such as Seelig and Ahrens (1981), Allsop and Channell (1989), and Postma (1989) as well as experimental data from a natural rock island that acted as a breakwater. Zanuttigh and van der Meer (2008) developed a simple formula from the analysis of an extensive database containing data on the geometries of different artificial pieces (e.g. tetrapods, core-loc, xbloc and antifer) as well as data generated from the use of permeable or impermeable rocks, one or several protective layers and smooth slopes or slopes of differing roughness.
Based on the results of different studies in the literature (Postma, 1989; Van der Meer, 1993; Sutherland y O’Donoghue, 1998; Clavero, 2007; Zanuttigh y Van der Meer, 2008; Mendoza, Silva, Clavero, & Losada, 2010, among many others) it can be deduced that, given the interaction of waves with breakwaters and the lag between incident waves and reflected waves, each breakwater typology must be individually analysed to determine the best wave reflection estimate.
Current computational advances, which are increasingly available on desktop computers, have enabled numerical tools to be incorporated into physical research to improve the understanding of different phenomena studied in engineering fields. For example, Del Jesus, Lara and Losada (2012), and Lara, Del Jesus, and Losada (2012) described the IH-3VOF model based on a tri-dimensional approach that is capable of performing numerical simulations of wave-structure interactions for porous structures. Jensen Jacobsen and Christensen (2014) re-examined flow equations for porous media using the numerical OpenFOAM model based on computational fluid dynamics (CFDs). These latter authors validated the application of these equations to different flow phenomena (run-up and run-down, among others), including regular and irregular flow as well overtopping.
Numerical work
Model description
The OpenFOAM (Open Field Operation and Manipulation) software along with the CFD toolbox is a free and open-source software that contains a set of libraries for solving diverse problems, including those related to fluid dynamics ( OpenFOAM, 2015).
To evaluate the generation and absorption of surface water waves, Jacobsen, Fuhrman, and Fredsøe (2012) developed a library called waves2Foam using the relaxation zone technique (active sponge layers) for generating waves based on different analytical theories (i.e. regular waves ENT#091;Stokes-I, -II -VENT#093;, waves as a function of flow and cnoidal and irregular waves). Relaxation zones were implemented to avoid the reflection of waves from the domain borders or the interference of waves with the borders of the wave generation zone - the first relaxation zone. Additionally, the wavePorousFoam library developed by Alcérreca-Huerta (2014) was applied to porous beach revetments to evaluate the propagation of waves through the interior of one or several porous obstacles. This model integrates the capacities of the waves2foam library concerning the generation and absorption of waves and the simulation of flow through explicitly defined porous structures considering the interaction of two immiscible, isothermal and incompressible fluids (e.g. water and air). To achieve this, wavePorousFoam solves the governing equations of volume-averaged Reynolds average Navier-Stokes (VARANS) and employs the VOF technique to define the interface between fluids. These equations can be consulted in Hsu, Sakakiyama and Liu (2002); Del Jesus et al. (2012), and Jensen et al. (2014). The mathematical form of the VARANS equations used in this study was presented in Alcérreca-Huerta and Oumeraci (2016) as follows:
Continuity equation
Momentum equation
where P is the pressure, g is the gravitational acceleration, n is the porosity, X is the Cartesian coordinates, ρ is the average weighted density of the fluids according to the volume fraction γ occupied by each pass or fluid in a cell and U is the velocity. Turbulent dynamic viscosity μ eff is calculated as μ eff = μ t + μ, where μ t is the turbulent dynamic viscosity estimated using the k-ε model (Nakayama & Kuwahara, 1999) and μ is the averaged dynamic viscosity. The term σ t κ∇𝛶 represents the surface tension between the two phases, where σ is the surface tension and κ is the curvature of the interface: κ = ∇ ∙ (n / ∣n∣), where n = ∇𝛶.
The term CT; is defined according to van Gent (1995) as follows:
The coefficients a and b can be estimated by different mathematical formulas. The coefficient c A was defined by van Gent (1993) for stationary and oscillatory flow through porous media as follows, where coefficient 𝛶vG is equal to 0.34:
Geometry of the transversal section
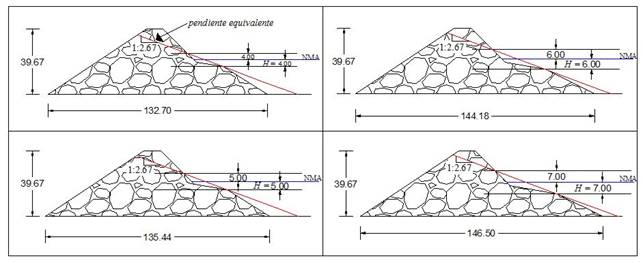
The calculation of the dimensions of the transversal section of the RMBR-S was performed according to the method proposed by Mendoza et al. (2010), which is summarizedat following (Figure 1):
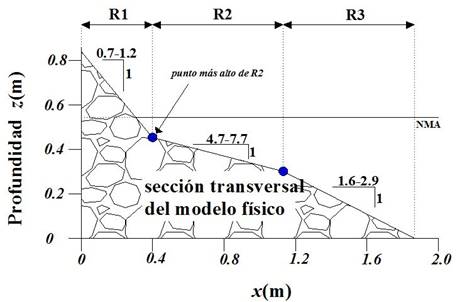
Figure 1 Cross section of the RMBR-S design proposed by Mendoza et al. (2010) with three slopes and their corresponding values.
Once the wave height (H) for a design is known, the lowest point in the R2 zone is set at a depth equal to H. The R2/H quotient should be as follows: 2 < R2/H < 5. R2 should not be above the resting water level.
From the highest point of R2, R1 is drawn. The highest point of R1 should ensure that the breakwater is not exceeded by water. The R1/H quotient should be as follows: 2 < R1/H < 4.
Finally, from the lowest point of region R2, region R3 is drawn. The R3/H quotient should be as follows: 4 < R3/H < 5.
In section a), the restriction of 2 < R2/H < 5 in conjunction with the slope value selected for zone R2 ensures that the highest point of R2 is not above the still water level.
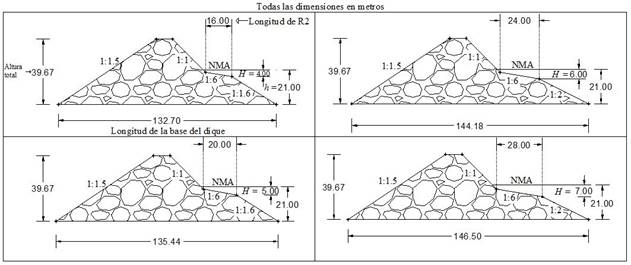
Based on the geometrical design described above, four-wave heights (H = 4, 5, 6 and 7 m) were used to generate the dimensions of four RMBR-Ss. The transversal sections of these designs are shown in Figure 2. The selected slope values for the three regions of R1, R2 and R3 can also be observed.
Porosity
Different values of porosity were considered. In the first stage of the numerical work, only one porosity value (n = 0.45) was considered to obtain values for the reflection coefficient K r as a function of the Iribarren number ξ to subsequently compare the results with available experimentally measured data. In the second stage of the numerical work, different porosity values were considered, including the porosity mentioned above value of 0.45, to observe the effect of this parameter on the K r value. At following, the work carried out during these two stages is described in greater detail.
Wave characteristics
The simulated waves were monochromatic and represented by wave heights (H) of 4, 5, 6 and 7 m. Four-wave periods (T) of 9, 10, 11 and 12 s were modeled as well as a complimentary case with a T = 8 s and a H = 7 m. For all sea states, the most appropriate analytical representation of the waves was Stokes fifth-order waves.
Accordingly, a total of 17 sea states were generated from the combination of four-wave heights with four periods in addition to the sea state of H = 7 m and T = 8 s. As previously mentioned, the four-wave heights determine the dimensions of the transversal sections of the RMBR-Ss, which are shown in Figure 2.
Length of the calculation domain
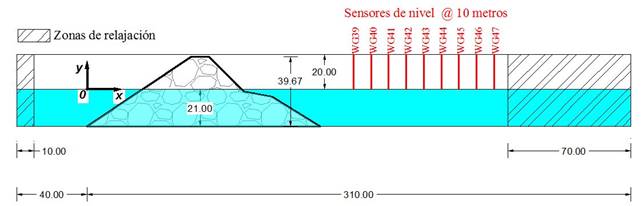
To optimize the simulation time, a sensitivity analysis concerning the length of the calculation domain was performed considering that the time required for modeling increases as the length of the computational domain increases. Different lengths, including 310, 400 and 500 m, were tested under the condition that at least one wavelength be visible, which means that at least one crest and one trough would be present in the domain. The case selected for this analysis had a T = 9 s (shortest wavelength) and a H = 7 m (highest wave height). Also, 40 m were added to the windward side of the breakwater to have enough space to estimate the transmitted waves and to incorporate the relaxation zones. The simulation time for each case was 120 s.
The results were compared according to the dynamic pressure, velocity, and water level values on the face of the RMBR-Ss. The position of the level sensors and the sampling line are shown in Figure 3. The results for dynamic pressure and velocity are shown in Figure 4, and the corresponding results for water level are shown in Figure 5.
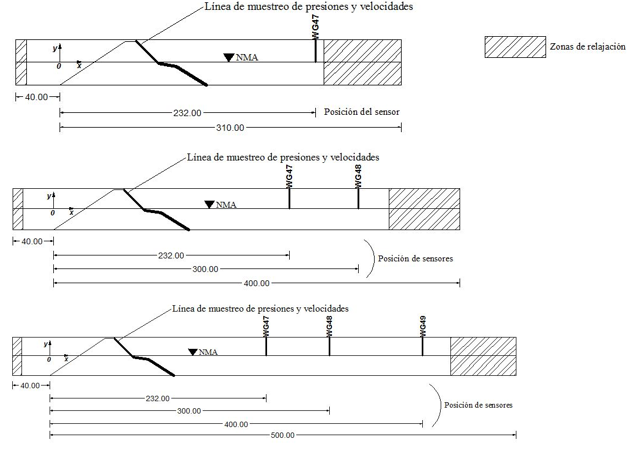
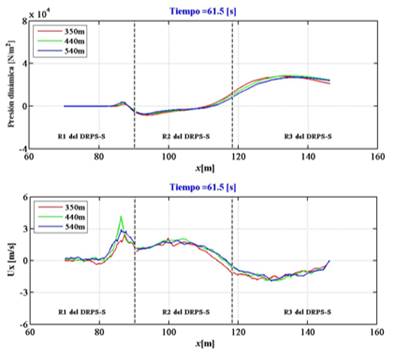
Figure 4 A comparison of the dynamic pressure at t = 61.5 s along the S profile for three proposed domain lengths is shown in the upper panel. A comparison of the horizontal component of velocity along the S profile is shown in the lower panel.
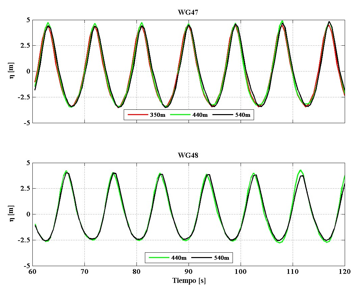
Figure 5 Comparison of the results of the level sensors for the proposed calculation domain lengths.
The results shown in Figures 4 and 5 do not indicate significant variations in the spatial and temporal evolution of pressure, velocity and water level. However, the relative errors for the water surface values at the domain lengths of 440 and 540 m compared to the water surface elevation at a domain length of 350 m varied between 8% and 20%. Based on this observation, it was decided that the final calculation length would be 350 m. The cell size was maintained constant all three analyzed lengths. In particular, the cell size was 1 m at the beginning of the domain and 0.5 m in the vicinity of the breakwater.
Characteristics of the porous medium
To numerically represent a RMBR-S as a continuous porous medium, the values of the coefficients a and b of equation (3) must be known. Several formulas are available in the literature to calculate these coefficients (e.g.Ergun, 1952; Engelund, 1953; Koenders, 1985; Shih, 1990). Version 2.1.0 of OpenFOAM uses the formula of Engelund (1953) , which was also considered acceptable in the present study.
Methods and case studies
To evaluate the reflection coefficient, the expression of K r = |H r /H i | was used. The wave heights were obtained from the results of the modeling technique described in the previous section. The time series recording the variation of the free surface were generated from 9 level sensors distributed every 10 m from the position of x = 152 m towards the RMBR-S (Figure 6).
Two cases studies were considered to evaluate the reflection coefficient as a function of porosity. In the first case, the reflection coefficient was evaluated considering the porosity value of n = 0.45, and the 16 previously mentioned sea states were modeled to observe variations in K r as a result of the structure. In the second case, K r was analyzed considering different porosity values and the following 6 sea states (H [m], T [s]): (5, 9), (6, 9), (6, 10), (7, 8), (7, 9) and (7, 10). For each sea state, 10 porosity values were modelled, including n = 0.05, 0.35, 0.37, 0.40, 0.42, 0.45, 0.47, 0.50, 0.52 and 0.55.
To determine the height of the reflected wave (H r ) and, hence, the value of K r , the following method was implemented:
Simulations of 120 s were carried out under the previously mentioned regular wave conditions. In the analysis of the results, the last 60 seconds of the simulation were analyzed (a minimum of ~10 wave periods).
The first seconds of the simulation were eliminated from the records, and the average water level was corrected by an arithmetic correction method (Silva, 2005). This correction was done by first obtaining the average wave time series; then, the average value was subtracted from each value of the time series, resulting in the new corrected time series.
Considering the new corrected series and regular waves, there is a single incident wave height (H i ). Consequently, there is a single reflected wave height (H r ) with a distinct phase because of the geometry of the S-shaped profile and the porous medium, which agrees with the report of Losada et al. (1997). Mathematically, total wave height is then represented by the following expression: H T = H i +H r .
Equivalent slope
Lastly, the dimensionless parameter that best describes the behavior of the reflection coefficient is the Iribarren number, or the surf parameter ξ (-). To estimate this number in the present case, it is necessary to define the value of an equivalent slope that is representative of the hydrodynamics of the S-shaped profile of the RMBR-S. For this estimation, the procedure proposed by van der Meer (1992) was used, which considers the incident weight height (H i ) as a reference measurement unit. The slope of a distance equal to this unit that extends both above and below the average water level is determined. First, lines are drawn parallel lines to the average water level. These lines cross the s-shaped profile, and their points of crossing serve as a reference for drawing the line whose slope is the required equivalent. In Figure 7, an example of this procedure is provided, and an equivalent slope value of 1:2.67 was obtained for the four transversal sections of the RMBR-Ss.
Results
Reflection coefficient as a function of the Iribarren number
The estimated K r values are shown in Figure 8 as a function of the Iribarren number.
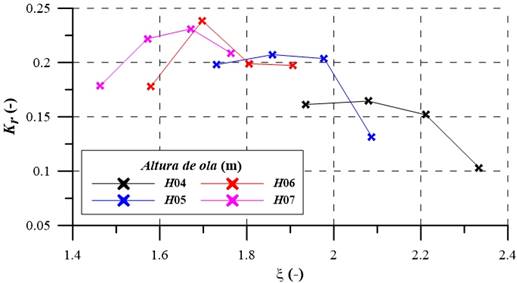
From Figure 8, the following can be concluded:
The magnitude of the reflection coefficient increases as wave height increases.
The behavior of the reflection coefficient for distinct Iribarren numbers is congruent with the known behaviour.
Plunging breakers are generally associated with Iribarren numbers equal to or less than 2. The majority of the results for K r are within this range and are associated with wave heights of 5, 6 and 7 m. This indicates that the S profile encourages plunging breakers for tall waves, which is an advantage considering that the breakwater aims to dissipate the greatest possible amount of wave energy on the S profile.
The obtained reflection values coincide with those reported by Quiñones (2006).
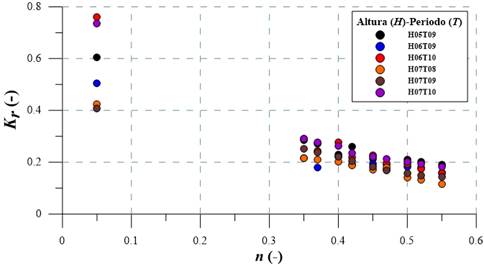
Reflection coefficient as a function of porosity
In Figure 9, the results of K r are shown as a function of porosity. The porosity was varied from nearly impermeable (n = 0.05) to very permeable (n = 0.85). In the obtained results, it is clear the K r value is higher at lower porosity values.
Discussion of the numerical results
The obtained numerical results are compared to the reflection coefficients experimentally estimated in Quiñones (2006) and those presented in Zanuttigh and van der Meer (2008) in Figure 10. The numerical results are within the range of variation of those obtained in the physical model. For the majority of the numerical results, the associated wave breakage type is plunging, while for the experimental data, mostly surging breakers are indicated. All numerical data in Figure 10 were obtained given a porosity value of 0.45.
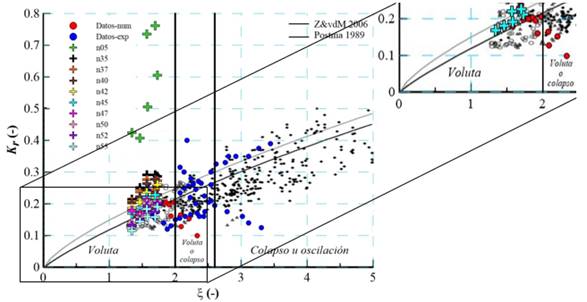
Figure 10 The numerical results are compared to those of Quiñones (2006), and Zanuttigh and van der Meer (2008) in the left panel. The lowest Iribarren numbers are presented in the right panel.
The combination of the two numerical cases allowed the Iribarren number and porosity to be included in the calculation of reflection coefficient, which is ultimately dependent on these prior two variables. The consideration of porosity is important given that this value can change throughout the useful life of a breakwater as a result of the movement of pieces in the primary layer or the clogging of interstitial spaces with material traveling in suspension as well as saltation. Hence, the results for the best-fit curves of the models (linear equations were selected) were obtained and drawn to establish a basis for a family of equations that would enable the reflection coefficient of a RMBR-S to be determined as a function of the Iribarren number and porosity (Figure 11). The slope and y-intercept values of this family of lines are shown in Table 1.
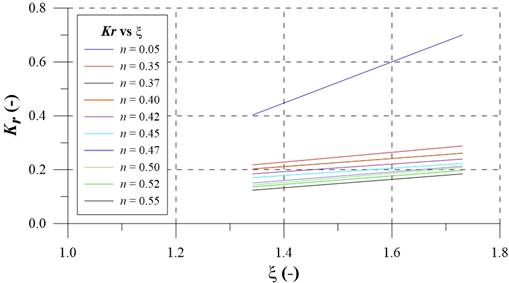
Table 1 Best fit parameters (slope and y-intercept) of the reflection coefficient curves as a function of porosity.
| n | m | b |
|---|---|---|
| 0.05 | 0.7644 | −0.6226 |
| 0.35 | 0.1809 | −0.0249 |
| 0.37 | 0.1500 | 0.0017 |
| 0.40 | 0.1506 | 0.0000 |
| 0.42 | 0.1414 | −0.0053 |
| 0.45 | 0.1356 | −0.0116 |
| 0.47 | 0.1600 | −0.6412 |
| 0.50 | 0.1678 | −0.0822 |
| 0.52 | 0.1577 | −0.0754 |
| 0.55 | 0.1557 | −0.0852 |
To evaluate the performance of the linear equations, the obtained results are compared in Figure 12 with those of other expressions available in the literature, namely those of Losada and Gimenez-Curto (1981) (eq. (5)); Seelig and Ahrens (1981) (eq. (6)); Postma (1989) (eq. (7)), and Zanuttigh and van der Meer (2008) (eq. (8)), which are presented as following:
The equation of Losada and Giménez-Curto (1981) generated reflection values that were slightly lower than those of the line estimates in Table 1 (Figure 12, panel A). These latter authors considered porosity but applied their formula to a straight and homogeneous slope. In this case, an average error and standard deviation of 26.1% and 13.5%, respectively, were found. Meanwhile, the equations of Seelig and Ahrens (1981) generated slightly higher reflection values (see Figure 12, panel B), but the adjustment was acceptable. In this case, an average error and standard deviation of 24.6% and 16.3%, respectively, were found. The equation of Postma (1989) was similarly compared to the family of lines (see Figure 12 panel C). In this case, an average error and standard deviation of 34.7 and 37%, respectively, were found. The linear equations estimated higher values for the reflection coefficient, yet the data dispersion was not too large. Finally, the equation of Zanuttigh and van der Meer (2008) was compared to the family of lines. In this case, an average error and standard deviation of 24.3% and 28.5% were observed. This comparison showed the least difference between the generated values.
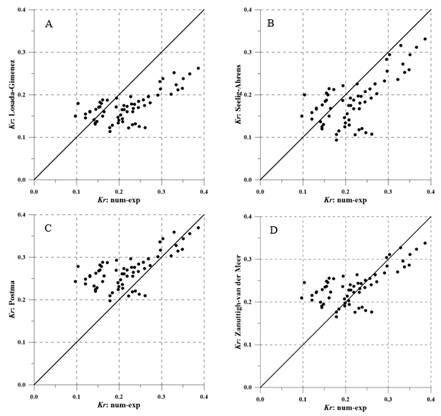
Figure 12 Comparison of the reflection coefficient values given by the linear equations (Table 1) with those given by equation 5 (panel A), equation 6 (panel B), equation 7 (panel C) and equation 8 (panel D).
From the observation of Figure 12, it can be concluded that the family of lines summarised in Table 1 is a useful tool for estimating the reflection coefficient as a result of reflection from RMBR-S and other types of breakwaters.
Conclusions
A numerical study was carried out to estimate the hydrodynamic conditions resulting from the interaction of waves with a rubble mound breakwater with an S-shaped profile (RMBR-S). In particular, the reflection coefficient of this interaction was estimated for regular waves (Stokes V). Incident wave conditions and the porosity of the breakwater were selected as degrees of freedom in the proposed numerical model. Hence, a model formed by a family of lines was developed to directly estimate the reflection coefficient as a function of the values of the degrees of freedom. The results of the model were then compared to those of experimental data available in the literature; in this comparison, the graphed results showed similar ranges of values for the reflection coefficient.
Once the direct estimation model of the reflection coefficient was defined, the results of this model were compared to those of previous estimation formulas under the same conditions. Low data dispersion and relatively high error were found but were of a similar order to that observed in previous studies. In conclusion, the proposed model is capable of estimating wave reflection from a RMBR-S and other types of breakwaters at an acceptable level of accuracy.
Referencias
Alcérreca-Huerta, J. C. (2014). Process-based modelling of waves interacting with porous bonded revetments and their sand foundation (Ph.D-thesis). Technische Universität Carolo-Wihelmina zu Braunschweig, Alemania. [ Links ]
Alcérreca-Huerta, J. C., & Oumeraci, H. (2016). Wave-induced pressures in porous bonded revetments. Part I: Pressures on the revetment. Coastal Engineering, (110), 87-101. [ Links ]
Allsop, W., & Channell, A. (1989). Wave reflection in harbours: Reflection performance of rock armoured slopes in random waves. Hydraulic Research Report (OD 102), Ed. HR Wallingford, Wallingford, Oxfordshire, Reino Unido. [ Links ]
Clavero, M. (2007). Comportamiento de los diques en talud frente a la acción del oleaje y criterios para el reparto de la probabilidad conjunta de fallo en la vida útil (Ph.D-thesis). Universidad de Granada, España . [ Links ]
Davidson, M. A. , Bird, P. A. , Huntley, D. A. , & Bullock, G. N. (1996). Prediction of wave reflection from rock structures: an integration of field & laboratory data (pp. 2077-2086). In: Procedures 25 th ICCE, ASCE, Nueva York, EUA. [ Links ]
Del Jesus, M., Lara, J. L., & Losada, I. J. (2012). Three-dimensional interaction of waves and porous coastal structures. Part I: Numerical model formulation. Coastal Engineering, (64), 57-72. [ Links ]
Engelund, F. (1953). On the laminar and turbulent flow of groundwater through homogeneous sand. Trans. Danish Academy of Technical Sciences, København, Dinamarca. [ Links ]
Ergun, S. (1952). Fluid flow through packed columns. Chemical Engineering Progress, 48, 89-94. [ Links ]
Hsu, T. J., Sakakiyama, T., & Liu, P. L. F. (2002). A numerical model for wave motions and turbulence flows in front of a composite breakwater. Coastal Engineering, 46, pp. 25-50. [ Links ]
Jacobsen, N. G., Fuhrman, D. R., & Fredsøe, J. (2012). “A wave generation toolbox for the open-source CFD library: OpenFOAM®”. International Journal for Numerical Methods in Fluids, 70, 1073-1088. [ Links ]
Jensen, B., Jacobsen, N. G., & Christensen, E. D. (2014). Investigations on the porous media equations and resistance coefficients for coastal structures. Coastal Engineering, 84, 56-72. [ Links ]
Koenders, M. A. (1985). Hydraulic criteria for filters. London: Estuary Physics Publ., Londres, Reino Unido. [ Links ]
Lara, J. L., Del Jesus, M., & Losada, I. J. (2012). Three-dimensional interaction of waves and porous coastal structures. Part II: Experimental validation. Coastal Engineering, (64), 26-46. [ Links ]
Losada, M., & Gimenez-Curto, L. A. (1981). Flow characteristics on rough, permeable slopes under wave action. Coastal Engineering, (4), 187-206. [ Links ]
Mendoza, E., Silva, R., Clavero, M., & Losada, M. (2010). Evolución del comportamiento hidráulico y de la geometría de diques homogéneos al ser deformados por el oleaje. Tecnología y ciencias del agua, 1(2), 21-35. [ Links ]
Nakayama, A., & Kuwahara, F. (1999). A macroscopic turbulence model for flow in porous media. J. Fluids Eng., (121), 427-433. [ Links ]
OpenFOAM . (2015). OpenFOAM. The Open Source CFD Toolbox. User Guide. Version 3.0.1. OpenFoam Foundation Ltd., Londres, Reino Unido. [ Links ]
Postma, G. M. (1989). Wave reflection from rock slopes under random wave attacks (Ph.D-thesis). Delft University of Technology, Delft, Holanda . [ Links ]
Quiñones, J. L. (2006). Estabilidad de diques en talud (Master thesis). Faculty of Engineering, Universidad Nacional Autónoma de México, México . [ Links ]
Seelig, W. N., & Ahrens, J. P. (1981). Estimation of wave reflection and energy dissipation coefficients for beaches, revetments and breakwaters. CERC Tech. (paper 81-1). USACE, Vicksburg, EUA. [ Links ]
Shih, R. W. K. (1990). Permeability characteristics of rubble material, new formulae (pp. 1499-1512). International Conference of Coastal Engineering, Delft, Holanda. [ Links ]
Silva, R. (2005). Análisis y descripción estadística del oleaje (Publication SD/49) . Engineering Institute, Universidad Nacional Autónoma de México, México. [ Links ]
Sutherland, J., & O’Donoghue, T. (1998). Characteristics of wave reflection spectra. Journal of Waterway, Port, Coastal and Ocean Engineering, (124), 303-311. [ Links ]
Van der Meer, J. W. (1992). Stability of the seaward slope of berm breakwaters. Coastal Engineering, 16, 205-234. [ Links ]
Van der Meer, J. W. (1993). Conceptual design of rubble mound breakwaters (publication number 483) . Delft Hydraulics, Holanda. [ Links ]
Van Gent, M. R. (1993). Stationary and oscillatory flow through coarse porous media (Ph.D-thesis). Communications on Hydraulic Geotechnical Engineering, Delft University of Technology, Delft, Holanda . [ Links ]
Van Gent, M. R. (1995). Porous flow through rubble-mound material. Journal of Waterway, Port, Coastal and Ocean Engineering, (121), 176-181. [ Links ]
Zanuttigh, B., & van der Meer, J. W. (2008). Wave reflection from coastal structures in design conditions. Coastal Engineering, 55, 771-779. [ Links ]
Zanuttigh, B., & Lykke-Andersen, T. (2010). Wave reflection in 3D conditions. Coastal Engineering, 57, 531-538. [ Links ]
Received: July 07, 2015; Accepted: July 30, 2018
 Este es un artículo publicado en acceso abierto bajo una licencia
Creative Commons
Este es un artículo publicado en acceso abierto bajo una licencia
Creative Commons
