


Servicios Personalizados
Revista
Articulo
 texto en
  Inglés (pdf)
 Artículo en XML
 Referencias del artículo
 Enviar artículo por email
Indicadores
-
 Citado por SciELO
 -
 Accesos
Links relacionados
-
 Similares en
SciELO
Similares en
SciELO
Compartir

 Permalink
Tecnología y ciencias del agua
versión On-line ISSN 2007-2422
Tecnol. cienc. agua vol.10 no.1 Jiutepec ene./feb. 2019 Epub 21-Abr-2021
https://doi.org/10.24850/j-tyca-2019-01-04
Articles
Performance assessment of irrigation districts in Mexico through technical efficiency analysis
1Estudiante de Doctorado en Ciencias, Centro de Investigación en Alimentación y Desarrollo (CIAD). Carretera a Eldorado Km. 5.5, Col. Campo El Diez, C.P. 80110, Culiacán, Sinaloa, anabel.altamirano@estudiantes.ciad.mx
2Departamento de Estadística Aplicada, Centro de Investigación en Alimentación y Desarrollo (CIAD), Carretera a Eldorado Km. 5.5, Col. Campo El Diez, C.P. 80110, Culiacán, Sinaloa, jvaldez@ciad.mx
3Coordinador Académico del Doctorado en Ciencias Administrativas, Universidad de Occidente Unidad Culiacán, Dirección: Boulevard Lola Beltrán 3210, 80020 Culiacán, Sinaloa, cui.valdez@gmail.com
4Investigador Titular C; SNI nivel I. Coordinación de Desarrollo Regional, Departamento de Economía Regional e Integración Internacional (DERII), Centro de Investigación en Alimentación y Desarrollo, A.C.; Edificio Desarrollo; Carretera a la Victoria Km. 0.6; Hermosillo, Sonora, C.P. 83304, Apdo. Postal 1735, jleon@ciad.mx
5Investigador Titular C, SNI-I, Coordinación de Acuicultura y Manejo Ambiental. Centro de Investigación en Alimentación y Desarrollo (CIAD) Unidad Mazatlán en Acuicultura y Manejo Ambiental. AP.711, Mazatlán, Sinaloa, México 82000, mbl@ciad.mx
6Investigador Titular C; SNI:Nivel I, Departamento de Horticultura, Centro de Investigación en Alimentación y Desarrollo (CIAD), Carretera a Eldorado Km. 5.5, Col. Campo El Diez, C.P. 80110, Culiacán, Sinaloa, osuna@ciad.mx
Problems with irrigation are closely related with an inefficient management of aspects such as: irrigation infrastructure, water distribution, and agricultural practices. In Mexico, the irrigation districts (ID) are organizations with a relevant role in irrigation management. Hence the pertinence of evaluating their performance. Following Burton´s (2010) systemic conceptual framework, a benchmarking, based on DEA technical efficiency and scale efficiency, was applied to a sample of 42 irrigation districts. First, 6 groups of homogenous IDs were formed applying Principal Component Analysis and Cluster Analysis using variables such as: number of users, irrigated area, main crops, and water distribution forms. Next, in accordance to available records, performance variables and indices were selected for systems of infrastructure, finance, production, and natural environment. Finally, significant performance variables and indices were identified through Tobit regression. For illustration purposes, two clusters (CS5 and CS6) were selected to evaluate irrigation performance. Benchmarking resulted an adequate strategy to evaluate performance of IDs at a cluster level, and systems level within each cluster. The scale efficiencies and yield metrics calculated showed strengths and weaknesses within each district. Average efficiencies, by district allowed to rank the districts, and to identify the benchmarker district, in each cluster. Lastly, Tobit regression allowed for identification of significant inefficiency factors in each cluster.
Keywords Data Envelopment Analysis; Benchmarking; Irrigation Districts; Returns to Scale
Los problemas del riego están estrechamente relacionados con una gestión ineficiente de infraestructura de riego, distribución del agua y diversas prácticas agrícolas. En México, los distritos de riego (DR) son organizaciones que tienen un rol relevante en la gestión del riego, de ahí la pertinencia de evaluar su desempeño, con base en una muestra de 42 distritos de riego, dentro del marco conceptual sistémico de Burton (2010), benchmarking, basado en eficiencia técnica DEA y rendimiento de escala. Primero, se formaron seis grupos de DR homogéneos a los que se aplicó un Análisis de Componentes Principales y un Análisis de Conglomerados con variables como número de usuarios, área regada, principales cultivos y formas de distribución del agua de riego. Enseguida, de acuerdo con la disponibilidad de registros, variables e indicadores de desempeño fueron seleccionados para los sistemas de infraestructura, finanzas, producción y medio ambiente. Finalmente, variables e indicadores determinantes de eficiencia se identificaron mediante regresión Tobit. A manera de ilustración, dos conglomerados (CS5 y CS6) fueron seleccionados para evaluar el desempeño del riego. El benchmarking resultó una estrategia adecuada para evaluar el desempeño de los DR a nivel de conglomerados y de sistemas dentro de cada conglomerado. Las eficiencias y rendimientos de escala calculados mostraron fortalezas y debilidades de cada uno de los distritos. Las eficiencias promedio, por distrito, permitieron hacer un ranking y determinar el distrito referente (benchmarker) en cada conglomerado. Finalmente, la regresión Tobit permitió identificar factores determinantes de ineficiencia por conglomerado.
Palabras clave análisis Envolvente de Datos; Benchmarking; Distritos de Riego; Rendimiento de Escala
Introduction
Water, more than land, has become the limiting restriction for world development. With many basins closed or closing down, the message is clear and overwhelming. More attention is needed with regards to finite water sources on the planet in order to feed the world population, and to sustain aquatic ecosystems. Irrigated agriculture consumes about 70% of the water used for consumption purposes, which is managed in a deficient manner. Efficiency must be a keyword for irrigation managers; it is required in all of their operations, so that water extraction from underground sources is kept to a minimum, and rivers and water tables are maintained. Thus water may be delivered, in the moment, place, and amount required. Waste must be reduced at all points in the supply chain (Burton, 2010).
A strategy that has become important for the study of irrigation performance is benchmarking, which consists in evaluating an organization’s managerial practices by contrasting their performance to other comparable organizations considered the best (Malano & Burton, 2001). Comparing the activities and processes of irrigation organizations has allowed to obtain useful information related to the manner in which they manage their resources, generate products, and provide services, as well as diagnosing irrigation systems’ state of affairs, and generating proposals for managerial improvement (Ali & Klein, 2014; Borgia et al., 2013; Chebil, Frija & Abdelkafi, 2012).
Mexico’s irrigation infrastructure is considered the sixth largest in the world with 6.4 million hectares. Of these, 3.4 million hectares correspond to 85 irrigation districts (ID) (Conagua, 2014a), which make use of 26,819 million cubic meters of water, 31.31% of the total water conceded for consumption purposes (Conagua, 2016). In most IDs, plots of land receive water through gravity, which incurs in heavy losses (30%) due to deficient conduction and distribution. This is attributed to the precarious state of infrastructure and inadequate control structures in the canal network of the districts (Mejía, Palacios, Exebio & Santos, 2002; Peinado-Guevara, V. M., Camacho-Castro, Bernal-Domínguez, Delgado-Rodríguez, & Peinado-Guevara, H. J. 2012; Conagua, 2013).
Other studies conclude that irrigation tariffs are insufficient to guarantee the operation and preservation of the irrigation infrastructure, which impacts the efficiency in the distribution of water, given the high costs of rehabilitation and maintenance required by the irrigation network , Exebio, Mejía, Santos & Delgadillo, 2002). Generally, the sources of inefficiencies, their estimation, and possible solution alternatives constitute a research problem that has not been engaged with enough depth.
A first study regarding irrigation management in Mexico, made from 1998 to 2001, gathered annual data for 93 variables with the purpose of comparatively evaluating irrigation management in User´s Associations. A pilot test named Evaluation Program Based on Quality Indicators (PEBIC for its Spanish initials), was conducted from 2001 to 2002. Which included 34 irrigation modules in 8 irrigation districts, and 21 performance indicators were analyzed regarding aspects of operation, maintenance, modernization, financial management, and transparency.
The purpose of the PEBIC was to compare districts and modules in order to diagnose the causes of their performance differences. In 2002, an independent consultor applied benchmarking, using the indicators proposed by Malano & Burton (2001) to evaluate the performance of 5 irrigation modules for the Yaqui River irrigation district (Cornish, 2005). Overall, the scope of these studies were limited by the validity and quality of the data obtained, and the lack of a statistical analysis of said data. A more impactful study, using benchmarking, was conducted in irrigation modules of the Mayo River irrigation district. It analyzed operation, productivity, and financial management indicators for the 1998-2003 period. The causes of performance variation were diagnosed among the modules, but no recommendations regarding improved practices or specific actions for performance improvement were provided (Cornish, 2005).
Given the importance of irrigation for food production, the high percentage of water used in agriculture, and the problems related to its management, it is pertinent to study irrigation in Mexico using an integrated framework, with a focus on the efficiency of its operating systems as production and/or service agents.
As a first step to approach the problem of irrigation, it is advised to identify the factors that may affect the performance of the organizations which engage in this activity. Data Envelopment Analysis (DEA) is a tool widely used to study performance. It allows for evaluation of the performance of organizations through the inputs it uses, and the outputs it generates.
Given the above, the objective of the present work is to perform a benchmarking study of the IDs using DEA, in order to evaluate the performance of irrigation, detect inefficiencies in its management and identify areas of opportunity that will allow decision makers to trace alternatives, and/or measures to improve the water management of Mexico’s IDs.
Background
Evaluating the performance of irrigation operations and activities is a complex endeavor, given the large amount of factors that influence irrigation, and the great diversity of schemes in which these take place. An approach that has gathered attention is the benchmarking strategy based on the analysis of technical efficiency. Benchmarking uses performance indicators, stochastic frontier analysis, and data envelopment analysis. Based on these tools, the literature presents a series of studies that seek to compare irrigation districts with regards to their efficiency levels, as well as identify returns to scale and external factors that affect observed efficiency indices.
DEA has also been applied at the individual producer level (farms). A study of coffee producers in Vietnam showed that small producers were less efficient than large ones, attributing the observed inefficiencies partly to the scale of irrigation infrastructure investments made (Rios & Shively, 2005). The effects of irrigation system type (along with other variables) on the efficiency of water used for irrigation was studied in west Kansas, USA; determining the relationship between the magnitude of excess irrigation water, irrigation system type, and producer characteristics (Liliendeld & Asmild, 2007). DEA and Tobit regression were used to determine the efficiency and causal factors of low efficiency in irrigated agricultural producers in Tunisia.
The average efficiency was less than 65%, which was attributed to operation costs, producer education level, and lack of access to credit and agricultural extension services. However, some producers could reduce their water consumption without affecting their output (Chebil, Frija, & Abdelkafi, 2012). In a study under the Research and Verification Program in Wheat, implemented in the University of Arkansas, the DEA analysis revealed that the majority of the participating land had high technical and scale efficiencies. Implying that inputs were used at the minimal required levels to reach the obtained outputs. However, the majority of the participants exhibited economic and distribution inefficiency, and did not use their resources in the necessary combinations to reach minimal costs.
The Tobit analysis indicated that the economic and distribution inefficiencies could be improved with a better crop variety selection, and better irrigation (Watkins, Hristovska, Mazzanti, Wilson Jr. & Schmidt, 2014) Seeking to improve the production of sugar cane, and to make efficient use of natural resources, a study in Pakistan estimated the efficiency in irrigation water using DEA.
It found that inefficiencies were substantial in the forms in which irrigation was applied, both in tubed water owners and water buyers. Educating producers, creating better credit conditions, opportunities for income outside of agriculture, and providing better extension services for production technologies could help to improve technical and irrigation efficiency in sugar cane production. A key finding of the study was that access to technology is not a major restriction in the production of sugar cane. Alternatively, producers can increase their production with existing technology. In the long run, the required improvements in efficiency and productivity for the sugar industry in Pakistan, must be in line with improvements in technical efficiency of production of sugar within the efficient use of limited water resources (Watto & Mugera, 2015).
Studying users associations under various DEA models, found that apparently efficient associations showed decreasing returns to scale. This was attributed to saturation in the irrigation services. The results allowed to delineate and implement strategies and policies for managers, and engineers so that operations from efficient associations could be understood, and their best practices could be emulated to achieve the same efficiency levels.
At the irrigation district level, consistent rankings have been determined based on irrigation efficiency, and managerial and operations improvements have been proposed for irrigation districts of lower efficiency levels through the suggestion of switching to more profitable crops (Ntantos & Karpouzos, 2010). Performance and Productivity benchmarks, based on DEA, have allowed to identify irrigation schemes that are efficient and deficient, grouping them according to their productive and economic performance (Borgia et al., 2013). Naceur & Mongi (2013) found that the education level, and agricultural training have a significant impact in the efficiency of water usage, which can be of importance for extension agents and managers in the making of guides to increase efficiency in the exploitation of water.
Other applications of DEA have allowed to estimate how much water can be saved in irrigation districts without decreasing the irrigated area covered, by means of advanced irrigation techniques, but that have declined in their technical efficiency (Ali & Klein, 2014).
At the regional level, DEA was applied to evaluate and compare the productive performance of wheat grown in various regions of Pakistan, and India. Three inputs were used for the analysis: irrigation water (m3/ha), seeds (kg/ha), and fertilizers (kg/ha). The results showed that inefficient production units could save considerable resources by adopting the best practices of production units with high performance. Irrigation and fertilizer overuse were identified as the main source of inefficiency among the production units at a regional level and among regions.
A detailed analysis is needed to identify other underlying causes of inefficiencies. Including environmental factors and agricultural practices (Malana & Malano, 2006). Seeking to contribute to the development of a methodological approach that can simplify the performance evaluation of sustainable agricultural systems, while considering a multidimensional perspective, a study based on DEA was implemented in the European Union (EU). Many considered scenarios reflected preferences with respect to the importance of the three dimensions of sustainability.
The impact of the choice of models such as constant returns to scale, and variable returns to scale, as well as input oriented versus output oriented models, and constraint balance was determined. Applying DEA at a regional level made it possible to diminish the heterogeneity, and to evaluate the performance within each member state of the EU, and among them. This heterogeneity is a fundamental topic of research in the domain of agricultural system sustainability (Gerdessen & Pascucci, 2013).
Another application of the DEA at a regional level, used many inputs and outputs to measure the performance of agricultural areas in valleys, plains, and mountains in Romania. Clear differences were present between areas with similar geographic characteristics in terms of the allocation of production factors (labor, land, and mechanization) and products. In the majority of the areas, the global efficiency of agriculture is not reached, these regions need to decrease their level of input consumption, or to increase their levels of production using fixed capital and high yields (Toma, Dobre, Dona & Cofas, 2015).
Conceptual Framework
Irrigation, Irrigation System, and Irrigation Scheme
Agricultural irrigation is a complex mixture of technical, institutional, economic, social, and environmental processes that has been conceptualized in various manners. Chambers (1988) identifies irrigation as a scheme consisting of physical, human, and bio-economic domains; among which exchanges of goods and services take place. Using the systemic approach, Small & Svendsen (1990) consider irrigation as a system, with inputs, outputs, and effects. The system itself is considered to be within a context of embedded economic systems. Following the systemic approach, Burton (2010) suggests that irrigation should be studied as a system consisting of 5 domains, which are shown in Table 1.
Table 1 Domains and Components of an Irrigation Scheme (Burton, 2010).
| Domain | Components |
|---|---|
| Technical | - Physical conditions related to design and operation |
| - Physical Infrastructure | |
| Institutional | - Political System |
| - Legal framework | |
| - Organizations and structures, and organizational functions | |
| Economic | - Markets |
| - Market price | |
| - Development and operational costs | |
| - Opportunities for employment | |
| Social | - Population |
| - Communities and social structures | |
| Environmental | - Effects on the aquatic environment |
| - Flooding and salinity | |
| - Health issues |
Irrigation System and Irrigation Scheme
For the study of irrigation management, from a administrative perspective, it is important to clarify two concepts: Irrigation System, and Irrigation Scheme. An irrigation system refers to the network of irrigation and drainage canals, including their structures. Irrigation scheme refers to the total irrigation and drainage complex, the irrigation system, the irrigated land, the towns, roads, etc. (Burton, 2010).
Performance Evaluation in an irrigation scheme: general framework
The general framework, proposed by Burton (2010), to develop a performance evaluation program in an irrigation scheme consists, operationally, of 4 general stages: Purpose and Scope, Design, Implementation and Action. Each stage is described briefly below.
Purpose and Scope
In this stage the following questions must be answered: who will be evaluated? From which point of view will the evaluation take place? Who will make the evaluation? What type and to what extent will the evaluation be? The performance evaluation can be done at the request of a variety of interested parties such as: governments, funding agencies, irrigation service providers, irrigation system managers, agricultural producers, and research institutions. Performance evaluation can be conducted from the perspective of agricultural producers, industry investors and/or the government. In addition, the evaluation can be done by different organizations or individuals with different capabilities and skills with regards to performance evaluation.
With regards to the type of evaluation, Small & Svendsen (1990) identify 4 different types of performance evaluation: operational type, responsibility type, intervention type, and sustainability type. Burton (2010) adds a fifth type: diagnostic analysis. Operational evaluation is related to the day to day, season to season monitoring, and the performance measurement by scheme. The responsibility evaluation is made to measure the performance of the agents responsible for managing the irrigation scheme. The intervention evaluation is made to study the performance of an irrigation scheme, and it generally seeks ways to improve its management. The sustainability evaluation focuses on the long-term use of the resources and their effects. The diagnostic evaluation uses the performance evaluation to identify the causes of the observed performance to identify its causes, with the objective of improving the levels of performance obtained.
The scope of a performance evaluation needs to be identified, and its limits defined. Two primary limits are related with the spatial and temporal dimensions. The spatial limit refers to the area or number of covered schemes. The temporal limit refers to the duration of the evaluation exercise, and the temporal extension. The use of the systemic approach proposed by Burton (2010) can help to define and understand the limits and scope of the evaluation program. This perspective focuses on inputs, processes, outputs and effects. The measurement of these outputs provides information about the effectiveness of resource use, while the comparison of outputs versus inputs provides information about the efficiency of the process to transforms inputs into outputs.
The final part of this stage consists in establishing the objectives of the evaluation program. These objectives must be established at three levels: rational, general, and specific. At the rational level it must be determined why the evaluation program is required, the general objective details the general purpose of the program, while the specific objective can be required to provide additional details about how the global objective will be reached. The establishment of the objectives is presented in detail during the next stage of the evaluation program.
Program Design
Having specified the scope of the performance measurement in terms of purpose and reach, one proceeds to the design of the program. In this stage, the following key questions must be considered: Which criteria must be used? Which performance indicators must be used? What data is required? Who will collect the data? Where and when will the collection of data take place? What format is required for the results? The following definitions will help to clarify the previous questions:
Purpose (Goal) |
the purpose is useful to clearly identify an accomplishment level which must be strived for. Goals are related to performance results desired for the future |
Criterion |
The criteria are specific results which are more measurable than the purpose. A criterion generally indicates the direction towards which an organization must be lead to ensure best practices |
Indicator |
The performance indicators are the main tool in a performance evaluation program. A performance indicator is a ratio that relates two or more variables (e.g. irrigated area, irrigation water volume, productivity, etc.) in a manner that a great amount of information can be reduced to a single number. The indicators allow to identify the variables for which data must be collected |
Objective |
an objective is something that must be sought to its most complete level, and it can generally indicate the direction of the change or effect desired. The objectives are made of criteria, for example, maximizing agricultural production, assuring equality in water supply, or optimizing the efficiency in water distribution. The criteria can be measured using performance indicators, which identify the data requirements that must be collected, processed, and analyzed |
Implementation
In the third stage, implementation, methodologies are applied to collect, process, and analyze the data. Depending on the nature of the performance evaluation program, the implementation can span a short period (weeks) or a long period (years).
Results application
The use given to the results of the performance evaluation will depend on the original reason to carry it out. Possible actions after the end of the performance evaluation can be: (1) Redefining the strategic objectives, (2) Operational redefining of objectives, and (3) Implementation of corrective measures, where performance evaluation identifies the root cause of a problem. Additional studies may be required to implement measures that will solve the issue.
Evaluation Levels
Performance evaluation can be done at different levels. At the sector level when irrigation is evaluated in terms of its performance in comparison to other uses for water resources. At the main system level, where the performance of the delivery service for water is measured. At the farm level, where the performance of water delivery to the farm, the use of water, and the application of water is measured. At the irrigation scheme level, where individual scheme performance is measured, implicitly or explicitly, against its established objectives; or when performance is measured for different schemes against themselves. It is important to define from the start if performance evaluation is for a scheme (internal analysis), or to compare between schemes (external analysis). A significant problem with performance analysis for irrigation schemes is the complexity, and the great variety of existing scheme types. This makes comparisons among them difficult. For example, the irrigation schemes can have different forms of management, irrigation technology, etc. There is no existing methodology yet that provides a definitive approach to categorize irrigation schemes. For this reason, discussion continues to be present regarding comparisons among equal entities. Key descriptors for irrigation schemes can be used as a starting point to select schemes with similar key features for comparison. However, at this point it is important to recognize that comparison among different types of schemes can be equally valuable.
Benchmarking
Benchmarking of irrigation schemes is a comparative way (external) of evaluating performance that has been frequently used. Generally, benchmarking seeks to compare the performance of the schemes with “best practices” against schemes of lower performance, and identify differences in performance (Burton, 2010). A manner in which to do benchmarking is by comparing the technical efficiency of organizations under study, when doing their activities.
Technical Efficiency Analysis
The analysis of technical efficiency can be done through different statistical and mathematical tools. DEA is a linear programing technique, which has been used successfully to evaluate the relative performance of a set of organizational units that use the same resources (inputs), and obtain the same results (outputs) (Ramanathan, 2003; Zhu, 2010). The organizational units of interest are called Decision Making Units (DMU). The main goal of DEA is to measure the efficiency in the use of the available resources by the DMUs to generate a set of products (Charnes, Cooper & Rhode, 1979). Through DEA, the performance of the DMUs is evaluated in terms of technical efficiency, which corresponds to a relative value that relates outputs with respect to inputs in the DMUs (Ramanathan, 2003). A brief description of the more commonly used DEA models for benchmarking studies is presented below.
CCR Model
In general, the CCR model can be constructed with two different objectives: to maximize outputs, holding the amount of inputs (output oriented model), or minimize the amount of input (input oriented model) (Cooper, Seiford, & Tone, 2007). The linear form of the output oriented CCR model, for DMUk, is shown next:
Subject to
Where x ij and 𝑦 𝑟𝑘 are the inputs and ouputs of DMUk, respectively. Similarly, 𝜇 𝑟 and 𝑣 𝑖 represent the weights of inputs and outputs, respectively. In this case, it is said that a DMUk is efficient when 𝑧 𝑘 =1. In the output oriented CCR model, unlike the input oriented CCR model, the obective function should be minimized. In practice, it is more convinient to solve the dual form of Model (1), shown next:
Subject to
In Model (2), the variable ( represents the efficiency of DMU k and ( j is a dual variable associated with the DMUj.
BCC Model
Banker, Cooper, Seiford & Zhu
(2011) proposed another model, called the BCC model, adding
the convexity restriction
Subject to
When Model (3) is solved, an optimal effiency value (θ*) for the DMU k is obtained. The proccess is repeated for each DMUj. Those DMUs with θ*<1 are said to be innefficent, while DMus with θ*= 1 are points on the boundary.
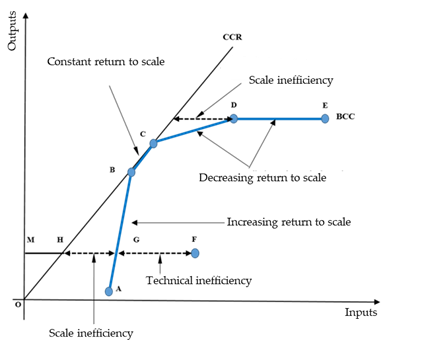
Returns to Scale
For a better understanding of the performance of a DMU, in addition to DEA efficiency, is important to determine its return to scale. In general, a DMU may have decreasing, constant, or increasing return to scale. The return to scale is decreasing when a proportional increase in inputs produce a smaller proportion of increase in outputs; it is constant when the proportions are equal; and it is increasing when a proportion of increase in inputs produce a larger proportion of increase in outputs. Figure 1 shows technical efficiency, scale efficiency, and the 3 types of returs to scale for DMUs with one input and one output.
Under the CCR model, if (
Tobit Regression
Once efficient and inefficient DMUs have been determinated by DEA, the next step is to identify which factors are causing innefficiency. One way to do so consists in relating the efficiency values with variables that influence on the operation of the DMUs. The relative nature of the technical efficiency estimated makes it a censored dependent variable, so that Tobit regression is recommended in this case. A Tobit model with two limits is suitable to estimate the variable and efficiency indicator’s impacts on efficiency, since efficency values are censored between 0 and 1 (Maddala, 1986).
The expression of the Tobit model is:
where,
Methodology
Initially, the 42 IDs in the Dry Climatic Group obtained by Altamirano-Aguilar et al. (2017) were considered. To reduce heterogenicity among the IDs, a Principal Componenet Analysis was performed using the variable shown in Table 2 (Conagua, 2015a). Then a Cluster Analysis was performed with the components of each ID to form homogeneous (comparable) groups. Once homogenous groups were obtained, two of them were arbitrarily chosen to evaluate the performance of their IDs, following the performance evaluation program for irrigation schemes proposed by Burton (2010) and using DEA for efficiency analysis and benchmarking.
Table 2 Variables for conforming homogeneous groups.
| Variable | Units |
|---|---|
| Number of users | - |
| Irrigated area | ha |
| Cultivated area with green alfalfa | % |
| Cultivated area with bean | % |
| Cultivated area with corn grain | % |
| Cultivated area with grain sorghum | % |
| Cultivated area with grain wheat | % |
| Distributed water by pumping from streams | % |
| Distributed water by pumping from wells | % |
| Distributed water by derivation by gravity | % |
| Distributed water by gravity from dams | % |
Next, each one of the steps of the performance evaluation program developed is presented in detail.
Step 1: Purpose and scope
The results of this work will be useful for central management and ID managers, as well as, researchers interested in water irrigation management. The evaluation adresses the farm producers and irrigation managers point of view and was carried out by a group of researchers and graduate students at CIAD, AC.
The type of evaluation is operational by schemes (IDs), specifically defined by the physical and geographical frontiers of each ID and temporally by the 2011-2012, 2012-2013 and 2013-2014 agricultural seasons. The scope of the performance evaluation, based on the nested system proposed by Small & Svendsen (1990), comprehends the irrigation system, the agricultural irrigation system, and agricultural economic system.
The purpose of this work is to contribute to the improvement of ID management. The general objective is to increase agricultural and economical water productivity, through the following specific objectives: (1) maximize the amount of distributed water, (2) maximize the income from water service fees, (3) maximize agricultural and economical water productivity, and (4) reduce the impact of irrigated agriculture activities on soil degradation.
Step 2: Design
From the objectives of the performance evaluation, the criteria and performance indicators shown in Table 3 were defined. To compute performance indicators, values of the following variables from each ID, were used: Total chanel´s length (km), Restoration costs ($), Technification costs ($), Efficiency of water conduction, Volume of total water delivered to users (thousands of m3), Total irrigated area (ha), Agricultural production (thousands of tons), Management costs (thousands of $), Operation costs (thousands of $), Maintenance costs (thousands of $) and a Soil degradation index.
Table 3 Criteria and indicators for performance evaluation.
| Objetives | Criteria | Performance Indicators |
|---|---|---|
| Maximize the amount of water delivered to users | Efficiency | Volume or water delivered (thousands of m3)/ha |
| Maximize income from irrigation water service fees | Efficiency | Fees for water service ($)/ha |
| Maximize agricultural water productivity | Productivity | Agricultural production (ton)/ha |
| Maximize the economical value of the agricultural production | Productivity | Agricultural production value (thousands of $)/ha |
| Minimize soil degradation | Efficiency | Soil degradation index |
For the efficiency and productivity analysis, the input oriented DEA CCR and BCC models were implemented using performance variables and indicators under the systemic model proposed by Malano & Burton (2001) for an irrigation scheme, which includes three domains: (1) Delivered service (which includes the areas of System Operation and Financial Performance), (2) Productive efficiency and (3) Environmental Performance.
To apply DEA analysis the following systems were considered: Infrastructure (I) in the area of system operation, General Finances (FG) in the area of financial performance, General Production (PG) in productive efficiency and Environmental (E) in the environmental performance. Relative efficiencies, returns to scale, IDs with the best performances (efficient IDs), and comparisons of IDs with low performance (inefficient IDs) were determined based on the DEA results.
Step 3: Implementation
Data collection depended on availabilty of records at goverment agencies. Agricultural and hydrometric data were obtained from the Estadísticas Agrícolas de Distritos de Riego for the agricultural seasons: 2011-2012, 2012-2013 y 2013-2014 (Conagua, 2015a). Financial records on hydraulic infrastructure were obtained from Conagua (2014b, 2015b) and the Subdirección General de Infraestructura (2013) Data validation was confirmed by descriptive statistical techniques. The relative efficiency analysis was carried out for the models shown in Table 4, using the DEA software OSDEA-GUI, Version 0.2.
Returns to scale were determined according to the method proposed by (Banker, Cooper, Seiford & Zhu, 2011)
using the values of efficiency for the CCR and BCC models, and the values of
𝑗 𝑛 𝜆 ∗ 𝑗 obtained from the CCR model. First, all IDs with the same CCR
and BCC efficiencies were chosen, independently of the values for
Tobit regression, with two limits, was applied with efficiency as the dependent variable, and as independent variables: Irrigared area (IA) (ha), Number of users (NU), Covered chanels (CC) (%), Uncovered chanels (CSR) (%), Total annual production/irrigated area (TAP/IA) (ton/ha), Production value/Irrigated area (PV/IR) (thousands of $/ha), Maintenance cost /Irrigated area (CM/IA) (thousands of $/ha), and Soil degradation index (SDI). The statistical analysis was carried out using the Stata 14 software.
Results and Discussion
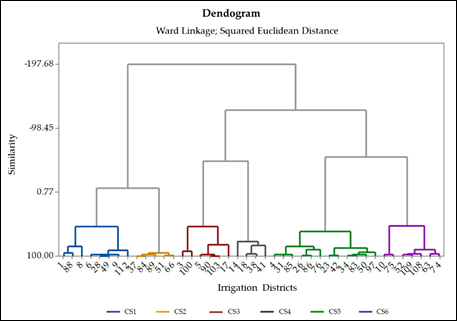
Principal Components Analysis showed 4 components with an accumulated variance of 65%. From these 4 components, Cluster Analysis, using Ward link and squared euclidian distance, determined 6 clusters (CS1- CS6) with a simmilarity greater than 52% (Figure 2).
Benchmarking
Because of space restrictions, benchmarking analysis is presented only for clusters CS5 (IDs 50, 23, 31, 85, 76, 4, 83, 86, 26, 42, 97 and 34) and CS6 (IDs 52, 108, 74, 10, 109, 75 and 63).
Cluster CS5 showed large variability in irrigated area and number of users, eventhough its statistics exhibit that its IDs are of median size. On the other hand, its IDs are homogeneous in infrastructure, volume and production value, maintenance cost, soil degradation, and supply and conducting source. By main crop volume, this cluster is composed of forage producer IDs (Table 4).
Table 4 General Characteristics of the IDs in cluster CS5.
| Variable | Mean | Standard deviation | Minimum | Median | Maximum |
|---|---|---|---|---|---|
| Irrigated area (ha) | 22081 | 27893 | 1808 | 7011 | 73215 |
| Number of users | 2913 | 3401 | 68 | 1822 | 10243 |
| Covered chanels (%) | 54.44 | 31.29 | 11.14 | 47.73 | 98.80 |
| Uncovered chanels (%) | 39.84 | 30.69 | 1.20 | 36.24 | 88.86 |
| Total annual Production/Irrigated area (tons/ha) | 14.08 | 6.92 | 4.86 | 14.34 | 26.38 |
| Production value/Irrigated area (thousands of $/ha) | 31.19 | 12.69 | 12.55 | 30.53 | 52.63 |
| Maintenance cost/Irrigated area (thousands of $/ha) | 0.31 | 0.25 | 0.00 | 0.26 | 0.89 |
| Soil degradation index | 1.56 | 0.50 | 0.49 | 1.79 | 2.00 |
| Source and conduction | Gravity from dams | ||||
| Main crops | Sorghum grain and forages | ||||
The statistics for irrigated area and number of users show that the Cluster CS6 is composed of large IDs. The IDs are homogeneous in infrastructure, volume and value of production, maintenance cost, soil degradation, and source of supply and conduction. By the volumes of its main crops, this cluster is composed by corn and vegetables producer IDs (Table 5).
Table 5 General Characteristics of the IDs in cluster CS6.
| Variable | Mean | Standard deviation | Minimum | Median | Maximum |
|---|---|---|---|---|---|
| Irrigated area (ha) | 92511 | 83205 | 12023 | 59404 | 220007 |
| Number of users | 10637 | 7542 | 2432 | 8775 | 20791 |
| Covered chanels (%) | 52.30 | 34.20 | 8.90 | 50.10 | 100.00 |
| Uncovered chanels (%) | 47.50 | 34.40 | 0.00 | 49.40 | 91.00 |
| Total annual Production/Irrigated area (tons/ha) | 13.20 | 6.34 | 4.43 | 13.40 | 23.56 |
| Production value/Irrigated area (thousands of $/ha) | 39.44 | 14.79 | 19.46 | 39.25 | 54.93 |
| Maintenance cost/Irrigated area (thousands of $/ha) | 0.78 | 0.32 | 0.41 | 0.74 | 1.40 |
| Soil degradation index | 1.67 | 0.31 | 1.15 | 1.81 | 1.97 |
| Source and conduction | Gravity from dams | ||||
| Main crops | Sorghum grain and forages | ||||
Benchmarking for Cluster CS5. Input oriented DEA efficency analysis was conducted using the input-output variables and indicators shown in Table 6.
Table 6 DEA Models for Performance Evaluation.
| Systems | Inputs | Outputs |
|---|---|---|
| Infrastructure | Total length of chanels (km) Rehabilitation costs/iIrrigated area (thousands of $/ha) Technification costs/Irrigated area (thousands of $/ha) | Conduction efficiency |
| General Finances | Management costs/irrigated area (thousands of $/ha) Operation costs/Irrigated area Costo (thousands of $/ha) Maintenance costs/Área regada (thousands of $/ha) | Income from fees for irrigation service/ Irrigated area (thousands of $/ha) |
| General Production | Volume of total annual water delivered to users /Irrigated area (thousands of m3/ha) Irrigated area (ha) | Total value of annual production /Irrigated area (thousands of $/ha) Total annual production/Irrigated area (tons/ha) |
| Environmental | Soil degradation index | Total annual production/Irrigated area (thousands of tons/ha) |
The Cluster CS5 had a mean efficiency e = 0.73, with a prevailing increasing return to scale. To reach the BCC efficiency frontier, maintaining high output levels, the IDs should reduce their input levels. Furthermore, the IDs showed increasing return to scale, allowing them to increase their productivity and/or to reach a constant return to scale by increasing thier productive capacity (Table 7).
Table 7 Technical Efficiency and Return to Scale by System of IDs in Cluster CS5.
| ID Code | Name | Systems | |||||||
|---|---|---|---|---|---|---|---|---|---|
| Infrastructure | General Finances | General Production | Enviromental | ||||||
| e | RtoS | e | RtoS | e | RtoS | e | RtoS | ||
| 50 | Acuña-Falcón | 1.00 | CNT | 1.00 | ICR | 1.00 | CNT | 1.00 | CTE |
| 23 | San Juan del Río | 1.00 | DEC | 1.00 | CNT | 1.00 | DEC | 0.59 | CRE |
| 31 | Las Lajas | 1.00 | CNT | 1.00 | CNT | 1.00 | ICR | 0.50 | CRE |
| 4 | Don Martín | 1.00 | CNT | 0.82 | ICR | 0.54 | ICR | 1.00 | CRE |
| 85 | La Begoña | 1.00 | CNT | 0.93 | ICR | 0.57 | ICR | 0.85 | CRE |
| 86 | Río Soto La Marina | 0.29 | ICR | 1.00 | CNT | 0.87 | ICR | 0.90 | CRE |
| 26 | Bajo Río San Juan | 0.21 | ICR | 0.89 | ICR | 0.92 | ICR | 0.64 | CRE |
| 83 | Papigochic | 0.33 | ICR | 1.00 | CNT | 0.78 | ICR | 0.49 | CRE |
| 42 | Buenaventura | 0.37 | ICR | 1.00 | DEC | 0.64 | ICR | 0.50 | CRE |
| 97 | Lázaro Cárdenas | 0.12 | ICR | 1.00 | ICR | ICR | ICR | 0.87 | CRE |
| 76 | Valle del Carrizo | 0.14 | ICR | 1.00 | DEC | 0.59 | ICR | 0.54 | CRE |
| 34 | Edo. de Zacatecas | 0.07 | ICR | 0.82 | ICR | 0.39 | ICR | 0.54 | CRE |
| Mean | 0.54 | 0.95 | 0.73 | 0.70 | |||||
| Global mean efficiency | 0.73 | ||||||||
e = efficiency, RtoS = Return to Scale, CNT = Constant, DEC = Decreasing, ICR = Increasing
In infrastructure, the mean group efficiency was low (e = 0.54). In particular, the IDs 50, 23, 31, 85 and 4 used all their resources efficiently; while the the IDs 76, 83, 86, 26, 42, 97 and 34 used their resources excessively, having large rehabilitation and technification costs for the efficiency level of conduction shown.
In General Finances, the mean efficiency was high (0.95), prevailing constant and/or incresing returns to scale. In general, the income from fees for water services was sufficient to cover the IDs management, operation, and rehabilitation costs.
In General Production, the group mean efficiency was regular (e = 0.73), prevailing an incresing return to scale. The volume of delivered water and irrigated area were high for the volumes and values of production given. ID 50 used completely and efficiently its delivered water and irrigated area for the volume and value of production shown. The IDs 23 and 31 should change to a constant return to scale, by increasing the volume and value of their production through better agricultural practices, or introducing high output and value crops. The remaining IDs should reduce their water loses, introduce better agricultural practices or look for crops of larger yield and value.
In the Environmental system the mean efficiency was regular (e = 0.70), prevailing an increasing return to scale. With exception of IDs 50 and 4, in general, most of the IDs showed high levels of soil degradation, which affects their agricultural production (Table 7).
Comparatively, ID 50 is the most efficient and its practices can be reference criteria for the whole cluster. ID 31 emerged as a referent in Infrastructure and General Finances for IDs 85, 76, 4, 83, 86, 26, 42, 97 and 34. In terms of mean general efficiency, ID 50 was the best evaluated (e = 1.0) and ID 34 was the worst evaluated (e = 0.454). The IDs in this group were ranked according to their mean efficiency (Table 8).
Table 8 Peer IDs for Cluster CS5 and Ranking.
| ID code | Name | Infrastructure | General Finances | General Production | Enviromental | Mean efficiency | Ranking |
|---|---|---|---|---|---|---|---|
| 50 | Acuña-Falcón | - | - | - | - | 1.000 | 1 |
| 23 | San Juan del Río | - | - | - | 4, 50 | 0.897 | 2 |
| 31 | Las Lajas | - | - | - | 4 | 0.875 | 3 |
| 4 | Don Martín | - | 23, 31, 50, 83 | 50 | - | 0.839 | 4 |
| 85 | La Begoña | - | 31, 50, 83, 86 | 50 | 4, 50 | 0.838 | 5 |
| 86 | Río Soto La Marina | 4, 31, 85 | - | 50 | 4, 50 | 0.764 | 6 |
| 26 | Bajo Río San Juan | 4, 31, 85 | 31, 50, 83, 86 | 50 | 4 | 0.667 | 7 |
| 83 | Papigochic | 31, 50 | - | 50 | 4, 50 | 0.651 | 8 |
| 42 | Buenaventura | 31 | - | 31, 50 | 4, 50 | 0.627 | 9 |
| 97 | Lázaro Cárdenas | 4, 31, 85 | - | 50 | 4, 50 | 0.603 | 10 |
| 76 | Valle del Carrizo | 31, 50, 85 | - | 50 | 4 | 0.566 | 11 |
| 34 | Edo. de Zacatecas | 31, 50. | 31, 50, 83, 86 | 50 | 4, 50 | 0.454 | 12 |
Tobit regression analysis showed that Irrigated area (p = 0.010), Covered chanels (p = 0.001), Uncovered chanels (p = 0,001), Annual total production/irrigated area (p = 0.010), Value of production/irrigated area (p = 0.003), and Maintenance costs/Irrigated area (p = 0.002) were significant factors for the level of mean efficiency of the IDs that conform Cluster CS5 (Table 9).
Table 9 Tobit Regression of Cluster CS5.
| Factors | Coeficients | Standard Error | t | p > |t| | 95% CI | |
|---|---|---|---|---|---|---|
| IA | -3.82E-06 | 8.38E-07 | -4.55 | 0.010 | -6.14E-06 | -1.49E-06 |
| CCH | 0.006564 | 0.000769 | 8.53 | 0.001 | 0.004428 | 0.008700 |
| UCCH | 0.008143 | 0.000792 | 10.28 | 0.001 | 0.005944 | 0.010342 |
| TAP/IA | -0.020465 | 0.004496 | -4.55 | 0.010 | -0.03295 | -0.007982 |
| PV/IR | 0.016285 | 0.002595 | 6.28 | 0.003 | 0.009081 | 0.023490 |
| CM/AR | -0.371364 | 0.050175 | -7.40 | 0.002 | -0.510671 | -0.232056 |
| Constant | 0.152989 | 0.098403 | 1.55 | 0.195 | -0.120220 | 0.4261988 |
IA= Irrigated Area, CCH = Covered Chanels, UCCH = Uncovered Chanels, TAP/IA= Total Annual Production /Irrigated Area, PV/AR= Production Value/Irrigated Area, MC/IA= Maintenance Cost/Irrigated Area, CI = Confidence Interval
Benchmarking of Cluster CS6. This cluster showed a global mean efficiency e = 0.88, indicating an inappropriate use of resources. However, since no return to scale turned out to be predominant, it was not possible to establish general recommendations for this cluster in terms of use of resources and changes in return to scale (Table 10).
Table 10 Technical Efficiency and Return to Scale of IDs by System in Cluster CS6.
| ID Code | Name | Systems | |||||||
|---|---|---|---|---|---|---|---|---|---|
| Infrastructure | General Finances | General Production | Infrastructure | ||||||
| e | RtoS | e | RtoS | e | RtoS | e | RtoS | ||
| 52 | Estado de Durango | 1.00 | CNT | 1.00 | ICR | 1.00 | CNT | 1.00 | ICR |
| 108 | Elota-Piaxtla | 1.00 | CNT | 0.96 | ICR | 1.00 | CNT | 0.90 | ICR |
| 74 | Mocorito | 1.00 | CNT | 1.00 | CNT | 1.00 | ICR | 0.59 | ICR |
| 10 | Culiacán-Humaya | 1.00 | DEC | 0.79 | ICR | 1.00 | CNT | 0.62 | ICR |
| 109 | Río San Lorenzo | 0.41 | ICR | 1.00 | DEC | 1.00 | CNT | 1.00 | CNT |
| 75 | Río Fuerte | 0.43 | DEC | 1.00 | CNT | 0.82 | DEC | 0.71 | ICR |
| 63 | Guasave | 0.39 | DEC | 0.99 | ICR | 0.79 | ICR | 0.59 | ICR |
| Mean | 0.75 | 0.96 | 0.94 | 0.85 | |||||
| Global mean efficiency | 0.88 | ||||||||
e = efficiency, RtoS = Return to Scale, CNT = Constant, DEC = Decreasing, ICR = Increasing
In infrastructure, Cluster CS6 had a regular average efficiency (e = 0.75). Particularly, the IDs 52, 108, and 74 used all their resources efficiently. The IDs 109, 75, and 63 had excesive rehabilitation and technification costs asociated with low efficiency on water conduction. ID 10 was BCC efficient, but presented decreasing return to scale, therefore, it would have to look over its rehabilitation and technification activities, as well as, to review its water conduction practices.
The General Finances of this cluster presented a high average efficiency (e = 0.96). Collection from fees for water services were sufficient to cover management, operation, and maintenance activities. Only ID 10 was inefficient with an increasing return to scale. Consequently, it would have to reduce its management, operation, and conservation costs.
In General Production, the average group efficiency was high (e = 0.94) with a constant return to scale. The IDs 52, 108, 10, and 109 had optimal volume and value of production in relation to the volume of water received and the irrigated area. ID 75 was inefficient with decreasing return to scale. It would have to increase its volume and value of production by implementing better agricultural practices and introducing high value crops. ID 63 was inefficient with increasing return to scale and it has to reduce water distribution losses.
In the Environmental system the group had good average efficiency (e = 0.85) and heterogeneus return to scale. ID 109 was efficient, with no soil degradation effect on its crop production. ID 52 was efficient, but it may change its return to scale by improving soil quality through better agricultural practices (Table 10).
Comparatively, ID 52 is the most efficient and its practices may constitute reference criteria in Genaral Finances and Environmental for the 108, 10, 63, 52 , and 75. In Infrastructure, IDs 74 and 108 can be referents for IDs 109, 75, and 63. In General Production, ID 10 was a referent for IDs 75 and 63. In terms of general mean efficiency, ID 51 was the best evaluated (e = 1.0) and ID 63 was the worst evaluated (e = 0.69). It is possible to rank the IDs in Cluster CS6 in terms of mean efficiencies (Table 11).
According to the Tobit regression results, Soil Degradation Index was the only independent variable significantly (p - 0. 054) related with efficiency for this cluster (Table 12).
Table 11 Peer IDs for Cluster CS6 and Ranking.
| ID code | Name | Infrastructure | General Finances | General Production | Environmental | Mean efficiency | Ranking |
|---|---|---|---|---|---|---|---|
| 52 | Estado de Durango | - | - | - | - | 1.00 | 1 |
| 108 | Elota-Piaxtla | - | 52, 75 | - | 52, 109. | 0.96 | 2 |
| 74 | Mocorito | - | - | - | 52 | 0.90 | 3 |
| 10 | Culiacán-Humaya | - | 52, 74, 75 | - | 52 | 0.86 | 4 |
| 109 | Río San Lorenzo | 74, 108 | - | - | - | 0.85 | 5 |
| 75 | Río Fuerte | 74, 108 | - | 10, 108 | 52 | 0.74 | 6 |
| 63 | Guasave | 74, 108 | 52, 75 | 10, 109 | 52 | 0.69 | 7 |
Conclusions and recommendations
(1) Benchmarking, using DEA, was an appropriated strategy to assess the performance of Irrigation Districts in Mexico.
(2) Principal Components Analysis and Cluster Analysis allowed to obtain 6 homogeneous groups of Irrigation Districts in terms of systemic variables of infrastructure, volume and value of production, maintenance costs, soil degradation, and water supply and conduction.
(3) In general terms, Cluster CS5 had low global efficiency and decreasing return to scale, which indicates an inappropriated use of resources. The relevant factors for its global efficiency were its network of covered and uncovered chanels and the soil degradation index. The ID 50 was the best referent (benchmarker) for the IDs that conform the cluster.
(4) With respect to the efficiency analysis by systems, Cluster CS5 resulted heterogeneous. Some IDs were highly efficient in water distribution, while others showed large costs for maintenance and rehabilitation. In general, collection of fees for water services allowed for compensation of the costs from mangement, operation, and conservation activities. With the exception of ID 50, the IDs spent large amounts of water in relation to the volume and value of their crops, and their agricultural production was affected by an excessive soil degradation.
(5) Cluster CS6 had a general average efficiency that can be assessed as good. It only presented some efficiency problems at the Environmental and Infrastructure systems. The Soil Degradation Index was the factor that most impacted the overall efficiency of this cluster. According to overall efficiency of the group, ID 52 can be regarded as the referent (benchmarker) for the remaining IDs in the cluster.
(6) The Irrigation Districs 109, 75, and 63 in Cluster CS6 were inefficient on water conduction because of large rehabilitation and technification costs. All IDs resolved their management, operation, and conservation costs. The production volume and crop values were good in relation to the amounts of irrigation water received. With the exception of IDs 52 and 109, Soil Degradation significantly affected the agricutural production of the other IDs in this cluster.
(7) It is strongly suggested to continue the research on this topic by updating and incorporating more variables and performance indicators.
(8) One way to improve on the methodology implemented in this work is to incorporate panel data and other DMUs (e.g. Irrigation Modules), where other features of the irrigation systems can be introduced, such as: irrigation technologies, water measuring, water quality, and soil and drainage.
Acknowledgements
The authors kindly express our gratitude to CONAGUA staff for providing data used in this research.
REFERENCES
Ali, M. K. & Klein, K. K. (2014). Water Use Efficiency and Productivity of the Irrigation Districts in Southern Alberta. Water Resources Management, 28(10), 2751-2766. DOI:10.1007/s11269-014-0634-y. [ Links ]
Altamirano-Aguilar, A., Valdez-Torres, J. B., Valdez-Lafarga, C., León-Balderrama, J. I., Betancourt-Lozano, M., & Osuna-Enciso, T. (2017). Clasificación y evaluación de los distritos de riego en México con base en indicadores de desempeño. Tecnología y ciencias del agua, 8(4), 79-89. DOI: 10.24850/j-tyca-2017-04-05 [ Links ]
Banker, R. D., Cooper, W. W., Seiford, L. M., & Zhu, J. (2011). Returns to Scale in DEA. En Handbook on Data Envelopment Analysis (pp. 497) New York, USA: Springer [ Links ]
Borgia, C., García-Bolaños, M., Li, T., Gómez-Macpherson, H., Comas, J., Connor, D., & Mateos, L. (2013). Benchmarking for performance assessment of small and large irrigation schemes along the Senegal Valley in Mauritania. Agricultural Water Management, 121, 19-26. DOI: /10.1016/j.agwat.2013.01.002 [ Links ]
Burton, M. (2010). Irrigation management: principles and practices. Connecticut, USA: CABI. [ Links ]
Conagua. (2013). Programa Nacional Hídrico 2014-2018. Distrito Federal, México: Comisión Nacional del Agua. [ Links ]
Conagua, Comisión Nacional del Agua. (2014a). Estadísticas del Agua en México. Distrito Federal, México: Comisión Nacional del Agua . [ Links ]
Conagua, Comisión Nacional del Agua. (2014b). Resultados de los estados financieros 2013 de las ACU y SRL de los Distritos de Riego. Distrito Federal, México: Comisión Nacional del Agua . [ Links ]
Conagua, Comisión Nacional del Agua. (2015a). Estadísticas Agrícolas de los Distritos de Riego. Distrito Federal, México: Comisión Nacional del Agua .. [ Links ]
Conagua, Comisión Nacional del Agua. (2015b). Resultados finales de los estados financieros 2014 de las Asociaciones Civiles de Usuarios (ACU) y de las Sociedades de Responsabilidad Limitada (SRL) de los Distritos de Riego. Distrito Federal, México: Comisión Nacional del Agua . [ Links ]
Conagua, Comisión Nacional del Agua. (2016). Estadísticas del Agua en México. Distrito Federal, México: Comisión Nacional del Agua . [ Links ]
Cooper, W. W., Seiford, L. M., & Tone, K. (2007). Data Envelopment Analysis: A Comprehensive Text with Models, Applications, References, and DEA-Solver Software. New York, USA: Springer US. [ Links ]
Cornish, G. A. (2005). Performance bechmarking in the Irrigation and Drainage Sector: Experiences to date and conclusions. Reporte no . OD115. Recuperado de http://eprints.hrwallingford.co.uk/69/1/OD155. [ Links ]
Chambers, R. (1988). Managing canal irrigation: Practical analysis from South Asia. New Delhi, Bombay, Calcutta: Oxford and IBH Publishing Co Pvt Ltd. [ Links ]
Charnes, A., Cooper, W. W., & Rhodes, E. (1979). Measuring the Efficiency of Decision Making Units, short communication. European Journal of Operational Research, 3, 339-339. Recuperado de :http://dx.doi.org/10.1016/0377-2217(78)90138-8 [ Links ]
Chebil, A., Frija, A., & Abdelkafi, B. (2012). Irrigation water use efficiency in collective irrigated schemes of Tunisia: determinants and potential irrigation cost reduction. Agricultural Economics Review, 13(1), 39. [ Links ]
Gerdessen, J. C., & Pascucci, S. (2013). Data Envelopment Analysis of sustainability indicators of European agricultural systems at regional level. Agricultural Systems, 118, 78-90. DOI:/10.1016/j.agsy.2013.03.004 [ Links ]
Lilienfeld, A. & Asmild, M. (2007). Estimation of excess water use in irrigated agriculture: A Data Envelopment Analysis approach. Agricultural Water Management, 94(1-3), 73-82. DOI: /10.1016/j.agwat.2007.08.005 [ Links ]
Maddala, G. S. (1986). Limited-dependent and qualitative variables in econometrics. United Kindom: Cambridge University Press. [ Links ]
Malana, N. M. & Malano, H. M. (2006). Benchmarking productive efficiency of selected wheat areas in Pakistan and India using data envelopment analysis. Irrigation and Drainage, 55(4), 383-394. DOI:10.1002/ird.264 [ Links ]
Malano, H. M., & Burton, M. (2001). Guidelines for benchmarking performance in the irrigation and drainage sector. Roma: Food and Agriculture Organization (FAO). [ Links ]
Mejía, E., Palacios, E., Exebio, A. E., & Santos, A. L. (2002). Problemas operativos en el manejo del agua en distritos de riego. Terra, 20(2), 217-225. [ Links ]
Naceur, M., & Mongi, S. (2013). The technical efficiency of collective irrigation schemes in south-eastern of Tunisia. International Journal of Sustainable Development and World Policy, 2(7), 87-103. [ Links ]
Ntantos, P., & Karpouzos, D. (2010). Application of data envelopment analysis and performance indicators to irrigation systems in Thessaloniki Plain (Greece). Agricultural and Biosystems Engineering, 87(10), 7273. [ Links ]
Palacios, E., Exebio, A., Mejía, E., Santos, A. L., & Delgadillo, M. E. (2002). Problemas financieros de las asociaciones de usuarios y su efecto en la conservación y operación de distritos de riego. Terra, 20(4), 505-513. [ Links ]
Peinado-Guevara, V. M., Camacho-Castro, C., Bernal-Domínguez, D., Delgado-Rodríguez, O., & Peinado-Guevara, H. J. (2012). Programas de conservación de obras en distritos de riego como alternativa sustentable en la administración del agua de uso agrícola. Ra Ximhai, 8(2). [ Links ]
Ramanathan, R. (2003). An Introduction to Data Envelopment Analysis: A tool for performance measurement (First ed.). New Delhi: SAGE Publications. [ Links ]
Ríos, A. R. & Shively, G. E. (julio, 2005). Farm size and nonparametric efficiency measurements for coffee farms in Vietnam. American Agricultural Economics Association Annual Meeting. Reunión llevada a cabo en Providence, Rhode Island, United Estates of America. [ Links ]
Small, L. E. & Svendsen, M. (1990). A framework for assessing irrigation performance. Irrigation and drainage systems, 4(4), 283-312. [ Links ]
Subdirección General de Infraestructura Hidráulica. (2013). Resultados de los estados financieros 2012 de las ACU y SRL de los Distritos de Riego. Distrito Federal, México: Comisión Nacional del Agua . [ Links ]
Toma, E., Dobre, C., Dona, I., & Cofas, E. (2015). DEA Applicability in Assessment of Agriculture Efficiency on Areas with Similar Geographically Patterns. Agriculture and Agricultural Science Procedia, 6, 704-711. DOI:/10.1016/j.aaspro.2015.08.127 [ Links ]
Watkins, K. B., Hristovska, T., Mazzanti, R., Wilson Jr, C. E., & Schmidt, L. (2014). Measurement of technical, allocative, economic, and scale efficiency of rice production in Arkansas using data envelopment analysis. Journal of Agricultural and Applied Economics, 46(1), 89. [ Links ]
Watto, M. A., & Mugera, A. W. (2015). Efficiency of irrigation water application in sugarcane cultivation in Pakistan. Journal of the Science of Food and Agriculture, 95(9), 1860-1867. DOI:10.1002/jsfa.6887 [ Links ]
Zhu, J. (2010). Quantitative Models for Performance Evaluation and Benchmarking (vol. 213). London, United Kindom: Springer. [ Links ]
Received: June 16, 2017; Accepted: July 02, 2018
 Este es un artículo publicado en acceso abierto bajo una licencia
Creative Commons
Este es un artículo publicado en acceso abierto bajo una licencia
Creative Commons
