


Servicios Personalizados
Revista
Articulo
 texto en
  Inglés (pdf)
 Artículo en XML
 Referencias del artículo
 Enviar artículo por email
Indicadores
-
 Citado por SciELO
 -
 Accesos
Links relacionados
-
 Similares en
SciELO
Similares en
SciELO
Compartir

 Permalink
Tecnología y ciencias del agua
versión On-line ISSN 2007-2422
Tecnol. cienc. agua vol.9 no.5 Jiutepec sep./oct. 2018 Epub 24-Nov-2020
https://doi.org/10.24850/j-tyca-2018-05-09
Articles
Economic Value of the Water in the Manufacturing Industry in the San Juan River hydrological sub-region, Mexico
1Conacyt-UAM, Área de Crecimiento y Medio Ambiente/Departamento de Economía, Universidad Autónoma Metropolitana, Unidad Azcapotzalco, Ciudad de México, México, darevollof@conacyt.mx
2Departamento de Economía, Universidad Autónoma Metropolitana, Unidad Azcapotzalco, Ciudad de México, México, lrt@correo.azc.uam.mx
3Departamento de Economía, Universidad Autónoma Metropolitana, Unidad Azcapotzalco, Ciudad de México, México, jamn8647@gmail.com
Water is one of the largest consumables in the production process, especially in the manufacturing industry, but at the same time, this resource may pose scarcity problems mainly due to the lack of knowledge about its value. In most emerging countries, the monetary value of the water used in the production process does not necessarily reflect its scarcity, or the catchment and treatment costs, thus the cost of water is not properly charged. This work aims to calculate the economic value of water in the manufacturing industry in the San Juan River hydrological subregion (HSRSJ), a river basin with scarcity issues and with a high socio-economic importance It bases its analysis on the concept of elasticity in production with respect to consumable water (ε W ) and the value of the marginal product (ρ W ). To do so, we used information related to roughly 18 000 economic units surveyed in 2013, and two types of production functions: Cobb-Douglas and Trans-Logarithmic. We estimated that ε W and ρ W were equal to 0.046 and USD 13.0/m3 respectively. The ρ W ranged between USD 0.9/m3 for the computer equipment industry to USD 15.4/m3 for the chemicals industry, which indicates that ρ W varied according to the industry. The results have important implications for different areas of industrial water management, especially in river basins or water regions where the resource poses scarcity issues and at the same time those are regions of high socio-economic importance.
Keywords Economic value; water; manufacturing industry; scarcity
El agua es uno de los insumos más importantes en el proceso de producción, sobre todo para el sector manufacturero. Pero al mismo tiempo, dicho recurso puede presentar problemas de escasez debido al desconocimiento sobre su valor. En la mayoría de países emergentes, el valor monetario que tiene dicho recurso en el proceso productivo no necesariamente refleja su escasez, así como tampoco los costos de captación y tratamiento, por lo que no se paga el costo real del agua. Este trabajo tiene como objetivo estimar el valor económico del agua en la industria manufacturera de la Subregión Hidrológica Río San Juan (SHRSJ), cuenca hídrica con problemas de escasez y de alta importancia socioeconómica, recurriendo al concepto de elasticidad de la producción con respecto al insumo agua (ε W ) y al valor del producto marginal (ρ W ). Para ello se revisó información de casi 18 mil unidades económicas encuestadas en 2013 y se consideraron dos tipos de funciones de producción: Cobb-Douglas y Trans-Logarítmicas. Se estimó que la ε W y el ρ W son iguales a 0.046 y USD 13.0/m3, respectivamente. El ρ W osciló entre USD 0.9/m3 para el sector de equipo de computación a USD 15.4/m3 para el sector de productos químicos, lo que indica que el ρ W varía según los sectores. Los resultados tienen importantes implicaciones para diversas áreas de la gestión del agua industrial, especialmente en aquellas cuencas o regiones hídricas donde dicho recurso presenta problemas de escasez y, al mismo tiempo, son regiones de alta importancia socioeconómica.
Palabras clave valor económico; agua; industria manufacturera; escasez
Introduction
Although the offer of water in absolute terms is considered abundant, Mexico is facing a serious problem with relative scarcity (Conagua, 2012a). This problem reflects the inability to supply water in some basins of the country, especially those where the population has been growing over the years.
The San Juan River hydrological sub-region (HSRSJ) occupies less than 3.3% of the national territory. However, approximately 6.2% of the total population of the country lives there, generating approx. 9.3% of the country’s gross domestic product (GDP). At an international level, the degree of water stress can be measured with the Water Stress Index. This index is defined as the relationship between water use and average natural water availability, where values above 40% show serious water stress. In case of HSRSJ, it shows a value equal to 77.1%, which places it among the regions in Mexico with a higher level of stress on its water resources (Conagua, 2016). In the case of serious water stress, it is essential to pass policies aimed at making the different uses of water efficient in the regions and subregions. Currently, the main sectors consuming water in HSRSJ are, in order of importance, the urban public and domestic sectors, farming and industrial (Aguilar-Benitez, 2017).
The manufacturing industry is particularly important to the dynamics of the economic activity in the HSRSJ, accounting for two-fifths of its GDP. It generates jobs and goods and services for consumption by the region’s population and exports outside the hydrological subregion and the country (Conagua, 2012b). Water is an essential resource for the production processes used by the industries located in the basin. In 2015 alone, approximately 99 million m3 was used for production. This volume represents 7.7% of the water that industry uses in the country (Conagua, 2016). For its production process, the manufacturing industry extracts approximately 56% of water from underground sources (aquifers), which are currently overexploited and are therefore declared as closed, having registered zero water availability, causing irreversible damage to the aquifers. The industry supplements its water needs from the public urban supply, which also mainly receives water from the subsoil, with the same adverse impact on the same water bodies (Aguilar-Benitez, 2017). This overexploitation of aquifers, both the one generated by the manufacturing industry as well as other economic industries, has the same harmful effects on society, such as springs depletion, disappearance of lakes and wetlands, elimination of native vegetation and loss of ecosystems, reduction of well performance, increase in extraction costs, land settling and cracking, among others.
However, like most emerging or developing countries or regions, the monetary value of using this natural resource in the production process does not necessarily reflect its scarcity, as well as the catchment and treatment costs it requires. Thus, the cost of water is not properly charged, which lowers awareness of its inefficient use, waste, or pollution (Dupont & Renzetti, 2001). Likewise, in general, the State has regulated the price of water in most cities in the country. Thus, the importance of the value of industrial water has been overlooked.
Water usage in the manufacturing industry adds value to the end product or service, and this added value is the value of the water that is used in the process, which reflects the effective payment by consumers for resource usage. The purpose of this article is to calculate the additional monetary value of the end product by adding an additional square meter of water to the products that are manufactured (marginal value of water) in the HSRSJ. This is done by identifying the industries that add more or less value to the resource. Likewise, knowing the economic value of water (EVW) allows for proper and efficient management of water (Dupont & Renzetti, 2001). First, it offers technically-based tools to decision-makers on matters of water for making future investments, taking into account that cities and countries continue investing in water resources, which is one of the main components in the public infrastructure budget. Secondly, economic assessment is important since it enables determining whether or not the society (in this case the companies) is in favor of water supply projects. Lastly, EVW is useful to assess the design and implementation of public policy, not necessarily in terms of investment in construction but rather more efficient water management.
There is relatively little international literature about EVW calculations for developing or emerging countries with problems of scarcity, and it is mainly focused on farming and household sectors. Within this context, this article intends to fill the gap by calculating this value for the manufacturing industry in HSRSJ, a sub-region undergoing relative water stress and constant socio-economic development.
The article’s structure, in addition to the introduction, includes six sections. The next section presents a literature review, followed by a section providing information about the study site. After this section, the methodology and results obtained are presented. Finally, in section six, the conclusions and recommendations are given.
Literature review
A series of combined resources or consumables is required for the production process of goods and services that are provided for the economy, such as equipment, labor, management, capital, space, natural resources, among others contributing to the total production value (Ku & Yoo, 2012). In the case of the industrial manufacturing sector, the value this sector is giving to water resource is classified as direct use value, and is assessed according to the market price to which the industry has access (Marcouiller & Coggins, 1999). However, the price of the products on the market, in this case water, does not necessarily reflect their true value. In economic theory, there are three approaches for studying and calculating this production value (Ku & Yoo, 2012): 1) determining water demand; 2) studying cost structure; and 3) investigating the production structure.
In the first approach, calculating water demand consists of direct statistical regressions, trying to study the relationship of the amount of the resource consumed as a dependent variable, and independent from water price, production, work, and other socio-environmental variables (Rees, 1969; Oh, 1973; De-Rooy, 1974; William, 1986). However, the theory establishes that this approach generates a bias in terms of the amount of water consumed on both sides of regression, generating inconsistent and relatively questionable results (Hussaina, Thrikawalaa, & Barkera, 2002).
To try to solve this obstacle, more recent research uses the same methodology, but taking different functional forms of models (Malla & Gopalakrishnan, 1999; Onjala, 2001; Hussaina et al., 2002).
The second approach -cost structure- relates the total costs of the activity as a dependent variable and the prices of different production factors, such as water, labor, among others, and production as regressors (Bruneau, Renzetti, & Villeneuve, 2010; Féres, Reynaud, & Thomas, 2012).
Finally, the third approach uses a production function, which relates the production value as a dependent variable and the monetary value or physical amounts of different production factors (Wang & Lall, 2002; Ku & Yoo, 2012).
With regard to the latter approach, the methodology makes it possible to obtain the marginal productivity per production factor, corresponding to the implicit market price of the resource, being a greater contribution than the first two approaches. This situation is recommendable for study cases in which consumable prices do not necessarily reflect the true value, for example, as a result of setting public policies or market policies that benefit economic units, such as subsidiaries.
In the economic literature, the first two approaches are widely used. However, these approaches need establishing a water market, which translates into setting an appropriate fee structure and correctly implementing it, with data needed on costs and the marginal prices of consumables (De-Gispert, 2004). Nevertheless, mean prices are used as a proxy for marginal prices. And as mentioned by Dupont and Renzetti (2001), this translates into a deliberate bias, since perfect competition is when firms optimize marginal prices. On the other hand, a water market for industries depends on the available water source. Thus, for example, when this source is self-supplied, there is little or no external cost, whereas when it is supplied by the public network, the companies face an increasing block pricing structure (Renzetti & Dupont, 2002).
Now, if market simplification is not possible, that is, mean prices cannot be used and the fee structure is unknown, or there is a fee structure but it is not properly implemented, the marginal productivity approach may be used to assess the marginal value of industrial water, since it does not need consumable prices. Accordingly, this research is based on this third approach.
There is less research on EVW for industrial use worldwide than for farming and household use. And this is almost inexistent on the national level. This is mainly because consumable prices, such as water used in the industry, in general, include subsidies and pricing policies do not totally reflect market prices.
In the studies where the third approach is used, Wang and Lall (2002) calculate the marginal value of water for a sample of approximately 2 000 companies in the industrial sector in China. They calculate a marginal value from USD 0.02/m3 for the electricity sector, up to a value of USD 11.5/m3 for transport equipment sector, with a national mean value equal to USD 1.1/m3 for the whole industry.
Meanwhile, Aylward, Seely, Hartwell y Dengel (2010) conducted a review of studies performed in different countries in Asia and North America, except Mexico, estimating that for the industrial sector the marginal productivity value of water presents a margin of USD 0.01/m3 to USD 6.94/m3.
Likewise, Ku and Yoo (2012) estimated the value of marginal productivity of water for the manufacturing industry in Korea, calculating a mean value for the whole industry equal to USD 3.7/m3, with the precision instruments industry having the lowest value and transport equipment industry the highest, USD 1.4/m3 and USD 44.3/m3 respectively.
Finally, Vargas (2015) calculated a marginal value equal to USD 30.9/m3 for the manufacturing industry in Chile, with a range between USD 11.8/m3 and USD 75.3/m3 for the textile and common metals sectors, respectively.
San Juan River Hydrological Sub-Region (HSRSJ)
HSRSJ Location
For administrative and preservation purposes of national waters, as of 1997, Mexico has been divided into 13 Hydrological-Administrative Regions (HAR). These HAR are comprised of groups of basins, considered the basic units for water resource management.
The borders of these HAR correspond to municipalities, in order to facilitate the generation of socioeconomic information.
The HSRSJ is part of the Bravo-Conchos Hydrological Region and the Rio Bravo Hydrological-Administrative Region (HAR Number 6) (Figure 1).

Figure 1 Hydrological Boundaries of the San Juan River Hydrological Sub-Region (HSRSJ). Source: Authors, 2017.
HSRSJ has an area of approximately 30 847.26 km2, covering municipalities in the states of Coahuila (4 municipalities), Nuevo Leon (37 municipalities), and Tamaulipas (8 municipalities). The main municipalities in this sub-region are Saltillo (in Coahuila), Monterrey, Guadalupe, and Apodaca (in Nuevo Leon), Reynosa and Matamoros (in Tamaulipas) due to its large economic activity and where the population is over 500 000 inhabitants.
HSRSJ is one of the most densely populated regions in Mexico, where around 7.2 million inhabitants are located (12.8% in Coahuila, 19.9% in Tamaulipas, and 67.3% in Nuevo Leon), with approximately 236 inhabitants per km2, being one of the densest at the national level. At the same time, it occupies less than 3.3% of the national territory and, however, approximately 6.2% of the total population in the country is there, generating approximately 9.3% of the national GDP.
Manufacturing industry in the HSRSJ
The manufacturing sector in the HSRSJ includes some 17 983 economic units (EU) representing 3.7% of the nation’s manufacturing sector, generating 17.1% of the product value of this sector nationally. It has roughly 700 000 workers that represent almost 25.1% of the population of the industrial sector in this subregion, and 13.6% of the national industrial sector. Accordingly, this region has high productivity in terms of the national situation.
The socio-economic importance and dynamism of manufacturing sector in the HSRSJ suggests the usefulness of an investigation of the impact of its water demand as a production consumable, given its location in a region characterized by absolute water scarcity.
The manufacturing sector uses water in its process, in the modality of consumptive use, and, therefore, the water exploited from the water body does not return to the same. The annual water volume demanded by the entire manufacturing sector is 99 hm3 for first-use water, most of which is extracted from wells located in the basin (56%), and secondly from surface sources (44%).
Table 1 shows the use of water by the industrial sector per industry in the sub-region, as well as the annual use of water for manufacturing, showing the intensity of each industry’s use of water resources and their importance in the economic activity within the region. Eight industries show high water intensity: i) electrical products, ii) metallic products, iii) computer equipment, iv) chemistry, v) transport equipment, vi) plastics and rubber, vii) food, viii) drinks and tobacco. These industries are grouped under the label of high-intensity industries since, together, they represent roughly 76% of the production value. Within the high-intensity industries, electrical appliances and metallic products stand out for with 33% of water use, while the beverages and tobacco industry consume 4.7% of the total water used by the manufacturing industry.
Table 1 The intensity of the manufacturing industry in using water resources in the San Juan River Hydrological Sub-Region (HSRSJ) Source: Authors, 2017.
| Classification of the industry | Use of water | Value of production | |
| Subsector | Subsector | % | % |
| 335 | Electric appliances | 20.83 | 7.95 |
| 332 | Metal products | 12.76 | 8.13 |
| 334 | Computer equipment | 11.63 | 1.68 |
| 325 | Chemistry | 10.62 | 8.40 |
| 336 | Transportation equipment | 10.04 | 30.05 |
| 326 | Plastic and rubber | 7.03 | 5.32 |
| 311 | Food | 5.75 | 7.90 |
| 312 | Drinks and tobacco | 4.70 | 4.62 |
| Group | High intensity | 83.36 | 74.05 |
| 327 | Non-metallic minerals | 4.17 | 3.68 |
| 322 | Paper | 2.19 | 2.74 |
| 331 | Basic metallic | 2.80 | 11.94 |
| 333 | Machinery and equipment | 2.55 | 5.45 |
| 339 | Other industries | 2.06 | 0.60 |
| 337 | Furniture | 1.82 | 0.63 |
| 323 | 0.57 | 0.36 | |
| 315 | Clothing | 0.32 | 0.25 |
| 321 | Wood | 0.09 | 0.19 |
| 314 | Textile products | 0.04 | 0.06 |
| 313 | Textile supplies | 0.02 | 0.03 |
| 316 | Leather | 0.01 | 0.02 |
| Group | Normal intensity | 16.6 | 26.0 |
| Sector | 100.0 | 100.0 | |
The other twelve industries in the sub-region do not put significant stress on the water resources, jointly they demand 16.6% of all water required annually by the manufacturing sector and produce a quarter of the production value of the sector. This result is found even while sectors are included such as non-metallic minerals, whose technology requires 4.2% of the total water of the industry.
The industries showing the greater intensity of water resources in HSRSJ should improve their efficiency in using water. Therefore they should make the necessary changes, including better technologies. This is possible to do if the marginal value of water used by the industry is high enough to generate the income implied by such adjustments. It also enables calculating the feasibility of internalizing the externalities being produced in the water bodies in the HSRSJ. This HSRSJ scenario is complimented by the marginal value of water in the industries that perform this work.
Methodology
Model
The Cobb-Douglas (CD) production function is generally used in the empirical analysis of factor markets and the production of goods and services. However, this function is limited, which have been developed and studied over time, and are mainly due to the additivity and homogeneity assumption. Accordingly, Christensen, Jorgenson and Lau (1973) proposed the Translog function (TL) to overcome these limitations and showed that this provides a broader range for transformation pattern substitution than the constant elasticity of substitution, such as the CD function (Wang & Lall, 2002).
As mentioned by Baumann et al. (1997), the CD function requires all consumables in the production function to be substitutes, and this limits the substitution degree by being a constant value and the same for all, widely known as the elasticity of unit substitution. This is opposite to what occurs with a TL production function. In this study, therefore, both production function types are used to compare results.
Cobb-Douglas Function Model (CD)
The production function for a good or service, where water is considered to be a consumable, can be represented as Q = f (K, L, W, M), where Q is the end production of the good or service analyzed, K is the capital used, L is the work used, W is the water used in production, and M is the other intermediate consumables in the production process. Therefore, the production function includes capital, work used, water, and materials such as consumables, and can be represented as:
Accordingly, production elasticity can be calculated through the partial derivative with respect to each factor considered. In the case of water, elasticity (ε CD-W ) is obtained as:
While the marginal value of water (ρ CD-W ) is calculated as:
Trans-Logarithmic Function Model (TL)
After taking logarithms on both sides of the CD production function and applying a second-order Taylor expansion, the TL function is presented as:
Where production elasticity with respect to the water consumable (εTL-W) is obtained as:
And the marginal value of water (ρ TL-W ) as:
Data
The data were obtained from the Industrial Economic census of the National Institute of Statistics and Geography (INEGI, in Spanish) through the Automated System of Census Information (SAIC, in Spanish). The Economic Census is applied to the economic units (EU) responsible for carrying out several industrial activities and collecting information such as wages and salaries, value, and volume of production, as well as machinery and equipment, among others.
The information was processed for the EU in the manufacturing sector (codes 31, 32, and 33) located in the municipalities in the HSRSJ (Coahuila de Zaragoza, Nuevo Leon, and Tamaulipas). The manufacturing EU for each municipality was added by subsector and approximately 1 010 observations were obtained per variable for the year 2014. The addition, because of the Law of Confidentiality by the National Institute of Statistics and Geography (INEGI), the information cannot be shown individually in order to avoid its usage for tax, judicial, or administrative purposes, and so there are industries with little information at the municipal level. In total, information from approximately 17 983 EU was collected, which are distributed among economic sectors, in 49 municipalities located in the HSRSJ.
The variables used to calculate the production function are: a) value of manufactured products (Q), quantifying the monetary value of all goods and services produced or marketed by the EU as a result of exercising its activities; b) total staff (L), comprising all persons that had worked during the reference period subject to its direction and control; c) raw materials and materials integrated to production (M), is the monetary value of the acquisition cost, in the national or foreign market, of raw and secondary materials consumed in the production processes; d) water used in production (m3) (W) based on the information of monetary cost of water reported in the census, and it was divided by the corresponding price per m3 of water consumption; and e) total fixed assets (K,) the current value of all goods and property belonging to the EU having the capacity to produce or provide the necessary conditions for the generation of goods and services.
For calculation of the function, a database of the respective variables (Q, L, M, W, and K) was built for the different sectors (codes 31, 32, and 33) at the municipal level. Inside the manufacturing industry, subsectors included (Table 2): a) food (Code 311), b) beverages and tobacco (Code 312), c) manufacturing of textile consumables and textile finishing (Code 313), d) manufacturing of textile products except clothing (Code 314), e) manufacturing of clothing (Code 315), f) tanning and leather finishing and manufacturing of leather products and substitute materials (Code 316), g) wood industry (Code 321), h) paper industry (Code 322), i) printing of connected industries (Code 323), j) manufacturing of oil and coal byproducts (Code 324), k) chemical industry (Code 325), l) plastic and rubber industry (Code 326), m) manufacturing of non-metallic mineral-based products (Code 327), n) basic metallic industries (Code 331), o) manufacturing of metallic products (Code 332), p) manufacturing of machinery and equipment (Code 333), q) manufacturing of computer equipment, communication, measurement, and other component equipment and electronic parts (Code 334), r) manufacturing of electric appliances parts and power generation equipment (Code 335), s) manufacturing of transport equipment (Code 336), t) manufacturing of mattress furniture and blinds (Code 337), and u) other industries (Code 339).
Table 2 Industrial classification per-subsector of the manufacturing industry Source: Authors, 2017.
| Subsector | Code | Description |
|---|---|---|
| Food | 311 | EU dedicated mainly to the preparation, conservation and packaging of food products for human consumption and food |
| Drinks and tobacco | 312 | EU dedicated mainly to the elaboration of alcoholic and non-alcoholic beverages, tobacco and the elaboration of tobacco products, including the purification of water where the customers’ jugs are filled directly |
| Textile supplies | 313 | EU dedicated mainly to the preparation and spinning of natural textile fibers, to the manufacture of yarns and fabrics, and to the finishing and coating of textiles |
| Textile products | 314 | EU mainly engaged in the manufacture of carpets, rugs and mats from purchased yarn, to the manufacture (cutting and sewing) of curtains, blankets and similar from purchased fabric, and other textile products |
| Clothing | 315 | EU mainly engaged in the manufacture of knitted garments, and the making of garments and clothing accessories |
| Leather | 316 | EU mainly engaged in tanning and finishing of leather and leather, in the manufacture of footwear and leather products, leather and substitute materials, such as handbags, suitcases and the like, and other leather and leather products |
| Wood | 321 | EU dedicated mainly to the manufacture of various wood products in integrated sawmills, to sawing (cutting) boards and planks from round wood, to the impregnation and treatment of wood |
| Paper | 322 | EU mainly engaged in the manufacture of pulp (wood and recycled materials), paper, cardboard and paper and cardboard products |
| 323 | EU dedicated mainly to printing and other printed material, to the printing of continuous forms and to activities for the printing industry, such as bookbinding and the production of plates, cliches, engravings and other similar products | |
| Computer equipment | 324 | EU mainly engaged in the refining of crude oil, the manufacture of asphalt products, lubricating oils and greases, and other products derived from refined petroleum and mineral coal |
| Chemistry | 325 | EU dedicated mainly to the manufacture of basic chemicals, synthetic resins and rubbers, chemical fibers, fertilizers, pesticides and other agrochemicals, pharmaceuticals, paints, coatings and adhesives, soaps, cleansers and toilet preparations, printing inks, explosives and other chemical products |
| Plastic and rubber | 326 | EU mainly engaged in the manufacture of plastic and rubber products |
| Non-metallic minerals | 327 | EU dedicated mainly to the manufacture of products based on clays and refractory minerals, glass and glass products, cement and concrete products, limestone, gypsum and gypsum products, and other products based on non-metallic minerals |
| Basic metallic | 331 | EU mainly engaged in the primary casting of raw iron, the manufacture of steel and iron and steel products, the smelting, tuning, refining and rolling of non-ferrous metals and the molding by casting of metal parts |
| Metal products | 332 | EU mainly engaged in the manufacture of forged and die-cut products from purchased metal, metal hand tools without motor and metal cooking utensils, metal parts and structures and steel for construction and blacksmith products, industrial boilers, tanks and metal containers , fittings and locks, wire, wire products and springs to the machining done on request of new and used metal parts for machinery and equipment in general, to the manufacture of screws, nuts, rivets and similar, the coating of metal parts and other finished metallic |
| Machinery and equipment | 333 | EU dedicated mainly to the manufacture of machinery and equipment for agricultural activities, construction, extractive industry, for manufacturing industries, trade and services, air conditioning equipment, heating, and industrial and commercial refrigeration, engines of internal combustion, turbines and transmissions, and of other machinery and equipment for industry in general |
| Computer equipment | 334 | EU mainly engaged in the manufacture of computers and peripheral equipment, communication equipment, audio and video equipment, electronic components, measuring instruments, control, navigation, electronic medical equipment and the manufacture and mass reproduction of magnetic and optical media |
| Electric appliances | 335 | EU mainly engaged in the manufacture of lighting fixtures, household electrical appliances, electric power generation and distribution equipment and other electrical equipment and accessories |
| Transportation equipment | 336 | EU mainly engaged in the manufacture of transport equipment, such as cars, trucks and trucks, bodies and trailers, parts for motor vehicles, aerospace equipment, railway equipment, boats and other transport equipment |
| Furniture | 337 | EU mainly engaged in the manufacture of furniture, mattresses, blinds and curtains, includes manufacture of scrapers and blackboards, urethane foam mattresses and water mattresses |
| Other industries | 339 | EU mainly engaged in the manufacture of non-electronic equipment and apparatus for medical, dental and laboratory use, disposable medical and ophthalmic equipment and other manufactures not elsewhere classified |
Results
Estimation of Elasticities (ε) and the Marginal Value of Water (ρ)
The results of the estimation of the models for the entire manufacturing industry in the HSRSJ are shown in the following table. A total of 80% of variables in the Cobb-Douglas (CD) function are statistically significant from an individual point of view; while this value is 60% for the Trans-Logarithmic (TL) function in both models, with the majority of variables having a 99% significance level. The statistical adjustment (R 2 ) in CD function was 90%, indicating that 90% of the total variation in the dependent variable is explained by the set of independent variables. In case of the TL function, the adjustment was 91%. Additionally, the value from the Fisher test (Prob > F), in both models, rejects the null hypothesis that all coefficients are simultaneously equal to zero (Table 3).
Table 3 Results of the Estimation of Econometric Models. Source: Authors, based on the 2014 Economic Census by the National Institute of Statistics and Geography (INEGI), 2017.
| Variable | Cobb-Douglas (CD) | Trans-Log (TL) | ||||
| Estimated | Significance | Estimated | Significance | |||
| lnL | 0.012 | 0.614 | -0.446 | 0.023 | * | |
| lnW | 0.037 | 0.007 | *** | 0.166 | 0.185 | |
| lnM | 0.862 | 0.000 | *** | 0.872 | 0.000 | *** |
| lnK | 0.072 | 0.000 | *** | 0.172 | 0.321 | |
| lnL*lnW | -0.011 | 0.570 | ||||
| lnL*lnM | 0.092 | 0.000 | *** | |||
| lnL*lnK | -0.023 | 0.276 | ||||
| lnW*lnM | -0.044 | 0.000 | *** | |||
| lnW*lnK | 0.039 | 0.003 | *** | |||
| lnM*lnK | -0.040 | 0.004 | *** | |||
| (lnL) 2 | -0.055 | 0.004 | *** | |||
| (lnW) 2 | 0.001 | 0.869 | ||||
| (lnM) 2 | 0.017 | 0.003 | *** | |||
| (lnK) 2 | 0.009 | 0.366 | ||||
| A | 1.425 | 0.000 | *** | 1.195 | 0.214 | |
| N° Obs. | 354 | 354 | ||||
| Prob > F | 0.00 | 0.00 | ||||
| R 2 | 0.90 | 0.91 | ||||
Statistical significance: * = 10%, ** = 5% and *** = 1%
The CD function found a water elasticity (εCD-W) in all manufacturing industry of 0.037, and a marginal value of water (ρCD-W) of USD 10.5 per m3 consumed and added to the production process.
For the TL function, the elasticity of the product with respect to water consumption for the entire manufacturing industry (εTL-W) was equal to 0.046, and ρTL-W was equal to USD 13.0 per m3. This was slightly higher than the findings from the CD function (Table 3). However, and as mentioned above, the literature reports a preference for the TL function over the CD because the latter is more restrictive than the TL function, which is a more general form of the production function (Table 4).
Table 4 Elasticity (εW) and the marginal value of the product with respect to water use (ρW) in the manufacturing sector Source: Authors, based on the Economic Census 2014 of the National Institute of Statistics and Geography (INEGI), 2017.
| Sectors | Code | Cobb-Douglas (CD) | Translog (TL) | ||
|---|---|---|---|---|---|
| εCD-W (%) | ρCD-W (USD/m 3 ) | εTL-W (%) | ρTL-W (USD/m 3 ) | ||
| All manufacturing industries | 31, 32 y 33 | 0.037 | 10.5 | 0.046 | 13.0 |
| Food | 311 | 0.027 | 9.7 | 0.024 | 9.1 |
| Drinks and tobacco | 312 | 0.071 | 14.1 | 0.068 | 13.1 |
| Clothing | 315 | 0.029 | 3.9 | 0.026 | 3.7 |
| Leather | 316 | 0.056 | 18.9 | 0.038 | 12.8 |
| Paper | 322 | 0.061 | 14.4 | 0.053 | 12.8 |
| Chemistry | 325 | 0.073 | 8.8 | 0.099 | 13.4 |
| Non-metallic minerals | 327 | 0.021 | 7.3 | 0.028 | 10.1 |
| Metal products | 332 | 0.009 | 1.3 | 0.053 | 7.3 |
| Machinery and equipment | 333 | 0.024 | 14.2 | 0.066 | 11.2 |
| Computer equipment | 334 | 0.024 | 0.4 | 0.047 | 0.9 |
| Transportation equipment | 336 | 0.082 | 15.9 | 0.075 | 15.4 |
| Furniture | 337 | 0.013 | 5.8 | 0.028 | 9.6 |
| Other industries | 339 | 0.083 | 11.1 | 0.073 | 8.5 |
Likewise, Table 4 shows the results of the different sectors comprising the manufacturing industry in HSRSJ, both for CD and TL.
The estimation of product elasticity with respect to water consumption ranges from 0.024 for the food sector, up to a value equal to 0.099 for chemical products sector. Meanwhile, the marginal value of water ranges from USD 0.9 per m3 for the computer equipment, communication, and blinds sector, up to USD 15.4 for the transport equipment sector.
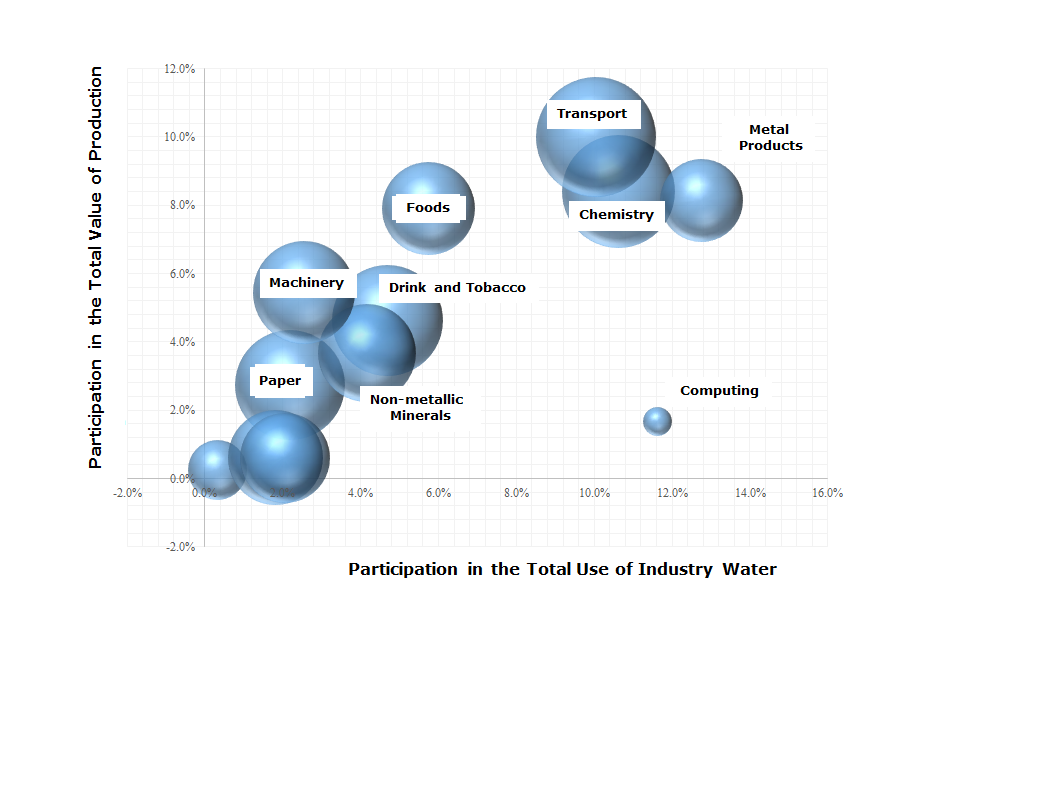
When comparing the marginal value of water (ρW) to the percentage of the total value of production and total water use used in the production process, the most efficient sectors are transport, chemicals, and food (Figure 2).
Conclusions and recommendations
Despite the importance of the industrial use of water and the aspects that distinguish it from other types of use, the studies on the role of water in the industry are still very few. This is especially true for developing or emerging countries (Renzetti, 2002). In the case of the San Juan River Hydrological Sub-Region (HSRSJ), the results from modeling the behavior of water used in the manufacturing industry confirm that there is sensitivity to economic variables. Specifically, it was estimated that the marginal value of water was equal to USD 13.0 per m3 used in the production process. At an international level, estimations of the same indicator are between USD 0.01 /m3 to USD 7.00 /m3 for countries in Asia and North America (excluding Mexico) (Aylward et al., 2010), while in case of Chile, an average value of USD 30.9 m3 (Vargas, 2015) was found for the manufacturing industry.
The value found in this research, although it is above average estimations at international level, can be explained mainly by the low costs related to the water used by the Economic Units in the country, and in this case the zone of study, which are below the prices of the water purchased by the EU in other countries.
The costs that EU should spend in the country, not only the manufacturing industry but all industry as a whole, are set by the “Federal Law of Fees - Applicable Provisions in Matters of National Waters 2016.” Those costs depend on the Availability Zone of the natural resource and whether that water comes from surface sources or subsoil.
The Availability Zone and underground water are classified by four Zones taking into account the Availability Index (Idas) which is calculated as Idas = Dma / (R - Dnc), where Dma is the annual mean availability of underground water in a hydro-geologic unit, R is the total annual mean recharge, and Dnc is the natural allocated discharge.
Based on this, Availability Zone 1 shows Idas lesser than or equal to -0.1 and therefore USD 1.12 /m3 should be spent in this zone. For Availability Zone 2, the Idas is greater than -0.1 and less than or equal to 0.1 and therefore USD 0.44 /m3 should be spent. For Availability Zone 3, the Idas is greater than 0.1 and less than or equal to 0.8 and therefore USD 0.14 /m3 should be spent. Finally, for Availability Zone 4, the Idas is greater than 0.8 and USD 0.10 /m3 should be spent.
In the case of HSRSJ, which belongs to Zone 1, the EU spent USD 1.12 /m3 on average, while, on average in the countries in the Organization for Economic Cooperation and Development (OECD) USD 1.38 /m3 (Walsh, Cusack, & O´Sullivan, 2016) was spent. That is, a value below 21%, approximately.
The manufacturing industry uses water as a consumable for a variety of products; therefore, this resource is one of the most important consumables in the production process. Additionally, a steady water source is very important for manufacturing companies since it helps to avoid problems related to scarcity, and mainly to generate added value to its product. However, little research has been performed to analyze water in this industry and its added value in developing or emerging countries such as Mexico, or in this case in the HSRSJ.
In Mexico, the price of water is generally regulated by the State. Thus the importance of water and its added value in the end goods has not been considered in terms of the current dimensions.
This research estimated product elasticity (εW) and marginal value of water (ρW) for the manufacturing industrial sector located in the San Juan River Hydrological Sub-Region (HSRSJ) using information from nearly 18 000 economic units (EU), grouped at a municipal level through estimation of econometric models using the Cobb-Douglas (CD) and Trans-Logarithmic (TL) functions.
Product elasticity with respect to water for the manufacturing industry as a whole and the marginal value of water in the HSRSJ were estimated as 0.046 and USD 13.0 per m3 used in the production process, respectively. Estimated ρW ranged between USD 0.9 per m3 for the computer equipment sector up to USD 15.4 for the transport equipment sector, reflecting that this varies according to the analyzed sector.
From a public-policy point of view, the information found in this kind of research may serve to identify and quantify the monetary value of the public investment needed to offer water resources for the manufacturing sector or any subsector thereof. That is, the monetary benefit of water supply to the industry can be calculated as a result of a new project to provide this resource. For example, in case of the HSRSJ, on average each new m3 of water allocated to the manufacturing industry sector coming from new investment in the resource provision would result in an additional economic benefit of approximately USD 13.0 in the production process. Here, it is important that the cost per m3 of water incurred by the State or the company providing water service is lower than that amount, with the idea that such investment is feasible and cost-effective.
Likewise, the EU located in the HSRSJ spent an average of USD 1.01 per m3 used in the production process. Therefore, the State has a certain margin for considering an adjustment to the fees charged for water used for production processes, especially in basins showing water scarcity problems. This result makes it possible to reflect on the maneuvering room that the State has to increase prices for water supplied to the industry, including in this the costs related to damages to overexploited aquifers. This price modification will improve the use efficiency and resource location, increase State income and improve the government’s knowledge of water use.
In situations of water stress, as evidenced in HSRSJ, use efficiency shall be considered, for example, from the point of view of the added value offered by each subsector of the manufacturing sector in the production per m3 used in the process. For example, one m3 used in the food sector generates approximately USD 9.1 /m3 added value; while using the same m3 for chemicals generates USD 13.4; that is, 1.5 times more value. However, it is important to mention that this added value is completely from an economic point of view and does not consider effects for third parties, such as negative externalities, which may be several and to different degrees, depending on the subsector being analyzed and the economic agents involved. Accordingly, although the values found by estimating the marginal value of water in subsectors may be a useful tool for decision-making related to reallocating water use, especially when concerning water scarcity problems, it is necessary to complement this with studies on socio-economic assessments of the impact on environmental goods and services.
The information found by this research provides reasonable technical criteria for decision-making on water allocation and efficient water use. For example, in river basins with water scarcity problems this kind of analysis may serve to determine which subsectors, within the same manufacturing industry or other sectors (household, farming, among others) should have a certain degree of preference in terms of access to water, accompanying these studies with social and environmental considerations.
Likewise, these types of findings should make the society, authorities, and particularly the users of this natural resource become aware of considering the value they hold of water, scarcity, and the need of water, since it is considered an important resource in all production processes.
Therefore, we expect that estimations by these kinds of studies are useful enough to design future fee policies and water management policies by governments or administrations in charge of this scarce natural resource. It is also necessary to advance knowledge of industrial water use and generate instruments that help to achieve the rational management of water, in order to obtain better and greater benefits for society.
Finally, as a recommendation for future studies, environmental and social variables factors should be included in the specification of production functions (Cobb-Douglas and/or Trans-Logarithmic), such as: rainfall, recharge of aquifers from which companies exploit water, degree of exploitation of different aquifers, rigidity of consumables markets, labor strikes, among others.
Although these variables are not considered to be a direct consumable of the production process, they are variables that may be external to the process but that may have a certain degree of impact.
Furthermore, the findings by this kind of work may serve to measure how the production process economically impacts third parties, known in economics as negative externalities.
Acknowledgements
These articles were prepared with financial support by the National Council of Science and Technology (CONACYT), by its acronym in Spanish) within the project framework “Towards a Comprehensive Management of Water by Hydrological Basin: An Availability and Use Analysis, National Problems Fund” (“Hacia una Gestión Integral del Agua por Cuenca Hidrográfica: un Análisis de Disponibilidad y Usos, Fondo Problemas Nacionales”) (Project No. 120-2015) and with support of CONACYT Lecture Programs.
REFERENCES
Aguilar-Benitez, I. (2017). Uso urbano del agua en el contexto de sus subregiones hidrológicas: Bajo Grijalva, Valle de México y San Juan. Cuencas de México, 8, 3-9. [ Links ]
Aylward, B., Seely, H., Hartwell, R., & Dengel, J. (2010). The economic value of water for agricultural, domestic and industrial uses: A global compilation of economic studies and market prices. Rome, Italy: Food and Agriculture Organization of the United Nations (FAO). [ Links ]
Baumann, D. D., Boland, J. J., & Hanemann, W. M. (1997). Urban Water Demand Management and Planning. USA: McGraw-Hill, Inc. [ Links ]
Bruneau, J., Renzetti, S. J., & Villeneuve, M. (2010). Manufacturing firms’ demand for water recirculation. Canadian Journal of Agricultural Economics, 58(4), 515-530. [ Links ]
Christensen, L., Jorgenson, D., & Lau, L. (1973). Transcendental logarithmic production function frontiers. The Review of Economics and Statistics, 55, 29-45. [ Links ]
Conagua, Comisión Nacional del Agua. (2012a). Programa Hídrico Regional, Región Hidrológico-Administrativa XIII Aguas del Valle de México. México, DF, México: Comisión Nacional del Agua. [ Links ]
Conagua, Comisión Nacional del Agua. (2012b). Programa Hídrico Regional, Región Hidrológico-Administrativa VI Río Bravo, México. México, DF, México: Comisión Nacional del Agua . [ Links ]
Conagua, Comisión Nacional del Agua. (2016). Estadísticas del agua en México. Ciudad de México, México: Comisión Nacional del Agua. [ Links ]
De-Gispert, C. (2004). The economic analysis of industrial water demand: A review. Environment and Planning C: Politics and Space, 22(1), 15-30. [ Links ]
De-Rooy, J. (1974). Price responsiveness of the industrial demand for water. Water Resources Research, 10(3), 403-406. [ Links ]
Dupont, D. P., & Renzetti, S. J. (2001). The role of water in manufacturing. Environmental and Resource Economics, 18(4), 411-432. [ Links ]
Féres, J., Reynaud, A., & Thomas, A. (2012). Water reuse in Brazilian manufacturing firms. Applied Economics, 44(11), 1417-1427. [ Links ]
Féres, J., & Reynaud, A. (2003). Industrial water use, cost structure and environmental policy in Brazil. Recuperado de http://www2.toulouse.inra.fr/lerna/cahiers2003/0308114.pdf [ Links ]
Grebenstein, C. R., & Field, B. C. (1979). Substituting for water inputs in U.S. manufacturing. Water Resources Research, 15(2), 228-232. [ Links ]
Hussaina, I., Thrikawalaa, S., & Barkera, R. (2002). Economic analysis of residential, commercial, and industrial uses of water in Sri Lanka. Water International, 27(2), 183-193. [ Links ]
Ku, S. J., & Yoo, S. H. (2012). Economic value of water in the Korean manufacturing industry. Water Resource Management, 26, 81-88. Recuperado de https://link.springer.com/article/10.1007/s11269-011-9905-z [ Links ]
Malla, P. B., & Gopalakrishnan, C. (1999). The economics of urban water demand: The case of industrial and commercial water use in Hawaii. Water Resources Development, 15(3), 367-374. [ Links ]
Marcouiller, D., & Coggins, S. (1999). The economic value of water: An introduction. Water Issues in Wisconsin, G3698. Recuperado de https://fred.ifas.ufl.edu/pdf/conservation-webinars/Wisconsin-G3698_1.pdf [ Links ]
Oh, H. S. (1973). Economics of urban water demand: A case study of the Honolulu board of water supply (tesis de doctorado). University of Hawaii in Manoa, Hawaii. [ Links ]
Onjala, J. (2001). Industrial water demand in Kenya: Industry behavior when tariffs are not binding (tesis de doctorado). Roskilde University Centre, Department of Environment, Roskilde, Denmark. [ Links ]
Rees, J. A. (1969). Industrial demand of water: A study of South East England. London, United Kingdom: Weidenfeld & Nicolson. [ Links ]
Renzetti, S. J. (2002). The economics of industrial water use. Cheltenham, UK, Northampton, MA, USA: Edward Elgar Pub. Recuperado de https://www.amazon.com/Economics-Industrial-Water-Management-Resources/dp/1840644990 [ Links ]
Renzetti, S. J., & Dupont, D. P. (2002). The value of water in manufacturing. Working Paper ECM 03-03. Swindon, United Kingdom: Economic and Social Research Council, Centre for Social Economic Research on the Global Environment. [ Links ]
Reynaud, A. (2003). An econometric estimation of industrial water demand in France. Environmental and Resource Economics, 25(2), 213-232. [ Links ]
Vargas, L. J. (2015). Valor económico del agua en la industria manufacturera chilena: enfoque de productividad marginal de factores (tesis de maestría). Universidad de Concepción, Facultad de Ciencias Económicas y Administrativas, Concepción, Chile. [ Links ]
Walsh, B. P., Cusack, D. O., & O´Sullivan, D. T. J. (2016). An industrial water management value system framework development. Sustainable Production and Consumption, 5, 82-93. [ Links ]
Wang, H., & Lall, S. (2002). Valuing water for Chinese industries: A marginal productivity analysis. Applied Economics, 34(6), 759-765. [ Links ]
William, S. (1986). The demand for water by customer class. Applied Economics, 18(12), 1275-1289. [ Links ]
Received: October 19, 2017; Accepted: April 11, 2018
 Este es un artículo publicado en acceso abierto bajo una licencia
Creative Commons
Este es un artículo publicado en acceso abierto bajo una licencia
Creative Commons
