


Services on Demand
Journal
Article
 text in
  English (pdf)
 Article in xml format
 Article references
 Send this article by e-mail
Indicators
-
 Cited by SciELO
 -
 Access statistics
Related links
-
 Similars in
SciELO
Similars in
SciELO
Share

 Permalink
Tecnología y ciencias del agua
On-line version ISSN 2007-2422
Tecnol. cienc. agua vol.9 n.4 Jiutepec Jul./Aug. 2018 Epub Nov 24, 2020
https://doi.org/10.24850/j-tyca-2018-04-01
Articles
Wave-structure interaction study to assess the service life of coastal structures
1 Facultad de Ingeniería, Universidad Autónoma del Carmen, Ciudad del Carmen, Campeche, México, lpalemon@pampano.unacar.mx
2 Laboratorio de Ingeniería y Procesos Costeros, Instituto de Ingeniería, Universidad Nacional Autónoma de México, Sisal, Hunucmá, Yucatán, México, ATorresF@iingen.unam.mx
3 Laboratorio de Ingeniería y Procesos Costeros, Instituto de Ingeniería, Universidad Nacional Autónoma de México, Sisal, Hunucmá, Yucatán, México. Cátedras Conacyt, Consejo Nacional de Ciencia y Tecnología, Ciudad de México, México. Laboratorio Nacional de Resiliencia Costera, Laboratorios Nacionales Conacyt, GMedellinM@iingen.unam.mx
4 Laboratorio de Ingeniería y Procesos Costeros, Instituto de Ingeniería, Universidad Nacional Autónoma de México, Sisal, Hunucmá, Yucatán, México, CAppendiniA@iingen.unam.mx
5 Facultad de Ingeniería, Universidad Autónoma del Carmen, Ciudad del Carmen, Campeche, México, jalvarez@delfin.unacar.mx
6 Facultad de Ingeniería, Universidad Autónoma del Carmen, Ciudad del Carmen, Campeche, México, ygutierrez@pampano.unacar.mx
7 Facultad de Ingeniería, Universidad Autónoma del Carmen, Ciudad del Carmen, Campeche, México, halvarado@delfin.unacar.mx
8 Facultad de Ingeniería, Universidad Autónoma del Carmen, Ciudad del Carmen, Campeche, México, mahernandez@pampano.unacar.mx
Abstract The functionality of coastal structures depends on the forces exerted by waves in combination with the mean sea level. Nevertheless, the study of wave structure requires determining the flow during the wave breaking processes, which cannot be solved analytically. Therefore, this work aims to extend an existing methodology to determine the service life of coastal structures using a 30-year wave hindcast and numerical models. For this, we used a maximum dissimilarity algorithm to select 600 representative combinations of waves, and the mean sea level, to simulate the wave-structure interaction using a non-hydrostatic non-linear shallow water equations model, coupled with a structural model. Subsequently, we quantified the failures due to overtopping and sliding associated to the simulated cases. An interpolation technique allowed us to reconstruct the 30-year time series of wave overtopping and wave-forces. Thus, the approach presented made it possible to characterize the failure of structures based on return periods. Moreover, numerical results were employed to calibrate existing semi-analytical models in order to quickly assess structural failure in the study area.
Keywords Vertical breakwaters; service life; wave-structure interaction; structure functionality
La vida útil de las estructuras costeras está en función de las fuerzas ejercidas por la acción combinada del oleaje y el nivel medio del mar. Sin embargo, el estudio de la interacción oleaje-estructura requiere conocer el papel de la rotura, el cual es en un fenómeno complejo que no se puede estudiar de forma analítica. Por tanto, en el presente trabajo propone extender una metodología existente para determinar la vida útil de los diques verticales, utilizando datos de un retroanálisis de oleaje y modelación numérica. Se empleó un algoritmo de máxima disimilitud para seleccionar 600 casos representativos de las condiciones de oleaje y nivel del mar en la zona de estudio, que fueron utilizados para el forzamiento de un modelo de propagación de oleaje. El modelo de propagación de oleaje se encadenó con un modelo no lineal, basado en las ecuaciones no hidrostáticas de aguas someras para calcular las fuerzas sobre la estructura y el rebase. Las fuerzas calculadas fueron utilizadas por un modelo de análisis estructural para cuantificar los movimientos asociados con la interacción oleaje-estructura. Los resultados de rebase y fuerzas fueron interpolados para las condiciones no modeladas, con el fin de reconstruir la serie temporal de 30 años. Estos resultados permiten caracterizar el fallo asociado con diferentes periodos de retorno. Finalmente, los resultados numéricos fueron utilizados para calibrar modelos semianalíticos y paramétricos para su uso en la zona de estudio.
Palabras clave diques verticales; vida útil; interacción oleaje-estructura; funcionalidad estructural
Introduction
The design of coastal structures is a challenging task owing to the highly dynamic environmental conditions that control wave-structure interactions in coastal areas. Structural design often takes into account the significant wave height associated with a given return period. Nevertheless, structure failure also depends on the combination of wave conditions with other variables (e.g., wind and tides) that can increase or decrease coastal hazards. Therefore, to obtain reliable estimates of service life, probabilistic and multivariate analyses have been proposed (Cheung & Kyle, 1996; Guanche, Camus, Guanche, Mendez, & Medina, 2013; Camus, Mendez, Medina, & Cofiño, 2010). More recently, methodologies have incorporated the role of uncertainty (e.g., Palemón-Arcos, Torres-Freyermuth, Pedrozo-Acuña, & Salles, 2015) and climate change in the life cycle of structures (Guanche et al., 2013).
Hindcast information provides a means to obtain historical information at locations where data is scarce (Reguero, Menéndez, Méndez, Mínguez, & Losada, 2012; Appendini et al., 2013). Meanwhile, great effort has also been devoted to developing methodologies to study the stability of coastal structures using numerical models (Losada, Lara, Guanche, & González-Ondina, 2008; Higuera, Lara, & Losada, 2013; Del Jesus, Lara, & Losada, 2012). Furthermore, the increase in computational power enables performing detailed investigations of wave-structure interaction processes, including overtopping (Guanche, Losada, & Lara, 2009) and sliding (Palemón-Arcos et al., 2015) estimates. Nevertheless, it is still not practical to simulate a high number of cases to provide statistically robust information due to the computational effort required. Therefore, previous works has been devoted to investigating the application of algorithms that allow for selecting representative cases (Camus, Mendez, Medina, & Cofiño, 2011a; Snarey, Terrett, Willet, & Wilton, 1997; Willet, 1996; Polinsky, Feinstein, Shi, & Kuki, 1996) to further reconstruct multi-year time series of nearshore wave conditions (Camus et al., 2010), wave-structure interaction (Guanche et al., 2013), and beach runup (Medellín et al., 2016).
This study presents a downscaling approach to investigate detailed wave-structure interaction and to further conduct a probabilistic assessment of structural failure, considering the occurrence of extreme waves and water levels. The outline of this paper is the following. Section 2 describes the study area, including the environmental conditions and the structural characteristics. Section 3 provides an overview of the numerical models employed in this work. The methods are described in Section 4, and Section 5 presents the results. Finally, Section 6 presents the conclusions.
Study area
The study area is located in Ciudad del Carmen, Campeche, Mexico (Figure 1). The offshore bathymetry is characterized by a mild slope (1: 500). For the offshore bathymetry, we employed the ETOPO1 (Amante, 2009), and a bathymetric survey conducted in 1999 was employed for the nearshore (Figure 2).
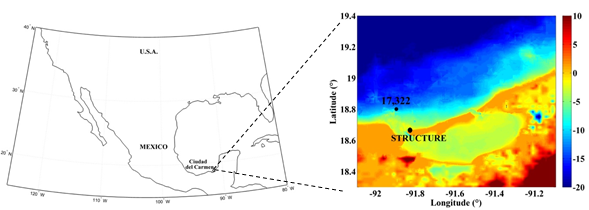

Wave and sea level conditions are fundamental to a structure failure analysis. The wave climate in this area shows a higher frequency of storms during winter months, associated with the passage of anticyclonic cold fronts through the Gulf of Mexico (Appendini et al., 2013; Appendini, Hernández-Lasheras, Meza-Padilla, & Kurczyn, 2018). However, there are no available measured wave data for the study area. Therefore, we used 30-year wave hindcast data derived from a NARR reanalysis of the Gulf of Mexico and the Caribbean (Appendini, Torres-Freyermuth, Salles, Lopez-Gonzalez, & Mendoza, 2014). The data used in the study corresponded to a node located at 18.8( N and -91.90( W (Figure 1), located at approximately 10 m deep and 15 km offshore of the study area. The hindcast data has a time step of 3 hours and covers the years 1979 through 2008, providing a total of 87 664 sea states. Each sea state consists of the significant wave height (H s ), peak wave period (T p ), and wave direction (θ). In addition, the astronomic tide (Z) was obtained using the harmonic constants for the global mesh from the numerical model MIKE 21 SW (Sørensen, Kofoed-Hansen, Rugbjerg, & Sørensen, 2004), using the Global Tide Model by Cheng and Andersen (2010).
To determine the mean sea level (NM), it is necessary to include the storm surge (MT) contribution. Therefore, we obtained an estimation using (Dean & Dalrymple, 1991):
Where:
where h 0 is the water depth, in meters, n is the drag coefficient 1.3, A is a ratio of shear to hydrostatic forces, g is known as the acceleration of gravity, ρ a is the air density (1.204 kg/m3), ( w is the water density (1 028 kg/m3), u 10 is the wind velocity from the NARR, and k is the friction factor equal to 0.0034.
Figure 3 shows the wave hindcast time series at the selected node, the astronomical tide (Z), and the storm surge (MT). The mean sea level, (NM) employed as an initial condition for each case, was obtained as the algebraic sum of the astronomical tide and the storm surge.
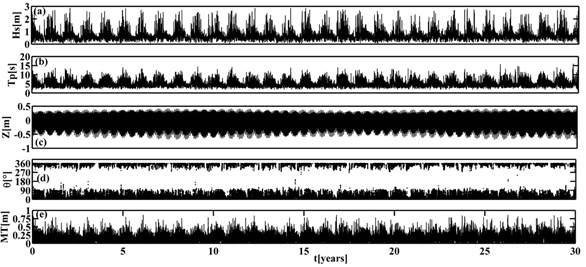
Figure 3 Time series of simulated data (1979-2008): Significant wave height, (b) peak period, (c) astronomical tide, (d) wave direction, and (e) storm surge.
To illustrate the methodology, we chose a vertical structure located in Ciudad del Carmen (Campeche, Mexico). The structure was made of reinforced concrete with five steel bars per meter, and a total length of 13 m with 7.6 m buried in the seabed. The still water level in front of the structure was 3.4 m with a freeboard of 2 m with respect to the mean sea level (see Figure 4). The sheet piling system consisted of 25 cm thick and 60 cm wide elements that were joint together with a wale.

The sheet pilling was driven with a drop hammer to the depth specified in the design. Subsequently, a wale assembly was installed to brace the sheet members.
Numerical models
We coupled three numerical models to investigate the wave-structure interaction (Figure 5). The wave propagation model SWAN (Booij, Ris, & Holthuijsen, 1999) was employed to propagate waves on the nearshore and for determining the boundary conditions of the hydrodynamic model SWASH (Zijlema, Stelling, & Smit, 2011). The SWASH model estimates the wave overtopping and the pressures exerted on the vertical structure. The latter information was employed in a structural analysis model to determine if a structural failure would occur. The numerical models have been thoroughly described elsewhere, and hence only a brief description of each model is provided herein.
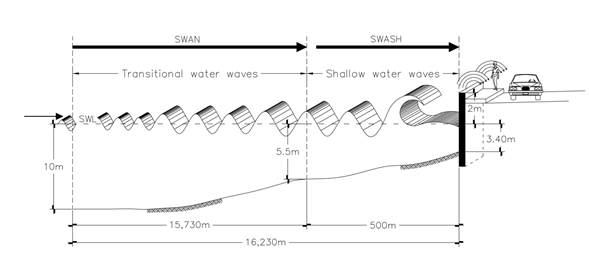
Figure 5 Conceptual diagram illustrating the coupling between the waves, hydrodynamics, and structural models.
Wave propagation model
The numerical model Simulating WAves Nearshore (SWAN) is a third-generation wave propagation model developed by Delft University of Technology (Booij et al., 1999). It is a phase-averaged numerical model based on the wave action equation given by:
where the action density is given by N(σ,θ) as a function of the relative frequency σ, and the wave angle θ .
The first term in Equation (3) represents the local action density variation over time, while the second and third terms refer to the action density propagation in space (where C x and C y are the wave energy propagation celerity in the x and y directions, respectively). The fourth term represents the change in relative frequency due to variations in depth and currents (where Cr is the celerity propagation in the frequency domain). The fifth term represents current and depth induced refraction (where Calpha is the propagation celerity in the directional domain). The right-hand terms represent the spectral energy sources and sinks due to wind, whitecapping, triads, and quadruple interactions. The numerical model allowed us to propagate the offshore hindcast information to the nearshore, providing the boundary conditions for the hydrodynamic model described below.
Hydrodynamic model
The numerical model Simulating WAves till SHore (SWASH) is a transient numerical model that simulates hydrodynamics and free-surface in one or two dimensions (Zijlema et al., 2011). The numerical model solves the non-hydrostatic nonlinear shallow water equations. The governing equations are conservation of mass and momentum:
where t is time, x and y are cross- and along-shore coordinates, η(x, y, τ) is free-surface elevation, d (x, y) is water depth, h = (+ d is total water depth, u (x, y, t) and v (x, y, t) are flow velocities, q (x, y, z, t) is hydrostatic pressure, g is gravitational acceleration, C f is the friction coefficient, and τ xx , τxy, τyx and τyy are shear turbulent stresses. We used the numerical model to simulate the wave-structure interaction using the nearshore (spectral) wave conditions predicted by SWAN. The numerical results provided a time series of water level, flow, and pressures in front of the structure.
Structural dynamic model
The structural analysis is a key step in structural design. The main goal of such analysis is to determine forces and stresses, and the corresponding displacement and deformation over the structure. For the structural analysis, we employed the Staad Pro finite element model which solves the equation (Chopra, 2011):
where M represents the mass matrix, C is the flexibility matrix, K is the stiffness matrix, and p is forcing. The model allows us to quantify the type of failure associated with the given wave conditions. The estimates of the SWASH pressure on the structure are used as boundary conditions for the model.
Methods
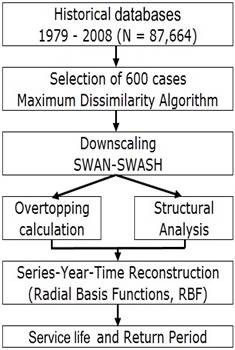
The framework employed in this work is illustrated in Figure 6. Firstly, we selected 600 representative cases to simulate wave propagation and wave-structure. With the hydrodynamic model, both the overtopping volume and forces for each case could be estimated. Furthermore, a structural analysis was carried out by coupling the hydrodynamic model with a structural dynamic model. Structural failure for the simulated cases could thereby be determined and subsequently employed to reconstruct the time series of wave overtopping and wave-induced structure displacement for every wave condition during the 1979 to 2008 period. In addition, a probabilistic assessment enabled us to determine the service life of the structure. Lastly, we used the numerical results as a tool to calibrate existing semi-analytical models in order to quickly assess structural failure.
Downscaling
The wave hindcast data resulted in more than 80 000 combinations of wave parameters and mean sea levels (astronomical and storm surge) to employ as forcing conditions in the study area. Therefore, we used the Maximum Dissimilitude Algorithm according to previous work by Camus Mendez, Medina, & Cofiño (2011b) to select 600 modeling scenarios (blue circles in Figure 7).
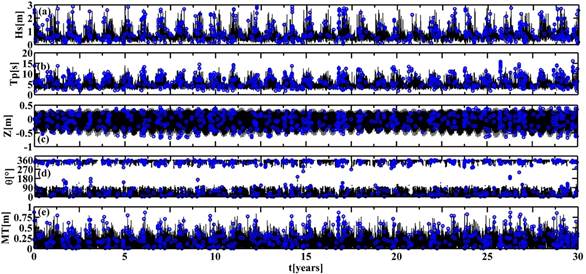
Figure 7 Time series of 30 years of data:(a) significant wave height, (b) peak wave period, (c) tide, (d) mean wave direction, and (e) storm surge. The open blue circles correspond to the 600 selected cases with the Maximum Dissimilitude Algorithm (MDA).
The selected wave conditions were propagated using the numerical model SWAN (Booij et al., 1999) assuming a JONSWAP spectrum (γ=3.3) propagating across the nearshore bathymetry (Figure 2). The computational domain in SWAN is composed of 286 cells with a cell size of 55 m. The propagated spectra were employed for forcing the transient numerical model SWASH in the one-dimensional version. The computational domain was 2 000 cells with a uniform mesh of 0.25 m. Wave breaking was computed based on the wave steepness and hence no further calibration was required.
Functional and structural failure analysis
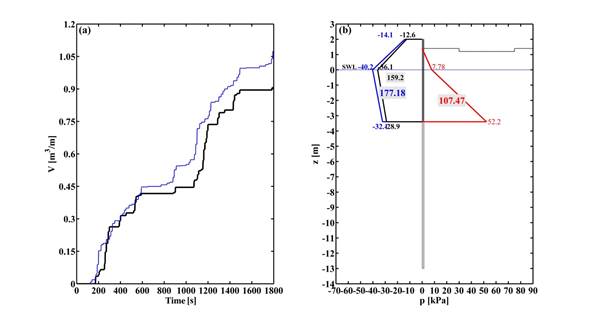
With the SWASH model results, overtopping volumes were then directly estimated for each simulated case. Overtopping calculations were given in m3/m/s. Furthermore, the numerical model enabled obtaining the dynamic pressure acting on the structure. Thus, by integrating the envelope of the maximum pressures, we obtained the acting forces over the structure. Figure 8a shows the overtopping time series for two simulated cases. The solid blue line corresponds to Hs = 3.3 m and Tp = 8.4 s, whereas the solid black line corresponds to Hs = 2.6 m and Tp = 14 s. Based on the modeling results, the overtopping rates can be estimated for each case. With regard to the forces obtained from the SWASH model, these were input into the structural model (StaadPro) for a detailed structural analysis. This numerical model enables investigating the detailed soil-structure interaction. Figure 8b shows the maximum pressures over the vertical wall for the two cases. The red line shows the diagram of the active pressures with its respective magnitudes. For these particular cases, the wave-induced forces were greater than the active pressure, and hence a structural failure would occur. This analysis was conducted for each of the 600 simulated cases.
Probabilistic analysis
We employed a multidimensional interpolation technique, based on radial basis functions, to reconstruct the time series of wave overtopping and forces for the complete 30-year period. This technique is suitable for multidimensional and scattered data (Franke, 1982; Hardy, 1990) and has been previously applied to downscale wave data (e.g., Camus et al., 2011a; Camus et al., 2011b; Guanche et al. 2013; Medellín et al., 2016). In accordance with previous work, the Gaussian function was used and the shape parameter was obtained using the algorithm proposed by Rippa (1999). This method enabled us to interpolate overtopping and forces for all conditions (Hs, Tp, Z, MT) observed during the 1979 to 2008 period. An extreme value analysis based on the Gumbel distribution was performed for the annual maximum values of overtopping and structural failure. The extreme analysis allowed us to generate the necessary information to determine the service life of the structure. The term limit state was used to describe a condition under which a structure or some part of a structure ceases to perform its intended function. Specifically, the strength limit state is based on the safety or load-carrying capacity of structures and includes buckling, fracture, fatigue, overturning, and so on. The present work applied the annual maximum method. Thus, as a final step, the return period for wave overtopping and forces could be estimated for the selected structure.
Results
This section presents the results from the structural and functional analyses carried out on the vertical structure considered in this work.
Wave overtopping
The wave overtopping results corresponding to the 600 simulated cases are presented in Figure 9a (black circles). This information was employed to reconstruct the 30-yr time series shown in Figure 9b (solid blue circles).
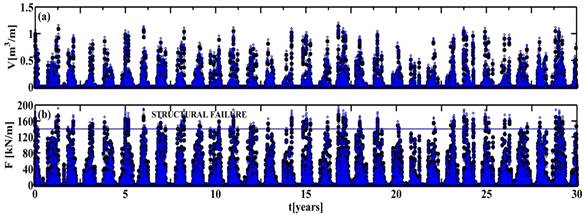
Figure 9 Reconstructed time series (blue dots) vs propagation results (black dots) corresponding to (a) overtopping volume and (b) resulting forces.
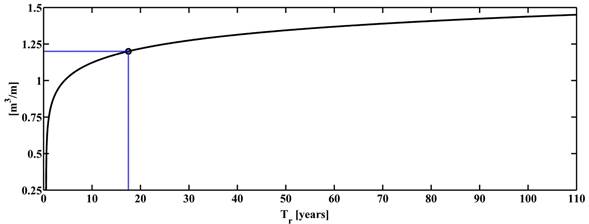
Large overtopping events are strongly correlated with more energetic wave conditions. Based on this information, determining return periods and their relation to hazardous conditions is straightforward. For instance, the 1.2 m3/m value is reported as an unsafe value (USACE, 2002). The current results show that for the structure considered in this work, such conditions are present with a return period of 17.5 years (Figure 10).
Structural analysis
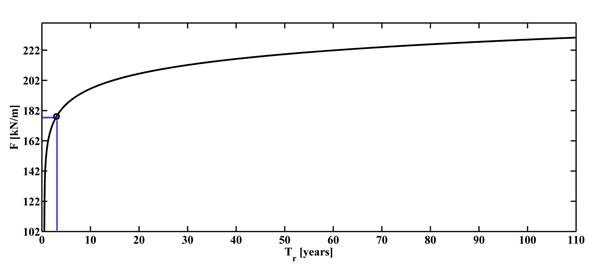
Knowledge of a structure’s capacity is required to determine structural failure. Therefore, structural characteristics need to be considered. More specifically, the structural resistance depends on the characteristics of the sheet piles. Furthermore, the specifications for the concrete and the steel employed are also necessary. Based on the existing norms for the design and construction of concrete structures, we obtained a resistance moment of 22 ton-m with a steel surface of 38.04 cm2 corresponding to the vertical impermeable structure. Therefore, according to the structural review, the resulting force is 178.1 kN-m. The hydrodynamic model provided information on the forces acting on the structure. Hence, we were able to reconstruct the resulting forces from the 30-yr time series using the interpolation technique and the numerical results. Subsequently, the resulting forces were employed in the structural model to simulate the behavior of the sheet piles and determine whether structural failure occurs. The acting dynamic forces counteract the soil resistance. If the dynamic force is higher than the active pressure, a structural failure occurs. For this case, a return period of 3 years corresponded to the failure threshold (i.e., 178.1 kN/m) (see Figure 11).
Discussion: Parameterization
Wave-structure interaction results in wave overtopping and dynamic forces on the structure that are responsible for structure failure. In this work, we employed the coupling of numerical models to quantify different types of failures. However, this approach is not practical due to both the technical skills and computational time required. Therefore, we proposed the use of the present numerical results for the development of ad hoc parameterizations.
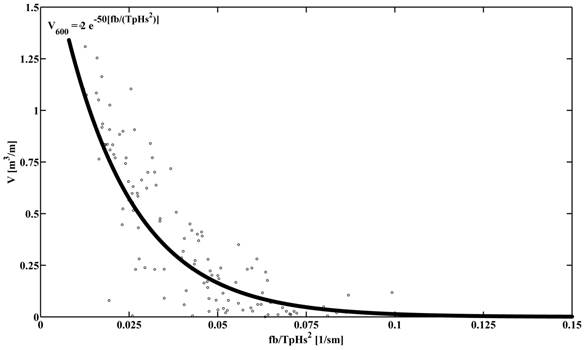
The overtopping parameterization is given as a function of the freeboard, f b , peak period, and significant wave height. Thus, the formulation is given by:
The black dots in Figure 12 represent the numerical results, whereas the solid line represents the best fit to the model data described by Equation (9).
Then, by analyzing the forces we can calibrate the semi-analytical model introduced by Goda (2000). Thus, we used the numerical results to obtain the parameters that improve the fit in Goda’s model. The coefficient values for the vertical structure are the following:
In this particular case, the coastal structure does not present a rubble mound base and hence Equation (11) is zero. On the other hand, the values for α 1 and α 3 are dependent on the wave period. Figure 13a compares the values obtained from the best fit of the model data with the coefficients proposed by Goda (2000). The main difference corresponds to α 1, which improves the prediction for the current case (Figure 13b).
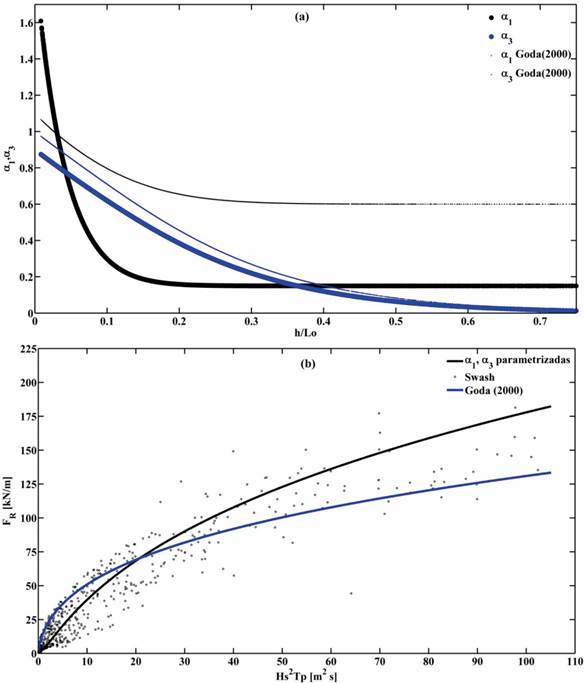
Figure 13. (a) Parameterization of coefficients α 1 and α 3 in Goda (2000) and (b) resultant force prediction using standard (solid blue line) and derived (solid black line) coefficients with respect to model results (black dots).
Conclusions
This work presented a methodology to determine the service life of coastal structures using numerical and statistical tools. The current approach is particularly useful in coastal regions where data is scarce. To illustrate the methodology, we selected a vertical structure located in the Gulf of Mexico. The analysis of the results suggests that the structure presented overtopping failure with a return period of 17 years, and structural failure would occur with a return period of only 3 years. The numerical results were further employed to derive/revise parametric and semi-analytical models at this site. The derived formulation makes it possible to quickly estimate both forces and overtopping without the need for numerical models.
Acknowledgments
Leonardo Palemón-Arcos acknowledges the support from the Programa para el Desarrollo Profesional Docente through the Universidad Autónoma del Carmen. Alec Torres-Freyermuth and Gabriela Medellín thank Conacyt for support through the program Cátedras Conacyt (1146) and Laboratorios Nacionales Conacyt (LN27154). Christian M. Appendini acknowledges DGAPA for financial support through PAPIIT IA100418. Technical support was provided by Gonzalo U. Martín Ruiz and José López González.
REFERENCES
Amante, C. (2009). ETOPO1 1, Arc-minute global relief model: Procedures, data sources and analysis. Recovered from https://www.ngdc.noaa.gov/mgg/global/global.html [ Links ]
Appendini, C. M., Torres-Freyermuth, A., Oropeza, F., Salles, P., López, J., & Mendoza, E. T. (2013). Wave modeling performance in the Gulf of Mexico and Western Caribbean: Wind reanalyses assessment. Applied Ocean Research, 39, 20-30. [ Links ]
Appendini, C. M., Torres-Freyermuth, A., Salles, P., Lopez-Gonzalez, J., & Mendoza, E. T. (2014). Wave climate and trends for the Gulf of Mexico: A 30 year wave hindcast. Journal of Climate, 27, 1619-1632. DOI:dx.doi.org/10.1175/JCLI-D-13-00206.1 [ Links ]
Appendini, C. M., Hernández-Lasheras, J., Meza-Padilla, R., & Kurczyn, J. A. (2018). Effect of climate change on wind waves generated by anticyclonic cold front intrusions in the Gulf of Mexico. Climate Dynamics. DOI:https://doi.org/10.1007/s00382-018-4108-4 [ Links ]
Booij, N., Ris, R. C., & Holthuijsen, L. H. (1999). A third-generation wave model for coastal regions. Part I: Model description and validation. Journal of Geophysical Research, 104(C4), 7649-7666. [ Links ]
Camus, P., Mendez, F. J., Medina, R., & Cofiño, A. S. (2010). Analysis of clustering and selection algorithms for the study of multivariate wave climate. Coastal Engineering. DOI:10.1016/j.coastaleng.2011.02.003 [ Links ]
Camus, P., Mendez, F. J., Medina, R., & Cofiño, A. S. (2011a). Analysis of clustering and selection algorithms for the study of multivariate wave climate. Coastal Engineering, 58(6), 453-578. Recovered from https://dx.doi.org/10.1016/j.coastaleng.2011.02.003 [ Links ]
Camus, P., Mendez, F. J., & Medina, R. (2011b.) A hybrid efficient method to downscale wave climate to coastal areas. Coastal Engineering, 58(9), 851-862. Recovered from http://dx.doi.org/10.1016/j.coastaleng.2011.05.007 [ Links ]
Cheng, Y., & Andersen, O. B. (2010). Improvement in global ocean tide model in shallow water regions (SV.1-68 45). Lyngby, Denmark: Technical University of Denmark. [ Links ]
Cheung, M. S., & Kyle, B. R. (1996). Service life prediction of concrete structures by reliability analysis. Construction and Building Materials, 10(1), 45-55. [ Links ]
Chopra, A. K. (2011). Dynamic of structures (4th ed.). New Jersey, USA: Prentice Hall. [ Links ]
Dean, R. G., & Dalrymple, R. A. (1991). Water Wave Mechanics for Engineers and Scientists, Advanced Series on Ocean Engineering (Vol. 2.). Singapore, Singapore: World Scientific. [ Links ]
Del Jesus, M., Lara, J. L., & Losada, I. J. (2012). Three-dimensional interaction of waves and porous coastal structures. Part I: Numerical model formulation. Coastal Engineering, 64(0), 57-72. Recovered from http://www.sciencedirect.com/science/article/pii/S0378383912000245 [ Links ]
Franke, R. (1982). Scattered data interpolation: Test of some methods. Mathematics of Computation, 38, 181-200. [ Links ]
Goda, Y. (2000). Random seas and design of maritime structures. Advanced Series on Ocean Engineering (2nd ed.). Yokohama, Japan: Yokohama National University, World Scientific. [ Links ]
Guanche, R., Losada, I. J., & Lara, J. L. (2009). Numerical analysis of wave loads for coastal structure stability. Coastal Engineering, 56(5Ð6), 543-558 Recovered from http://www.sciencedirect.com/science/article/pii/S0378383908002159 [ Links ]
Guanche, Y., Camus, P., Guanche, R., Mendez, F. J., & Medina, R. (2013). A simplified method to downscale wave dynamics on vertical breakwaters. Coastal Engineering, 71, 68-77. [ Links ]
Hardy, R. L. (1990). Theory and applications of the multiquadric-biharmonic method. Computers and Mathematics with Applications, 19(8-9), 163-208. [ Links ]
Higuera, P., Lara, J. L., & Losada, I. J., (2013). Simulating coastal engineering processes with openfoam. Coastal Engineering, 71(0), 119-134. Recuperado de http://www.sciencedirect.com/science/article/pii/S0378383912001093 [ Links ]
Losada, I. J., Lara, J. L., Guanche, R., & González-Ondina, J. M. (2008). Numerical analysis of wave overtopping of high mound breakwaters. Coastal Engineering, 55, 47-62. [ Links ]
Medellín, G., Brinkkemper, J. A., Torres-Freyermuth, A., Appendini, C. M., Mendoza, E. T., & Salles, P. (2016). Run-up parameterization and beach vulnerability assessment on a barrier island: A downscaling approach. Natural Hazards and Earth System Sciences, 16(1), 167. [ Links ]
Palemón-Arcos, L., Torres-Freyermuth, A., Pedrozo-Acuña, A., & Salles, P. (2015). On the role of uncertainty for the study of wave-structure interaction. Coastal Engineering, 106, 32-41. [ Links ]
Polinsky, A., Feinstein, R. D., Shi, S., & Kuki, A. (1996). Librain: Software for automated design of exploratory and targeted combinatorial libraries. In: Chaiken, I. M., & Janda, K. D. (eds.). Molecular Diversity and Combinatorial Chemistry: Libraries and Drug Discovery (pp. 219-232). Washington, DC, USA: American Chemical Society. [ Links ]
Reguero, B. G., Menéndez, M., Méndez, F. J., Mínguez, R., & Losada, I. J. (2012). A Global Ocean Wave (GOW) calibrated reanalysis from 1948 onwards. Coastal Engineering, 65, 38-55. Recovered from http://dx.doi.org/10.1016/j.coastaleng.2012.03.003 [ Links ]
Rippa, S. (1999). An algorithm for selecting a good value for the parameter c in radial basis function interpolation. Advances in Computational Mathematics, 11, 193-210. [ Links ]
Snarey, M., Terrett, N. K., Willet, P., & Wilton, D. J., (1997). Comparison of algorithms for dissimilarity-based compound selection. Journal of Molecular Graphics & Modelling, 15, 372-385. [ Links ]
Sørensen, O. R., Kofoed-Hansen, H., Rugbjerg, M., & Sørensen, L. S., (2004). A third-generation spectral wave model using an unstructured finite volume technique. In: Proceedings of the 29th International Conference on Coastal Engineering (pp. 894-906), ASCE, New York, USA. [ Links ]
US Army Corps of Engineers, USACE. (2002). Coastal Engineering Manual. Tech. Rep. Washington, DC, USA: US Army Corps of Engineers. [ Links ]
Willet, P. (1996). Molecular diversity techniques for chemical databases. Information Research, 2(3). Recovered from http://informationr.net/ir/2-3/paper19.html [ Links ]
Zijlema, R. L., Stelling, G., & Smit, P. (2011). SWASH: An operational public domain code for simulating wave fields and rapidly varied flows in coastal waters, Coastal Engineering, 58(3), 992-1012. [ Links ]
Received: June 14, 2017; Accepted: March 14, 2018
 Este es un artículo publicado en acceso abierto bajo una licencia
Creative Commons
Este es un artículo publicado en acceso abierto bajo una licencia
Creative Commons
