


Servicios Personalizados
Revista
Articulo
 texto en
  Inglés (pdf)
 Artículo en XML
 Referencias del artículo
 Enviar artículo por email
Indicadores
-
 Citado por SciELO
 -
 Accesos
Links relacionados
-
 Similares en
SciELO
Similares en
SciELO
Compartir

 Permalink
Tecnología y ciencias del agua
versión On-line ISSN 2007-2422
Tecnol. cienc. agua vol.9 no.3 Jiutepec may./jun. 2018 Epub 24-Nov-2020
https://doi.org/10.24850/j-tyca-2018-03-07
Articles
Estimation of exposure to high fluoride contents in groundwater supply in some villages in Guanajuato, Mexico
1†Universidad Nacional Autónoma de México, Instituto de Geofísica, Cd. Universitaria, Ciudad de México, México, ivanma@geofisica.unam.mx
2Universidad Nacional Autónoma de México, Instituto de Geofísica, Cd. Universitaria, Ciudad de México, México, victoria@geofisica.unam.mx
3Universidad Nacional Autónoma de México, Instituto de Geofísica, Cd. Universitaria, Ciudad de México, México, ramiro@geofisica.unam.mx
A study was carried out to estimate the level of fluoride exposure and the human health risk of developing dental and skeletical fluorosis in some of the villages in Santa Cruz de Juventino Rosas (JR), state of Guanajuato, Mexico. The study included a fluoride concentration analysis of groundwater samples from 23 wells during the years 2010 to 2016, estimation of exposure to fluoride (EEF), and an epidemiological survey (ES) using Dean’s Index (DI). Fluoride concentrations ranged from 0.51 to 324 mg/l. Twelve sampled wells exceeded the national guideline values for fluoride concentrations (NOM-127-SSA1-1994: 1.5 mg/l). High F- concentrations are associated with ascending geothermal flow. According to EEF results (0.01-1.8 mg/kg/d), people from three small towns, from 16 to 50 years old, were at potential risk of dental fluorosis. This was confirmed by the results from the ES, with 23% of the people surveyed showing evidence of dental fluorosis, mostly young individuals. More than 50% of the people with evidence of dental fluorosis were between 16 to 50 years old. The ongoing consumption of fluoride-rich water is considered to be an important factor for developing dental fluorosis, and some of the people surveyed have lived at the study site for about 20 years.
Keywords Dental fluorosis; Mexico; water consumption patterns
Se llevó a cabo un estudio para estimar los niveles de riesgo por exposición para desarrollar fluorosis dental y esquelética en distintas comunidades en Santa Cruz de Juventino Rosas (JR), estado de Guanajuato, México. El estudio incluyó el análisis químico de la concentración de fluoruros en muestras de agua de 23 pozos durante los años 2011 hasta 2016; se realizó el cálculo para estimar la exposición a fluoruros (EEF) y una encuesta epidemiológica (EEp) usando el Índice de Dean (ID). EL rango de concentración de fluoruros en los pozos fue de 0.15 a 3.24 mg/l. Doce pozos muestreados exceden el límite permisible de calidad en relación con la concentración de fluoruros, establecido por la norma oficial mexicana NOM-127-SSA1-1994, que es de 1.5 (mg/l) en agua para consumo humano. Altas concentraciones de F- en el agua subterránea se han asociado con flujos geotérmicos ascendentes. De acuerdo con los resultados de EEF (0.01-1.8 mg/kg/d), las personas de tres asentamientos rurales con rangos de edad entre 16 y 50 años están en riesgo potencial para generar fluorosis dental; los resultados de la EEp confirmaron esta situación. El 23% de la población encuestada mostró evidencias de fluorosis dental, la mayoría gente joven; más de 50% de los individuos con evidencias de fluorosis dental tienen entre 16 y 50 años. Se considera que un factor importante para el desarrollo de fluorosis dental es el continuo consumo de agua enriquecida en fluoruros. Algunas de las personas encuestadas viven en el sitio desde hace más de 20 años.
Palabras clave fluorosis dental; México; patrones de consumo de agua
Introduction
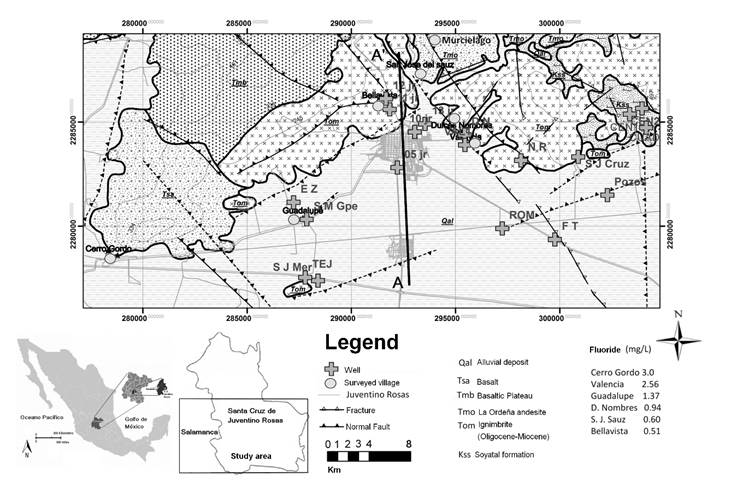
In many regions of the world, the effects of ingesting water with high F- concentrations on health have been reported (Griffin, Beltran, Lockwood, & Barker, 2002; Soto-Rojas, Ureña-Cirret, & Martinez-Mier, 2004; Armienta & Segovia, 2008). Natural high fluoride concentrations in groundwater are usually associated with geothermal waters that interact with various rock types enriched in F-, mainly of volcanic origin (Ruiz, Kesler, & Jones, 1985; Morales, Villanueva-Estrada, Rodríguez, & Armienta, 2015). Dissolution of fluorite, igneous rocks containing silicates, and in some cases dolomitic marbles, has been identified as the main source of F- in groundwater (Petersen, Essene, & Peacor, 1982; Ravishankar, 1987; Levy, Schramke, Esposito, Erickson, & More, 1999). Parameters such as pH, temperature, well depth, and hydrogeological and tectonical structures are also involved in the presence of fluoride (Rodríguez et al., 2001; Armienta & Segovia, 2008; Morales et al., 2015). The use of groundwater with high F- concentrations for urban supply represents a potential risk for exposed populations (Rivett et al., 2006; EPA, 2011). The ingestion of water with high concentrations of F- over long periods may result in fluoride accumulation in calcified tissues and ligaments, bone deformation, dental and skeletal fluorosis, and renal disorders (McDonagh et al., 2000; EPA, 2011; Griffin et al., 2002). In Mexico, the occurrence of dental fluorosis due to high fluoride concentrations in groundwater has been reported in various cities, including Aguascalientes, Chihuahua, Durango, Hermosillo, San Miguel de Allende, and San Luis Potosí (Grimaldo et al., 1995; Díaz-Barriga et al., 1997; Mendoza, 1999; Alarcón-Herrera, Martín-Domínguez, Trejo-Vázquez, & Rodríguez-Dozal, 2001; Grijalva-Haro, Barba-Leyva, & Laborín-Alvarez, 2001; Trejo-Vázquez & Bonilla-Petriciolet 2001; Hurtado-Jiménez & Gardea-Torredey, 2005; Betancourt-Lineares, Irigoyen-Camacho, Mejía-González, Zepeda-Zepeda, & Sánchez-Pérez, 2013; SAPASMA, 2006). Santa Cruz de Juventino Rosas (JR) is a small city located in the lowlands, in the state of Guanajuato, central Mexico (Figure 1), where cattle farming and agriculture are the main economic activities, and groundwater is the main source of water (Rodríguez et al., 2001). More than 2 000 wells in the state of Guanajuato supply water to Guanajuato’s lowlands area. A total of 380 agricultural, urban, and inactive wells are located in the town of JR, 66 of which supply water for urban activities. This study monitored 23 wells, 10 of which contained high concentrations of F-. Health effects related to F- in urban water in another city in Guanajuato have been detected (Ortíz-Burgos, Vargas-Garcidueñas, & Ovalle-Castro, 1996; Cervantes-González, Ortíz-Burgos, & Wilbert-Ovalle, 1998). According to Morales et al. (2015), groundwater in JR has geothermal characteristics, with naturally high F- concentrations exceeding the national guideline (NOM-127-SSA1-1994; Fˉ= 1.5 (mg/l)). Rodríguez, Morales-Arredondo, and Rodríguez (2016) calculated the background value, obtaining a concentration of 1.93 ± 0.75 (mg/l). The objective of the present study was to estimate the exposure to fluorides in drinking water and evaluate the associated risk of developing fluorosis due to water ingestion for the population of Santa Cruz de Juventino Rosas, Guanajuato, Mexico. To this end, the content of F- in groundwater was analyzed.
Study area
Location, geology and hydrogeology
The town of JR is located in the TransMexican Volcanic Belt. The Guanajuato Range is on the northern border of the valley (Figure 1). In Guanajuato’s lowlands area, a semi-arid climate largely predominates, with average precipitation from 600 to 700 mm per year. The geological basement is defined by Cretacic volcanic-sedimentary rocks and clayey calcareous sediments of the Soyatal Formation (Cerca-Martínez, Aguirre-Díaz, & López-Martínez, 2000). Fractured rhyolites and basalts overlie the basement (Quintero, 1999). These units, which are 100 to 150 m thick, host the main exploited aquifer (CEAG, 2000) (Figure 1, Figure 2). Two tectonic events affected the whole area: the first one related to the Laramide Orogeny, and the second to an extensional phase with intense magmatism. Both events produced faults and fractures in the area, with preferential directions NE-SW, EW, and NW-SE (Cerca-Martínez et al., 2000). These faults enable geothermal waters to rise, which may contain elements such as As, F-, and Rn (Morales et al., 2015; Rodríguez, Morales, Armienta, Villanueva, & Segovia, 2015) (Figure 1, Figure 2, Figure 3). The basin’s plain is filled with sediments derived from the surrounding volcanic rocks. There are also lacustrine sediments of variable granulometry (Orozco-Esquivel, Nieto-Samaniego, & Alaniz-Alvarez, 2002). The sedimentary basin contains a shallow, semiconfined aquifer, which is 20-25 m deep, and its exploitation has provoked subsidence processes.
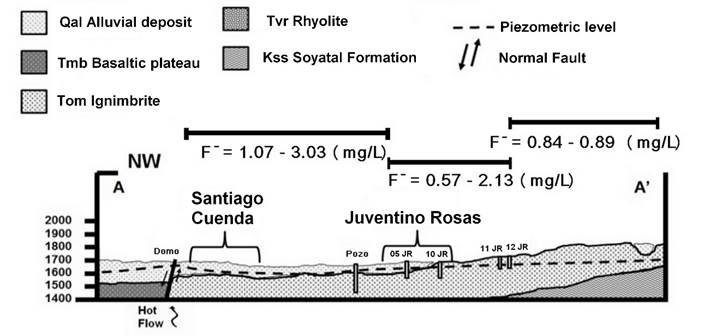
Figure 2 Stratigraphic profile (AA') of the study area. The profile shows some of the sampled wells and the fluoride concentrations in the recharge zone (0.84-0.89 mg/l), the piedmont zone (0.57-2.13 mg/l), and the alluvial plain (1.07-3.03 mg/l).
Methodology
Water sampling and monitoring campaigns were carried out in small towns and agriculture wells in JR from 2010 to 2016. A sampling campaign was performed once or twice yearly during the months of July and October. Water samples were collected as described by Mexican standards (NOM-230-SSA1-2002). Twenty three wells in small towns were monitored, which were located mainly in three zones: northwest (Dulces Nombres = DN; Juventino Rosas = JR; 13JR; 12JR; 11JR; 09JR; 05JR; Emiliano Zapata = EZ); northeast (Centeno 1 = Cen1; Centeno 2 = Cen2; Cuadrilla = Cuad; Nuevo Rocillo = NR; San Juan Cruz = SJCruz; San José Manantial = SJMan), and south (Valencia 1 = Val1; Valencia 2 = Val2; 10JR; 08JR; Franco Tavera = FT; Pozos = Pozos; Romerillo = Rom; San José Merino = SJMer; Santa María Guadalupe = SMGpe; Tejera = Tej). Fluoride concentration analyses of water samples were performed at the Geophysics Institute’s Chemical Analysis Laboratory, (National Autonomous University of Mexico, UNAM) in accordance with APHA analytical methods (APHA-AWWA-WWF, 2005). Fluoride concentration was measured using potentiometry with Thermo Scientific Orion 5 Star selective electrodes. A TISAB solution was added to standards and samples in order to adjust the ionic strength and avoid complex formation.
The estimation of exposure to fluoride (EEF, Equation 1) was evaluated in 6 rural communities (Table 1, Figure 1, Figure 2). In order to carry out the calculations, the study considered the water extracted from deep wells to be the only source of drinking water and F- exposure, and that it was used by the population for all its activities. Standard values were used for the population’s body mass and water consumption, by age range (Environment Canada, 1993; Ortíz, Castro, Turrubiates, Milan, & Díaz-Barriga, 1998). The calculations were based on the following equation:
where:
EEF |
estimation of exposure to fluoride (mg/kg/day) |
(F-) |
fluoride concentration in water (mg/l) |
CH2O |
water consumption by age (l/day) |
Wind |
individual body mass by age (kg) |
Table 1 Population surveyed in JR and agricultural communities.
| Neighborhood | Total in habitants | Surveyed Individuals |
|---|---|---|
| Bellavista | 104 | 14 |
| San José del Sauz | 483 | 26 |
| Murciélago | 731 | 38 |
| Dulces Nombres | 1258 | 19 |
| Valencia | 337 | 39 |
| Guadalupe | 391 | 11 |
| Cerro Gordo | 1 591 | 170 |
| Total | 4 895 | 317 |
An epidemiological survey (ES) without biomarkers was carried out in July 2015 at the villages. The survey considered a) consumption patterns and b) evidence of visual health effects related to F- ingestion using Dean’s Index (DI) (Dean, 1934). A diagnostic scale was used to identify the different types of dental fluorosis (questionable, very mild, mild, moderate, and severe), and questionable evidences were not included in the discussion of results. The survey was carried out in 6 rural communities (Table 1, Figure 1, Figure 2). Various people participated in the epidemical survey, which was conducted face-to-face in the towns. A group of epidemiology specialists from the University of Guanajuato helped to identify the effects. Surveyed units were classified according to strata by families, and the total population was N = 4 895. The epidemiological survey used a non-probabilistic method with random routes and simple sampling, where all the individuals in the target population had the same probability of participating (Gómez, 1990; Rubio, 2009). The survey included: age, sex, use of water and home water management, water consumption frequency, perception of water temperature, and visible health effects related to exposure to high F- contents, such as dental fluorosis, using Dean’s Index. Exposure routes other than drinking water were not taken into account, e.g. consumption of fluoridated salt, food supplements, and toothpaste, although they could be considered. The people surveyed participated voluntarily in the study with informed consent, without obtaining any sample. Their information was kept confidential, and people could freely decline to participate in the study. The information reported here has no purpose other than that of observational research involving possible factors associated with the generation of fluorosis. The research protocol was approved by a bioethics committee of the UNAM.
The sample size was calculated according to statistical criteria (Kish, 1982; Méndez-Ramírez, Namihira, Moreno, & Sosa-de-Martinez, 2001):
where:
n’ |
estimated sample size |
z 2 |
the x-axis of the normal curve that bounds area α at the tails (1- α equals the desired 95% confidence level) |
p |
estimated proportion of an attribute that is present in the population, p varies between 0.4 and 0.6 |
q |
1-p |
e% |
desired level of precision. An error of 5% is acceptable. For adjustment reasons, 5.33 was chosen (Gómez, 1990) |
The former equation can be adjusted to define the sample size of the population to be surveyed based on the size of the total population living in the communities:
where:
n’’ |
sample size adjusted to a known population |
N |
selected total population of the communities (4 895) |
Replacing the proposed values:
This gives an adequate and representative sample size of 316 individuals. This sample has a confidence level of 95% and a maximum error of 5.33% for a total population of 4 895 inhabitants. The families (houses) were selected following a sequence of random numbers. The total surveyed population was 317 persons, comprised of 157 men and 160 women, which were divided into the following age groups; children from 1 to 10 years (74 people); teenagers from 11 to 15 years (25 people); young people from 16 to 25 years (65 people); adults from 26 to 50 years (111 people), and older adults over 50 years (40 people). All participants were asked about their place of residence since birth. Older relatives answered on behalf of the surveyed children. It is necessary to mention that in all the communities where the study was conducted, people worked in agricultural fields far from their homes, and many of them only spent the weekend in their houses with their families. In most cases, the father was the only one who worked all day, but in some families both parents worked. This situation resulted in some communities not having people present to participate in the surveys. In addition, in some communities, such as Dulces Nombres, people were reluctant to participate in the surveys, while in Cerro Gordo the people participated actively. All these situations caused an imbalance in the size of the sample per community.
Results and discussion
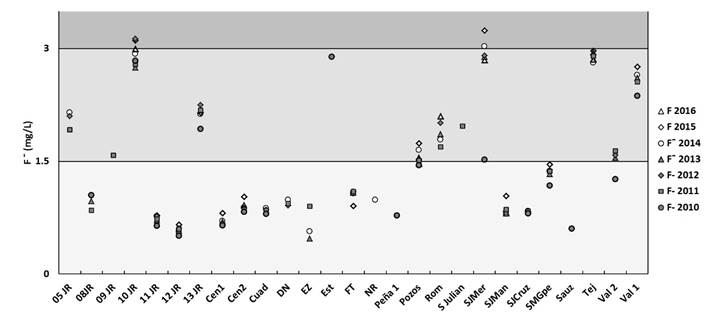
The results show the concentrations of fluoride in the wells sampled from 2010 to 2016 (Figure 3). They also include essential data to calculate the fluoride exposure estimate. Results reported include temperature, electrical conductivity, total dissolved solids, pH, and water hardness . Wells with higher temperature and lower hardness had high F- contents (Figure 3), samples with a pH range of 6.61 to 8.04 and EC between 494 and 1 100 (μS/cm) had the highest F- values, and no specific trend was observed.
Monitoring campaign
Seven sampling campaigns were carried out from 2010 to 2016 (Figure 2, Table 2). In some wells, F- concentrations were greater than the acceptable concentration established by national guidelines (F-= 1.5(mg/l); NOM-127-SSA1-1994) (Table 2).
Table 2 Flouride concentrations and physiochemical parameters of water samples.
| well | Temp °C (average) | CE (μS/cm) | pH | Hardness (mg/L) | TDS (mg/l) | Fˉ (mg/l) 2016 | Fˉ (mg/l) 2015 | Fˉ (mg/l) 2014 | Fˉ (mg/l) 2013 | Fˉ (mg/l) 2012 | Fˉ (mg/l) 2011 | Fˉ (mg/l) 2010 |
|---|---|---|---|---|---|---|---|---|---|---|---|---|
| 05 JR | 34.0 | 751 | 7.27 | 114.7 | 423.0 | 2.15 | 2.1 | 1.92 | ||||
| 08JR | 30.3 | 970 | 7.3 | 0.972 | 1.05 | 0.85 | 1.05 | |||||
| 09 JR | 29.5 | 610 | 7.13 | 1.58 | ||||||||
| 10 JR | 38.0 | 590 | 6.82 | 47.0 | 358.2 | 3 | 3.11 | 2.93 | 2.75 | 3.13 | 2.79 | 2.84 |
| 11 JR | 27.3 | 629 | 6.86 | 153.3 | 362.2 | 0.78 | 0.768 | 0.715 | 0.77 | 0.73 | 0.64 | |
| 12 JR | 26.1 | 660 | 6.7 | 143.6 | 321.3 | 0.66 | 0.569 | 0.58 | 0.603 | 0.6 | 0.51 | |
| 13 JR | 32.4 | 594 | 6.61 | 113.5 | 356.3 | 2.15 | 2.13 | 2.18 | 2.25 | 2.18 | 1.93 | |
| Cen1 | 25.9 | 881 | 6.76 | 0.81 | 0.706 | 0.694 | 0.672 | 0.648 | ||||
| Cen2 | 27.7 | 955 | 6.84 | 407.7 | 1.03 | 0.888 | 0.918 | 0.876 | 0.86 | 0.827 | ||
| Cuad | 26.0 | 861.5 | 6.73 | 0.874 | 0.854 | 0.85 | 0.799 | |||||
| DN | 33.6 | 459 | 6.31 | 102.8 | 282.4 | 0.984 | 0.911 | 0.94 | ||||
| EZ | 24.3 | 646 | 7.16 | 118.5 | 371.3 | 0.569 | 0.471 | 0.9 | ||||
| Est | 50.0 | 2.89 | ||||||||||
| FT | 37.5 | 595 | 7.32 | 74.8 | 348.9 | 0.908 | 1.07 | 1.08 | 1.1 | 1.1 | ||
| NR | 34.0 | 473 | 6.42 | 127.3 | 281.9 | 0.984 | ||||||
| Peña 1 | 29.0 | 0.78 | ||||||||||
| Pozos | 46.7 | 648 | 7.11 | 60.3 | 333.1 | 1.47 | 1.74 | 1.65 | 1.55 | 1.53 | 1.51 | 1.45 |
| Rom | 39.9 | 577 | 8.04 | 14.0 | 357.2 | 2.1 | 1.79 | 1.86 | 2.01 | 1.69 | ||
| S Julian | 40.9 | 1.97 | ||||||||||
| SJMer | 48.4 | 494 | 7.52 | 36.3 | 363.3 | 2.85 | 3.24 | 3.03 | 2.89 | 2.91 | 1.52 | |
| SJMan | 26.2 | 781.5 | 7.15 | 0.811 | 1.04 | 0.821 | 0.828 | 0.86 | ||||
| SJCruz | 28.5 | 696 | 6.76 | 246.5 | 335.1 | 0.838 | 0.826 | 0.84 | 0.806 | |||
| SMGpe | 29.2 | 576 | 7.36 | 49.0 | 369.5 | 1.46 | 1.37 | 1.33 | 1.38 | 1.37 | 1.18 | |
| Sauz | 26.0 | 0.602 | ||||||||||
| Tej | 46.3 | 517 | 7.32 | 40.1 | 334.8 | 2.86 | 2.97 | 2.81 | 2.95 | 2.92 | 2.9 | |
| Val 2 | 29.9 | 1100 | 7.27 | 1.55 | 1.58 | 1.64 | 1.26 | |||||
| Val 1 | 32.0 | 660 | 7.14 | 46.6 | 345.7 | 2.76 | 2.65 | 2.61 | 2.56 | 2.37 |
Estimation of exposure to fluoride (EEF)
The fluoride concentrations in the groundwater samples from the rural communities were used to calculate the EEF, taking into account standard values for individual body mass, water consumption patterns, and age ranges, as suggested by ATSDR (ATSDR, 2003; ATSDR, 2016) (Table 3). The bioavailability of fluorides was considered to be total and drinking water was considered to be the only source of ingestion of fluorides.
Table 3 Estimation of exposure to fluoride at different villages (age and weight ranges from Environment Canada, 1993). EEF (mg/kg/day).
| Wells | Fˉ (mg/L) | EEF 0-0.5 years | EEF 0.5-4 years | EEF 5-11 years | EEF 12-19 years | EEF Adults |
|---|---|---|---|---|---|---|
| W(ind) kg) | 6 | 13 | 27 | 55 | 70 | |
| C(H2O) (l/d) | 0.1 | 0.8 | 1.1 | 1.1 | 1.5 | |
| CG | 3 | 0.05 | 0.18 | 0.12 | 0.06 | 0.06 |
| Val | 2.36 | 0.04 | 0.15 | 0.1 | 0.05 | 0.05 |
| Gpe | 1.37 | 0.02 | 0.08 | 0.06 | 0.03 | 0.03 |
| DN | 0.94 | 0.02 | 0.06 | 0.04 | 0.02 | 0.02 |
| SJCruz | 0.602 | 0.01 | 0.04 | 0.02 | 0.01 | 0.01 |
| BV | 0.51 | 0.01 | 0.03 | 0.02 | 0.01 | 0.01 |
The results were used to perform an analysis of fluoride exposure. To this end, the intake thresholds for the toxic effects of a substance when an individual is subjected to chronic oral exposure were considered, as suggested by the ATSDR (ATSDR, 1993; ATSDR, 2003; ATSDR, 2016). The results obtained from the monitored wells indicate that the population has been chronically exposed (more than one year), and therefore, the intake limits corresponded to the oral reference dose (RfD), where the order of magnitude was an estimate of the daily exposure that an individual could have to a toxic substance throughout its existence without presenting any organ damage, the maximum intake of a toxin by a human being without presenting adverse clinical manifestations (NOAEL), and the minimum intake of the toxic agent that causes adverse clinical manifestations in the exposed individual (LOAEL).
The ATSDR (ATSDR, 1993; ATSDR, 2003) threshold for observing skeletal effects (increase in fractures) is 0.15 mg fluoride/kg/day for NOAEL and 0.25 mg fluoride/kg/day for LOAEL. For NOAEL, the value is divided by an uncertainty factor of 3 to take into account the variability in humans. An RfD of 0.05 mg/kg/day was thereby obtained. In terms of the cosmetic effects of dental fluorosis, the EPA (IRIS, 2003) value for RfD is 0.06 mg/kg/day for fluoride, based on a NOAEL value of 0.06 mg/kg/day and a LOAEL value of 0.12 mg/kg/day. The NOAEL value was divided by an uncertainty factor of 1 to obtain the RfD. In this work, RfD values of 0.05 mg/kg/day and 0.12 mg/kg/day were considered to be levels at which health effects could be observed. Given the previous values, if an EEF > 0.05(mg/kg/day is obtained then exposed individuals may develop dental fluorosis, depending on the magnitude, dose, and exposure time. This value represents the minimum level of risk calculated by ATSDR (ATSDR, 2003; ATSDR, 2016) for chronic oral exposure, and is considered to be the toxic threshold at which dental fluorosis appears. If the value obtained is EEF > 0.12 mg/kg/day and the exposure time is much longer than 15 years, the individual presents a potential risk of developing skeletal fluorosis (ATSDR, 2003; ATSDR, 2016; IRIS, 2003). This value represents a level of risk of developing skeletal fluorosis considering the daily dose of oral exposure, estimated per day.
In Cerro Gordo, Valencia, Dulces Nombres, and Santa Maria Guadalupe, the calculated EEF exceeded the level of 0.05 mg/kg/day for different age ranges (Table 3). Thus, these communities were at potential risk of developing dental fluorosis. In Cerro Gordo and Valencia, the calculated EEF exceeded 0.12 mg/kg/day, mainly for children (Table 3). This means that children were at potential risk of developing skeletal fluorosis. It should be noted that excessive exposure to fluorides can cause diverse effects, the most prevalent being dental fluorosis. In fact, it has been verified that the prolonged consumption of water with contents over 1.5 mg/l of F- is a cause of dental fluorosis.
Epidemiological survey without biomarkers
Consumption patterns related to water ingestion were analyzed to get a general view of the role of drinking water in health risks for developing dental and skeletical fluorosis. Most of the surveyed population (97.2%) was connected to the local drinking water network. The water was pumped from deeps wells in each rural town. These wells were controlled by the JR Municipal Drinking Water Committee (CMAPAJ), which has operated since 1995. Fifty-five percent (175 people) drank water directly from the wells, and 44.80% (142 people) drank treated water sold in large jugs, soft drinks, or bottled water (2 liters or less). These data coincide with the estimated average proposed by ATSDR (ATSDR, 2003; ATSDR, 2016).
Groundwater was treated and sold by local companies using adequate treatment systems. The state’s Ministry of Health monitored the quality and treatment methods. The local water treatment plants generated wastes with high concentrations of F-, whose disposal method is unknown.
Water was also consumed for meal preparation. In this regard, 79.20% (251 people) used well water for meals, whereas 20.80% (66 people) used treated water for cooking (Figure 4a). Ninety percent (285 people) perceived the temperature of the well water to be high. This may correspond to high fluoride concentrations since fluoride in groundwater in JR has a geogenic origin related to the hydrogeological structure and the geothermal activity observed in some parts of the aquifer (Rodríguez et al., 2016; Morales-Arredondo, Rodríguez, Armienta, & Villanueva-Estrada, 2016a). Groundwater temperatures varied from 25.5 to 50°C; the highest values corresponded to wells located near faults and fractures, which also had the highest concentrations of F- (Morales-Arredondo, Rodríguez, Armienta, & Villanueva-Estrada, 2016b).
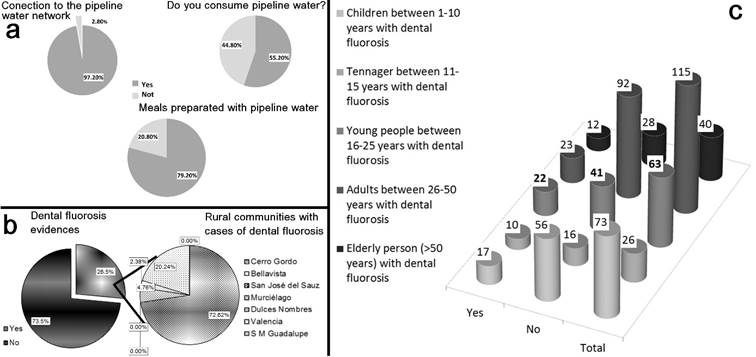
Figure 4 a) Water used from the drinking network, b) population with dental fluorosis, by rural community (CG = Cerro Gordo; BV = Bellavista; SJS = San José del Sauz; M = Murciélago; DN = Dulces Nombres; V = Valencia; SMG = Santa Maria Guadalupe), c) population with symptoms related to dental fluorosis, by age ranges.
A total of 233 people (73.5%) from the total surveyed population did not show signs of dental fluorosis, but they prepared meals with well water and have lived in the same area for more than 10 years. A total of 84 individuals (26.5%) presented dental fluorosis, most of whom lived in Cerro Gordo (72.62%; 61 cases) and Valencia (20.24%; 17 cases) (Figure 4b). Wells in these communities presented the highest F- concentrations (Figure 1, Figure 2, Figure 3). In addition, the people who were surveyed in these communities perceived the temperature of the water supplied directly from the wells to be high. Furthermore, in this area, people consumed water directly from the faucet and used that water to prepare meals, and/or had lived in the area for more than 10 years. These conditions present a risk of developing skeletal fluorosis (EPA, 2011). This information confirms the EEF values obtained.
Some authors have reported that children and elderly people may be more vulnerable to developing dental fluorosis (Soto-Rojas et al., 2004; Betancourt-Lineares et al., 2013), though the present study showed that the age of more than 50% of people with dental fluorosis was wide, from teenage to adulthood (between 16 to 50 years old). This situation could be due to the consumption of groundwater from wells containing high fluoride concentrations. Although no historical information was found about groundwater fluoride levels, it is likely that people have consumed this fluoride-rich water since the wells began operation about 20 years ago. These results may be related to the particular pattern of water consumption. The same number of people affected was identified in men and women, showing a lack of evidence of an influence of sex on fluorosis. Groundwater was also used for irrigation and livestock (goats, sheep, pigs, and chickens). Fluoride may accumulate in some animals and plants (Kumpulainen & Koivistonen, 1977; Toth & Sugar 1978; Koivistonen, 1980; EPA, 2011), which constitutes another route of exposure in the area to take into account. It would be convenient to carry out a process of removal of fluorides from well water. In the study area, the presence of deposits of kaolinite and clay material, such as zeolites, has been reported, as well as limestone from the Soyatal Formation (CEAG, 2000; INEGI, 2017). Experimentally, these materials have provided good results in terms of a decrease in high contents of F- in groundwater (Montiel-Cota, Balcázar-Meza, Fernández-Ramírez, Morales-Munguía, & Varela-Salazar, 2013; Valenzuela, Ramírez-Hernández, Sol, & Reyes, 2011; Calderón-Molgora, Quezada-Jiménez, Segura-Beltrán, & Hernández-Yañez, 2012; Labastida et al., 2017).
Conclusions
Fluoride concentration results showed that inhabitants from some small towns in JR were exposed to groundwater with high F- concentrations. The EEF evaluation and the epidemiology survey suggest that Cerro Gordo, Valencia, Guadalupe, and Dulces Nombres showed a potential risk of consuming water with F- concentrations, in excess of the estimated minimum risk level for ingestion. These results support the value obtained from the epidemiology survey, which showed evidence of dental fluorosis in 25% of the total surveyed population, due to direct consumption and/or meal preparation with contaminated water. Results indicate a relation between age and dental fluorosis up to 50 years of age, where young and middle-aged people were the population groups showing most cases of dental fluorosis. This may be due to being exposed to high F- concentrations in groundwater for a long period of time. It is not clear why older people do not have dental fluorosis, but a possible cause may be population growth, increased extraction of poor groundwater quality in the zone.
Communities know about the presence of F- in water, and the general perception is that F- is only an aesthetic problem and associated with chlorination. People continue drinking well water at their homes. The urban area was not initially included in the study because they rely more on treated water due to a better economical situation, but some urban wells containing F- supply the downtown zone. The monitoring and sampling campaign are currently ongoing, and high F- values persist in the entire zone.
Future studies must also include urban populations in order to have a more complete perspective of the problems related to groundwater consumption in the area. A better impact assessment must focus on a more detailed health evaluation, including chemical analyses of organic fluids.
Acknowledgements
The authors thank DGAPA UNAM for financial support, Grant IN102113. Olivia Cruz, Alejandra Aguayo, and Nora Ceniceros are acknowledged for their participation in the chemical analyses. Personnel from the JR Municipal Drinking Water Committee (CMAPAJ) facilitated access to the wells. We thank Flores-Ocampo IZ and Flores-Vargas R. for their participation in the sampling campaigns
REFERENCES
American Public Health Association, American Water Works Association, Association Water Environment Federation, APHA-AWWA-WWF. (2005). Standard methods for the Examination of Water and Wastewater. Washington, DC, USA: American Public Health Association, American Water Works Association, Association Water Environment Federation. [ Links ]
Agency for Toxic Substances and Disease Registry, ATSDR. (1993). Toxicological profile for fluoride, hydrogen fluoride, and fluorine (F). Atlanta, USA: Department of Health and Human Services, Public Health Service, Agency for Toxic Substances and Disease Registry. [ Links ]
Agency for Toxic Substances and Disease Registry, ATSDR. (2003). Toxicological profile for fluoride, hydrogen fluoride, and fluorine (F). Recovered from https://www.atsdr.cdc.gov/toxprofiles/tp11-c3.pdf [ Links ]
Agency for Toxic Substances and Disease Registry, ATSDR. (2016). Resúmenes de salud pública (fluoruros, fluoruros de hidrógeno, flúor). Recuperado de https://www.atsdr.cdc.gov/es/phs/es_phs11.html [ Links ]
Alarcón-Herrera, M. T., Martín-Domínguez, I. R., Trejo-Vázquez, R., & Rodríguez-Dozal, S. (2001). Well water fluoride, dental fluorosis, and bone fractures in the Guadiana Valley of Mexico. Fluoride, 34(2), 139-149. [ Links ]
Armienta, M. A., & Segovia, N. (2008). Arsenic and fluoride in the groundwater of Mexico. Environmental Geochemistry and Health, 30, 345-353. [ Links ]
Betancourt-Lineares, A., Irigoyen-Camacho, M. E., Mejía-González, A. M., Zepeda-Zepeda, M., & Sánchez-Pérez, L. (2013). Prevalencia de fluorosis dental en localidades mexicanas ubicadas en 27 estados y el D.F. a seis años de la publicación de la Norma Oficial para la fluoruración de la sal. Revista de Investigación Clínica, 65(3), 237-247. [ Links ]
Calderón-Mólgora, C., Quezada-Jiménez, M. L., Segura-Beltrán, N., & Hernández-Yañez, C. (febrero-marzo, 2012). Remoción de arsénico mediante procesos de membrana. Tecnología y Ciencias del Agua, 3(número especial), 37-51. [ Links ]
Cerca-Martínez, L. M., Aguirre-Díaz, G. J., & López-Martínez, M. (2000). The geological evolution of the southern Sierra de Guanajuato; a documented example of the transition from the Sierra Madre Occidental to the Mexican Volcanic Belt. International Geology Review, 42, 131-151. [ Links ]
Cervantes-González, M. E., Ortíz-Burgos, J. J., & Wilbert-Ovalle, J. (1998). Concentración de flúor de ppm de los pozos de agua potable y agua embotelladas de la ciudad de Salamanca, Guanajuato. Revista de la Asociación Dental Mexicana, 55(1), 18-20. [ Links ]
Comisión Estatal del Agua de Guanajuato, CEAG. (2000). Actualización del balance subterráneo de los acuíferos de Guanajuato. Reporte Interno. Guanajuato, México: Comisión Estatal del Agua de Guanajuato. [ Links ]
Díaz-Barriga, F., Navarro-Quezada, A., Grijalva, M. I., Grimaldo, M., Loyola-Rodríguez, J. P., & Ortíz, M. D. (1997). Endemic fluorosis in México. Fluoride, 30(4), 233-239. [ Links ]
Environment Canada. (1993). Canadian environmental protection act priority substances list assessment report: Arsenic and its compounds. Ottawa, Canada: Canada Communication Group. [ Links ]
Environmental Protection Agency, EPA. (2011). Community water fluoridation, frecuently asked questions. Recovered from https://www.epa.gov. [ Links ]
Dean, H. T. (1934). Classification of mottled enamel diagnosis. JADA, The Journal of the American Dental Association, 21(8), 1421-1426. [ Links ]
Gómez, J. (1990). Metodología de encuestas por muestreo. En: Arnau, J., Angera, M. T., & Gómez, J. (eds.). Metodología de la investigación en ciencias del comportamiento (239-309 pp.). Murcia, España: Universidad de Murcia. [ Links ]
Griffin, S. O., Beltran, E. D., Lockwood, S. A., & Barker, L. K. (2002). Esthetically objectionable fluorosis attributable to water fluoridation. Community Dentistry and Oral Epidemiology, 30, 199-209. [ Links ]
Grijalva-Haro, M. I., Barba-Leyva, M. E., & Laborín-Alvarez, A. (2001). Ingestión y excreción de fluoruros en niños de Hermosillo, Sonora, México. Salud Pública de México, 43(2), 127-134. [ Links ]
Grimaldo, M., Borja-Aburto, V. H., Ramírez, A. L., Ponce, M., Rosas, M., & Díaz-Barriga, F. (1995). Endemic fluorosis in San Luis Potosi, Mexico: I. Identification of risk factors associated with human exposure to fluoride. Environmental Research, 68, 25-30. [ Links ]
Hurtado-Jiménez, R., & Gardea-Torredey, J. (2005). Estimación de la exposición a fluoruros en Los Altos Jalisco, México. Salud Pública de México, 47(1), 58-63. [ Links ]
Instituto Nacional de Estadística y Geografía, INEGI. (2017). Anuario Estadístico y Geográfico de Guanajuato 2016. Guanajuato, México: Instituto Nacional de Estadística y Geografía, Gobierno del Estado de Guanajuato. [ Links ]
Integrated Risk Information System, IRIS. (2003). Fluorine (soluble fluoride). Washington, DC, USA: Integrated Risk Information System, U.S. Environmental Protection Agency. [ Links ]
Kish, L. (1982). Muestreo de encuestas (3ª reimp.). México, DF, México: Editorial Trillas. [ Links ]
Koivistonen, P. (1980). Mineral element composition of Finnish foods. Acta Agriculturae Scandinavica, 22, 1-171. [ Links ]
Kumpulainen, J., & Koivistonen, P. (1977). Fluorine in foods. Residue Reviews, 68, 37-57. [ Links ]
Labastida, I., Armienta, M. A., Beltrán, M., Caballero, G., Romero, P., & Rosales, M. A. (2017). Limestone as a sustainable remediation option for water contaminated with fluoride. Journal of Geochemical Exploration. Recuperado de http://dx.doi.org/10.1016/j.gexplo.2016.12.001, 2017 [ Links ]
Levy, D. B., Schramke, J. A., Esposito, K. J., Erickson, T. A., & More, J. C. (1999). The shallow groundwater chemistry of arsenic, fluorine, and major elements: Eastern Owens Lake, California. Applied Geochemistry, 14, 53-65. [ Links ]
McDonagh, M. S., Whiting, P. F., Wilson, P. M., Sutton, A. J., Chestnutt, I., Cooper, J., Misso, K., Bradley, M., Treasure, E., & Kleijinen, J. (2000). Systematic review of water fluoridation (CRD Report 18). Heslington, UK: NHS Centre for Reviews and Dissemination. [ Links ]
Mendoza, E. (1999). Diagnóstico de la calidad del agua potable en las zonas urbanas del estado de Guanajuato (tesis de Maestría en Protección y Conservación Ambiental). Universidad Iberoamericana, León, Guanajuato, México. [ Links ]
Montiel-Cota, A., Balcázar-Meza, M., Fernández-Ramírez, M. V., Morales-Munguía, J. C., & Varela-Salazar, J. (2013). Eliminación de flúor en agua potable utilizando zeolita natural (Clinoptilolita). Biotecnia, 15(2), 10-14. [ Links ]
Morales, I., Villanueva-Estrada, R. E., Rodríguez, R., & Armienta, M. A. (2015). Geological, hydrogeological, and geothermal factors associated to the origin of arsenic, fluoride, and groundwater temperature in a volcanic environment “El Bajío Guanajuatense” Mexico. Environmental Earth Sciences, 74, 5403-5415. [ Links ]
Morales-Arredondo, I., Rodríguez, R., Armienta, M. A, & Villanueva-Estrada, R. E. (2016 a). A low-temperature geothermal system in central Mexico: Hydrogeochemistry and potential heat source. Geochemical Journal, 50(3), 211-225. [ Links ]
Morales-Arredondo, I., Rodríguez, R., Armienta, M. A., & Villanueva-Estrada, R. E. (2016b). The origin of groundwater arsenic and fluorine in a volcanic sedimentary basin in central Mexico: a Hydrochemistry hypothesis. Hydrogeology Journal, 25(1), 1-16. [ Links ]
Méndez-Ramírez, I., Namihira, G. D., Moreno, L., & Sosa-de-Martinez, C. (2001). El protocolo de investigación: lineamientos para su elaboración y análisis. México, DF, México: Editorial Trillas . [ Links ]
NOM-127-SSA1-1994: Norma Oficial Mexicana "Salud ambiental, agua para uso y consumo humano-límites permisibles de calidad y tratamientos a que debe someterse el aguapara su potabilización" (Modificada 2000). 1-7. [ Links ]
NOM-230-SSA1-2002: Norma Oficial Mexicana. "Salud ambiental. Agua para uso y consumo humano, requisitos sanitarios que se deben cumplir en los sistemas de abastecimiento públicos y privados durante el manejo del agua. Procedimientos sanitarios para el muestreo". Recuperada de http://www.salud.gob.mx/unidades/cdi/nom/230ssa102.html [ Links ]
Orozco-Esquivel, M. T., Nieto-Samaniego, A. F., & Alaniz-Alvarez, S. A. (2002). Origin of rhyolitic lavas in the Mesa Central, Mexico, by crustal melting related to extension. Journal of Volcanology and Geothermal Research, 118, 37-56. [ Links ]
Ortíz-Burgos, M., Vargas-Garcidueñas, D., & Ovalle-Castro, J. (nov.-dic., 1996). Fluorosis dental de la población escolar de Salamanca Guanajuato. Revista ADM, Órgano Oficial de la Asociación Dental Mexicana, 53(6), 289-294. [ Links ]
Ortíz, D., Castro, L., Turrubiates, F., Milan, J., & Díaz-Barriga, F. (1998). Assessment of the exposure to fluoride in drinking water from Durango, Mexico, using a Geographic Information System. Fluoride, 31(4), 183-187. [ Links ]
Petersen, E., Essene, D., & Peacor, D. (1982). Fluorine end-member micas and amphiboles. American Mineralogist, 67, 538-544. [ Links ]
Quintero, O. (1999). Evolución geológica del extremo noroccidental de la Sierra de Guanajuato. Instituto de Geología, UNAM. Resúmenes y Guía de Excursiones. Simposio sobre la Geología de la Sierra de Guanajuato, Guanajuato, México. [ Links ]
Ravishankar, S. (1987). Status of geothermal exploration in Maharashtra and Madhya Pradesh (C.R.). GSI Rec, 115(6), 7-29. [ Links ]
Rivett, M., Drewes, J., Barrett, M., Chilton, J., Appleyard, S., Dieter, H. H., Wauchope, D., & Fastner, J. (2006). Chemicals: Health relevance, transport and attenuation, in protecting groundwater for health managing the quality of drinking-water source. In: Schmon, O., Howard, G., Chilton, J., Chorus, I., & World Health Organization (eds.). Protecting groundwater for health: Managing the quality of drinking-water sources. Recuperado de http://www.who.int/iris/handle/10665/43186 [ Links ]
Rodríguez, R., Reyes, R., Rosales, J., Berlín, J., Mejía, J. A., & Ramos, A. (2001). Estructuración de mapas temáticos de índices de vulnerabilidad acuífera de la mancha urbana de Salamanca Gto. Municipio de Salamanca, reporte técnico. México, DF, México: Comisión Estatal del Agua de Guanajuato, Instituto de Geofísica-Universidad Nacional Autónoma de México. [ Links ]
Rodríguez, R., Morales, I., Armienta, A., Villanueva, R., & Segovia, N. (2015). Geothermal systems of low temperature in Mexican Highlands: Alternative uses and associated risks. Procedia Environmental Sciences, 25, 214-219. [ Links ]
Rodríguez, R., Morales-Arredondo, I., & Rodríguez, I. (2016). Geological differentiation of groundwater threshold concentrations of arsenic, vanadium and fluorine in El Bajío Guanajuatense, México. Geofísica Internacional, 55, 5-15. [ Links ]
Rubio, P. (2009). Metodología y aplicabilidad de las encuestas seroepidemiológicas; agrupación de enfermedades infecciosas y salud internacional del CIBER en epidemiología y salud pública (CIBERESP) (Taller 2009, Barcelona). Revista Especializada en Salud Pública, 83(5), 611-623. [ Links ]
Ruiz, J., Kesler, S., & Jones, L. (1985). Strontium isotope geochemistry of fluorite mineralization associated with fluorine-rich igneous rocks from The Sierra Occidental, Mexico; possible exploration significance. Economic Geology, 80, 33-42. [ Links ]
Sistema de Agua Potable y Alcantarillado de San Miguel Allende, SAPASMA. (2006). Well water quality in San Miguel de Allende Phase I: Results and conclusions. Recuperado de http://www.ecosystemsciences.com/Portals/0/pdfs/Drinking%20Water%20Quality%20in%20San%20Miguel,%20Mexico.pdf [ Links ]
Soto-Rojas, A. E., Ureña-Cirret, J. L., & Martinez-Mier, E. A. (2004). A review of the prevalence of dental fluorosis in Mexico. Revista Panamericana de Salud Pública, 15, 9-17. [ Links ]
Toth, K., & Sugar, E. (1978). Fluorine content of foods and the estimated daily intake from foods. Acta Physiologica, 51, 361-369. [ Links ]
Trejo-Vázquez, R., & Bonilla-Petriciolet, A. (2001). Exposición a fluoruros del agua potable en la ciudad de Aguascalientes, México. Pan American Journal of Public Health, 10(2), 108-113. [ Links ]
Valenzuela, L., Ramírez-Hernández, J., Sol, J. A., & Reyes, J. A. (2011). Alternativas para la eliminación doméstica de flúor en el agua de consumo humano. Información Tecnológica, 22(2), 23-32. [ Links ]
Received: March 25, 2017; Accepted: November 08, 2017
 Este es un artículo publicado en acceso abierto bajo una licencia
Creative Commons
Este es un artículo publicado en acceso abierto bajo una licencia
Creative Commons
