


 texto en
  Inglés (pdf)
 Artículo en XML
 Referencias del artículo
 Enviar artículo por email
 Citado por SciELO
  Similares en
SciELO
Similares en
SciELO 
 Permalink
Introduction
Prediction of temperature changes due to variations in streamflow and locations along the stream, as well as anthropogenic changes, is frequently needed to assess the impacts of potential management decisions related to fish life in the stream (Poole & Berman, 2001). Although average daily temperatures are helpful, the diurnal changes are often critical, including the maximum and minimum temperatures, creating the need to simulate temperatures using a time step smaller than one day (Stella, 2007). A number of existing models have been developed to predict stream temperatures. Many of the dynamic, physically-based models require extensive data inputs and calibration, most were also developed for large river systems to assess management alternatives such as reservoir release impacts (Stella, 2007). The physically-based water Stream Segment Temperature model, SSTemp (Bartholow, 2002), is a simplified version of the Stream Network Temperature model (SNTemp) created by Theurer (Theurer, Voos, & Miller, 1984). Only two studies have been conducted using water temperature simulation models for the study of water temperatures in small streamflows under low-flow conditions such as the Fenton River. One was on the Truckee River in California using the RTS model (Rowell, 1975) with a monthly time step (Deas, 2000). The other was in the Upper Chama River in New Mexico using SSTemp model with a daily time step (Surface Water Quality Bureau, 2003). The stream Water Temperature Simulation (WTS) model is the only model that uses an hourly time step to simulate water temperature under low-flow conditions that are typical of summer seasons in New England (Stella, 2007). Stella (2007) developed a simple, physically-based stream Water Temperature Simulation Model (WTS) as a function of water and energy fluxes using a dynamic, coupled mass and energy balance approach to apply to moderate flows such as the Fenton River in Connecticut, using a one hour time step. The purpose of this research was to apply two dynamic mathematical models ―WTS and SSTemp― to predict changes in water temperatures in small, free-flowing rivers. The Fenton River, located in eastern Connecticut, is one such river where summer flows and temperature variations and extremes are especially critical to aquatic organisms, including trout (Warner, Ogden, Bagtzoglou, & Parasiewicz, 2006).
Material and methods
Description of the study site
The Fenton River is located in eastern Connecticut (Figure 1) and is one of three third-order tributaries entering Mansfield Hollow Lake. The other two tributaries are the Mount Hope and Natchaug Rivers. The Fenton River watershed has a total length of 22.8 km and a drainage area of 88.9 km2 (Warner et al., 2006) upstream from the Mansfield Hollow Lake. The scope of interest for this study is the portion of the river that extends from Old Turnpike Bridge to the Chaffeeville Bridge, for a total distance of 4.040 km.
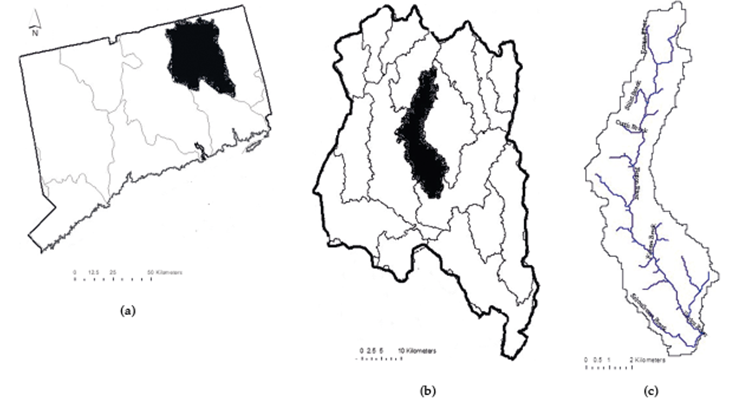
Figure 1 a) The state of Connecticut and the west branch of the Thames River watershed, b) the west branch of the Thames River watershed and the Fenton River watershed (in black) and c) the Fenton River watershed and the area of interest (circled).
Areas that are upland from the Fenton River Basin are characterized by thick glacial tills with moderate slopes. These drain into the river valleys, which are typically filled with glacial outwash deposits consisting of stratified layers of sands and gravel (Leggete Brashears and Graham Inc., 2001; Warner et al., 2006). Stream baseflow during non-rainfall periods in summer is generally fed from shallow groundwater found in the stratified materials along the streams (Warner et al., 2006). Mean annual precipitation in northeast Connecticut is approximately 1 140 mm (USGS, 1998), and the average runoff is roughly 631 mm, based on USGS gage #01121000 located at the Mount Hope River near Warrenville, CT (USGS, 1998). The difference of 509 mm is assumed to be evapotranspiration, infiltration rate and capacity within the watershed. The most popular fish species in the Fenton River, by order of abundance, are: blacknose dace (Rhinichthys atratulus), white sucker (Catostomus commersoi), fallfish (Semotilus corporalis), and tessellated darter (Etheostoma olmstedi) (Warner et al., 2006).
Field methods
Field data was applied and used to calibrate the WTS and SSTemp models, including stream flow, water temperature, river cross-sections and vegetation density. Weather data was used to run the model, such as solar radiation and air and soil temperatures, which were obtained from the University of Connecticut Agronomy Farm, 5 km south of the study area. Three sites with different canopy conditions were monitored for discharge and temperature within the scope of interest along the Fenton River, at five points, and recorded at hourly time steps. The first site extends from Old Turnpike Bridge to 120 m downstream and is referred to as Turnpike. The second site extends from the upper end of Meadows to the downstream end of Meadows, it is 822 meters long and is referred to as Meadows. The third site covers the section from the Old Turnpike Bridge to the downstream end of Meadows, with a total distance of 1.948 km, and is referred to as Turnpike-Meadows. The vegetative cover at the Turnpike site is a high density forested area while the Meadows site is a bare land surface, and the Turnpike-Meadows site has mixed canopy conditions with high-density forested area from Old Turnpike Bridge to upstream Meadows and bare land surface in Meadows.
WTS water temperature simulation model: Theory and assumptions
The water temperature simulation (WTS) model coupled two components (Stella, 2007), water balance and energy balance, using STELLA® software (Onset Computer Company, 2006). The development of the equations describing the mass and energy fluxes needed for the mathematical model were obtained from Stella (Stella, 2007).
SSTemp water temperature simulation model: theory and assumptions
The SSTemp model assumes only a one-dimensional and mixed system that includes heat flux and heat transport to calculate the water temperature over time (Sansone & Lettenmaier, 2001). Average stream geometry is used for the calculations, unless there is a dam at the upstream end of the stream. Lateral inflow is uniformly distributed throughout the segment length (Bartholow, 2002). The SSTemp model uses a one-day time-step and all inputs are given in terms of a daily value, and does not allow either Manning's n or travel time to vary as a function of flow (Surface Water Quality Bureau, 2003). The physical processes in the SSTemp include convection, conduction, evaporation, and heat to or from the air (long wave radiation), as well as direct solar radiation (short wave) and radiation reflected back from the water.
Results and discussion
Stream water temperature simulation
Figure 2 shows the hourly observed temperature, SSTemp, and WTS simulated stream water temperatures at the Turnpike site from July 1 to August 19, 2004.
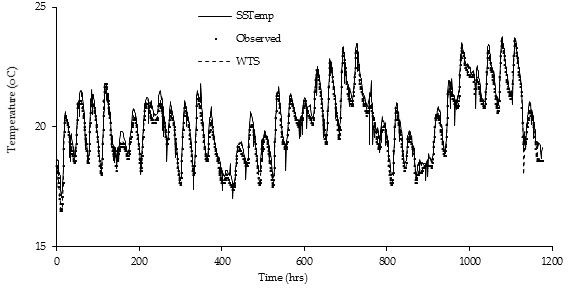
Figure 2 Hourly observed temperature, SSTemp, and WTS simulated stream water temperatures at Turnpike site from July 1 to August 19, 2004.
Figure 3 shows the hourly observed temperature, SSTemp, and WTS simulated stream water temperatures at the Turnpike-Meadows site from July 12 to July 23, 2004.
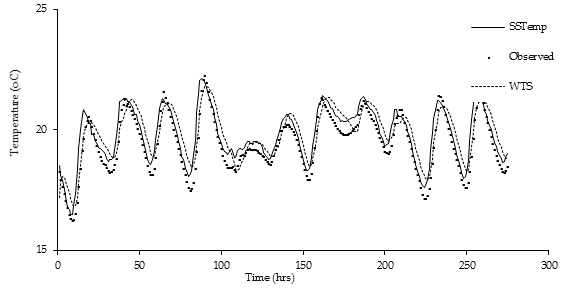
Figure 3 Hourly observed temperature, SSTemp, and WTS simulated stream water temperatures at Turnpike-Meadows site from July 12 to July 23, 2004.
Figure 4 shows the hourly observed temperature, SSTemp, and WTS simulated stream water temperatures at Meadows site from August 2 to September 3, 2005.

Statistical analysis
The R-squared (R 2) linear regressions and the Nash-Sutcliffe coefficient (NS) methods were used to analyze and compare the results obtained during the simulations. A summary of the R-squared results is shown in Table 1 for the simulations using SSTemp and WTS and the observed water temperature for Turnpike and Turnpike-Meadows in 2004 and Meadows in 2005.
To analyze and compare the hourly observed and simulated daily maximum water temperatures the method of R-squared (R 2) linear regressions was applied. A summary of the results obtained from the maximum water temperature simulated with the SSTemp and WTS models and the observed maximum water temperature is shown in Table 2, to compare the efficiency of both models for Turnpike and Turnpike-Meadows in 2004 and Meadows in 2005.
Table 2 R-squared for Turnpike and Turnpike-Meadows in 2004 and Meadows in 2005.
| Turnpike 2004 | Turnpike-Meadows 2004 | Meadows 2005 | |
|---|---|---|---|
| SSTemp | 0.996 | 0.917 | 0.935 |
| WTS | 0.996 | 0.932 | 0.913 |
The simulation performed at the Turnpike site in 2004 is for a zone with a high-density canopy. The R-squared was over 0.97 and the Nash-Sutcliffe coefficient was over 0.97. The trend line for these simulations shows that both models underestimate the water temperature peaks: the slope was 0.994 for SSTemp and 0.988 for WTS. For the daily maximum water temperature, both models produced an R-squared of 0.99 with a trend line slope of 1.0 for SSTemp and 0.994 for WTS. For the simulation performed at Turnpike-Meadows in 2004, where the zone has high density canopy between Old Turnpike Bridge and upstream Meadows and low density canopy between upstream Meadows and downstream Meadows, the R-squared was over 0.91 and the Nash-Sutcliffe coefficient over 0.83. The trend line for these simulations shows that both models underestimate the water temperature peaks: the slope was 0.893 for SSTemp and 0.88 for WTS. For the daily maximum water temperature, both models produced a R-squared over 0.91 with a trend line slope of 0.89 for SSTemp and 0.88 for WTS. For the simulation performed at Meadows in 2005, a zone with a low density canopy, the R-squared was over 0.89 and the Nash-Sutcliffe coefficient was over 0.89. The trend line for these simulations show that both models underestimate the water temperature peaks: for SSTemp the slope was 0.947 and for WTS 0.89. For the daily maximum water temperature performed at Turnpike, Turnpike-Meadows in 2004 and Meadows in 2005, both models produced an R-squared over 0.91 with a trend line slope of 0.79 for SSTemp and 0.69 for WTS.
Conclusions
Both SSTemp and WTS water simulation models simulated with high accuracy the hourly water temperature in the Fenton River for low, high and mixed canopy conditions, with an R-squared over 0.895.
SSTemp performed well as an hourly simulation model even though it was designed for daily time-steps.
Both SSTemp and WTS water simulation models simulated the daily maximum water temperature in the Fenton River with high accuracy, with an R-squared higher than 0.91 for low, high and mixed canopy conditions.
Both SSTemp and WTS water simulation models underestimated the daily maximum water temperature. Except for the Turnpike site in 2004, the SSTemp model was consistent with daily maximum water temperatures.
Even though WTS performed better than SSTemp in two of the three simulations, SSTemp is a streamflow water temperature model with a large range of applications. The SSTemp model in the three applications in this study was shown to be a reliable hourly stream water temperature model.

