


Servicios Personalizados
Revista
Articulo
 texto en
  Inglés (pdf)
 Artículo en XML
 Referencias del artículo
 Enviar artículo por email
Indicadores
-
 Citado por SciELO
 -
 Accesos
Links relacionados
-
 Similares en
SciELO
Similares en
SciELO
Compartir

 Permalink
Tecnología y ciencias del agua
versión On-line ISSN 2007-2422
Tecnol. cienc. agua vol.9 no.2 Jiutepec mar./abr. 2018 Epub 24-Nov-2020
https://doi.org/10.24850/j-tyca-2018-02-05
Articles
Agricultural competitiveness and efficient use of water in the Valley of San Quintín, Baja California, Mexico
1Universidad Autónoma de Baja California, Mexicali, México, lizaulcy@uabc.edu.mx
2Universidad Autónoma de Baja California, Mexicali, México, vdelao@uabc.edu.mx
3Universidad Autónoma de Baja California, Mexicali, México, lmorales@uabc.edu.mx
4Universidad Autónoma de Baja California, Mexicali, México, jruiz@uabc.edu.mx
This research presents the validation process for an instrument to measure water use efficiency and competitiveness variables for agricultural enterprises in Valle de San Quintin, Baja California, Mexico. Since the development of the instrument was based on reference desk research, content validation was performed by applying the model by Lawshe, and modified by Tristán (2008). Later it assessed construct validation using an exploratory factor analysis and, lastly, the instrument’s reliability was analyzed by determining the Cronbach's alpha coefficient.
Keywords Water; agriculture; research instrument; competitiveness
En este trabajo de investigación se presenta el proceso de validación del instrumento de medición para las variables uso eficiente del agua y competitividad en empresas agrícolas del Valle de San Quintín, Baja California, México. Desde la elaboración del instrumento con base en la investigación documental de referencia, se realizó la validez de contenido mediante la aplicación del modelo de Lawshe, modificado por Tristán (2008); después se llevó a cabo la validez de constructo mediante el análisis factorial exploratorio y al final se realizó el análisis de confiabilidad de instrumento mediante la determinación del coeficiente del alpha de Cronbach.
Palabras clave agua; agrícolas; instrumento; competitividad
Introduction
Water was recognized as a common good by the Resolution of the General Assembly of the United Nations on July 28, 2010 (ONU, 2010), stating that "the right to drinking water and sanitation is a human right for all, to be effective and well-known, and also accompanied by a harmonization of the national and international rules necessary for its universal application, water can not be limited to being a matter of political, technical and financial authorities: every woman and every man, regardless of their responsibilities, must participate in decisions, contribute to the protection and fair access of all to water, a common good of living beings"(ONU, 2010).
The United Nations (UN) considers the shortage of water to be one of the main challenges of the 21st century, which is affecting many societies around the world. The shortage of water is not only a natural phenomenon but it is also caused by human activities. There is enough drinking water on the planet to supply the 7,000 million people who inhabit it, but it is unevenly distributed, wasted, polluted, and managed unsustainably (ONU, 2014).
As of 2007 in Mexico, the water initiative by the National Water Commission recognizes that achieving the water balance required of surface and underground water bodies in the country in order to meet the demand of all users, including ecosystems, presents a great challenge. The 2013-2018 National Development Plan establishes a strategy to implement sustainable water management, making it possible for all Mexicans to have access to the resource, promoting sustainability without limiting development.
In Baja California, the 2014-2019 State Development Plan’s (PED) strategic diagnosis recognizes the need to increase competitiveness as well as take advantage of the water resource and ensure efficiency in its distribution and consumption. In the State of Baja California, water is used as follows: agricultural (81.05%), urban public (11.37%), industry (2.47%), other uses (5.11%) (Conagua, 2013).
The San Quintín Valley is characterized as an important agricultural center for the production of vegetables, and in general those of high market value. Approximately 90% of the crops are exported, mainly to the United States. The valley is totally dependent on the aquifers for production, and it is currently experiencing an economic crisis in the administration of water resources due to the overexploitation of the aquifers and the little investment that there is in the creation of alternatives such as new aqueducts or desalination plants, leading farmers to look for technologies for the use of water (Pombo, 2014).
The problem of water scarcity affects the development of productive activities by agricultural enterprises, mainly in areas such as the San Quintín Valley, Baja California, where aquifers are overexploited and rainfall provides increasingly smaller amounts of water resources. This has forced entrepreneurs to look for alternatives that allow them to remain in the market and try to be competitive. So studying the impact of the efficient use of water resources on the competitiveness of agricultural enterprises is of particular interest, first, because as a limited resource its use in the productive activities of companies in the region should be optimized and, secondly, in order to promote efficient water use systems that allow sustainable development in the San Quintín valley area.
The objective of this research work is to determine the validity of the content and construct of an instrument to measure the efficient use of water and the competitiveness of agricultural enterprises in the San Quintín valley, by using the Lawshe model (1975), modified by Tristán (2008), along with the opinion of seven experts on the validity of each one of the items that make up the instrument, and then to carry out the analysis of items, determine their correlation and calculate the Cronbach's Alpha for the reliability of the instrument.
Literary review
Baja California has scarce water resources, and the presence of continental aquatic systems ?both lacustrine (lakes) and potamological (rivers, streams, springs, etc.)? is limited. Added to this is low rainfall, where under normal conditions rainfall varies from 200 to 300 mm per year in only a small portion of the state, while in the rest of the state it is significantly less, 50 mm per year.
Competitiveness of productive chains
In March 2008, FAO and SAGARPA presented a definition of the competitiveness of an agri-food chain production system, based on that conceived by Esterhuizen (2006), and Monke and Pearson (1989): The competitiveness of an agri-food production system can be defined as the capacity of said system ?given its current technology, its inputs and products prices, and the interventions of national and international policies and programs (subsidies and taxes)? to achieve net gains greater than zero, a cost-benefit ratio (RBC) greater than 1, and to be equal or superior to that of other production systems that compete for the use of the same factors of production (water, land, capital, labor) (Sagarpa-FAO, 2008).
According to Romo and Rivas (2012), competitiveness is related to productivity, so it is necessary to emphasize that a company can be productive and not be competitive, although for a company to be competitive it must be productive. This implies that competitiveness is a more complex concept and, for practical purposes, it can be said that productivity is one of its components.
As Sánchez and Avilés (2012) comment, competitiveness depends especially on the quality of the product and the price level. These two factors in principle are related to productivity, innovation and inflation. It follows from this approach that efforts should be concentrated on increasing productivity and incorporating and developing technology, which is not always achieved by reducing costs or devaluations.
Schwentesius and Gómez (1997) established that the analysis of production costs is one of the methods used to estimate the level of competitiveness between products from two or more regions. The studies that were prepared in preparation for the North American Free Trade Agreement were based, therefore, on this analysis. The results indicated that Mexico, in most cases, had higher costs than the United States of America.
When studying the competitiveness of productive chains, we highlight the influence of the use of limited resources such as water resources. With regard to efficient use of water, we should refer to studies conducted by Donald M. Tate who presents the principles in Table 1.
Table 1 Principles of efficient water use (Tate, 2014).
| 1 | Water use efficiency includes any measure that reduces the amount per unit, that is used in a given activity, and that is consistent with the maintenance or improvement of water quality. |
| 2 | The use of water in most socio-economic activities can vary widely, depending on the interaction of many factors. |
| 3 | The amount of attention paid to the efficiency of water use is directly proportional to the prices charged for the service. |
| 4 | The rise in prices leads to an increase in attention to the characteristics of water use and, in the long term, to a more efficient use. |
| 5 | When water prices reflect all the social costs of developing supplies, incentives are created for the efficient and rational use of the resource, reflecting its value in production or in its various other uses. |
| 6 | The attitudes, tastes and preferences of the people originate important considerations to achieve an increase in the efficiency of water use. |
| 7 | Efficiency in the use of water is partly a response to the property rights that prevail in society. The more private property there is, the more water efficiency practices are used. |
| 8 | When resources are evaluated correctly in proportion to their contribution and productivity, there is an incentive, through the forces of supply and demand, to use those resources efficiently through the introduction of technological changes. |
| 9 | The quality and quantity of water are closely intertwined, so that actions aimed at increasing the efficiency of water use can have an impact on its quality, and viceversa. |
| 10 | The steps taken to improve the efficiency of water use should be formally evaluated by comparing them with the multiple existing criteria. |
The principles for the efficient use of water allow highlighting that, as the main user of the resource, the agricultural sector must take actions that enable its optimal use and contribute to a collective benefit.
Method
Kind of investigation
Considering how the data was analyzed, the scope of the research is causal correlational, since the purpose is to show how the variables relate to a given phenomenon and to explain the phenomenon in our context (Hernández, Fernández, & Baptista, 2010). It seeks to explain how the variable of efficient water use has a direct impact on the degree of competitiveness.
Research design
The research presents a non-experimental, cross-sectional or transverse design, with a correlational-causal analysis and a quantitative empirical approach (Grajales, 2004), since it is intended to objectively measure the variables involved and as accurately as possible.
Population and sample
With regard to the study population, it should be noted that the study unit is the agricultural companies in the San Quintin Valley, Baja California, Mexico. The population was determined according to the information provided by SAGARPA in the Rural Development Support Center (CADER), with a total of 97 agricultural companies. Once the population was determined, the sample was selected, which is a part of the population or universe to be studied (Gómez, 2006). To calculate the sample, a proportion of agricultural enterprises was considered, with a confidence level of 95% and 5% error, by applying the probabilistic method with a stratified sampling based on the size of the agricultural enterprises (micro, small companies, medium and large) as classified by the Ministry of Economy, according to the agreement establishing the stratification of micro, small and medium enterprises (SE, 2009).
Initial model of the measuring instrument
The instrument that was used to collect the data for the pilot test was developed in order to obtain specific information from the study group. For the selection of some of the items in the instrument, the existence of some statistical data regarding the efficient use of water was reviewed. The instrument that was developed for the study consists of a data section with the characteristics of the agricultural companies and another section with 51 items related to the dimensions of the variables involved.
Characteristics of the measuring instrument
The data collection instrument developed by this research consists of 2 parts. One corresponds to sociodemographic characteristics (15 items) and the other consists of 48 items corresponding to the measurement instrument, with a Likert scale of five options, on Availability, Management, Performance, Irrigation Technology, Price-cost, Productivity and Technological Innovation, which are the dimensions of the efficient use of water and competitiveness variables. The response options range from totally disagreeing, disagreeing, neither agreeing nor disagreeing, agreeing and totally agreeing, assigning values from 1 as totally disagreement to 5 as totally agreeing.
Pilot test
The pilot test refers to the application of the questionnaire in a small sample of respondents to identify and eliminate possible problems. As a general rule, a questionnaire should not be used in a field survey without having been tested. The pilot test should be extensive, all aspects of the questionnaire should be tested, and the respondents should be similar to those that will be included in the actual survey in terms of characteristics, familiarity with the topic, behavioral attitudes and interest (Malhotra, 2004).
The pilot test was carried out with 13 agricultural companies in the study region, and with the data obtained. The database was developed using the Statistics for Social Sciences software (SPSS) version 21.0 for Windows.
Validity and reliability of the instrument
The content validity was assessed by applying the Lawshe model, supplemented by the experience and knowledge of seven experts in the area related to this case. The clarity and relevance of each item was evaluated by the experts. We determined the quantitative index of the content validity based on the model by Lawshe, modified by Tristán (2008), which considers the Content Validity Reason (CVR') with a value equal to or greater than 0.5823. Each expert was given the instrument along with the conceptual and operational definition of the variables involved. The results of the evaluation were collected and the data and information were processed with Microsoft Excel 2010 software. The Content Validity Index (CVI) was determined. In order to determine the reliability of the instrument, the questionnaire was analyzed using Cronbach's Alpha coefficient.
Where,
Collection of data
The primary data collection method was through the survey, through the preparation of a questionnaire-type instrument to be administered to selected agricultural companies in the San Quintín Valley, Baja California, Mexico. Data from secondary sources was obtained through statistics, communications, records, and publications, among others, from official sources, government agencies, and relevant related research. This information will provide support to achieve the expected objectives (Torres, 2014).
Results
Descriptive Analysis
The pilot test was conducted in 13 agricultural companies located in the study region and the main indicators of the sample are presented below.
Figure 1 shows that 38.5% of the agricultural companies surveyed are located in the Col. Vicente Guerrero, 23.1% in San Quintín, 15.4% in Colonet and Camalú, and 7.7% in El Rosario. These zones belong to an area containing overexploited wells with saline intrusion problems (Conagua, 2013).

Figure 1 Location of the company. Source: Developed by the authors with data obtained by this study.
Figure 2 shows the companies surveyed based on the stratification of the companies by the Ministry of Economy (SE, 2009), with those that have 251 or more employees (38.5%) classified as large, those that have between 51 and 250 employees (38.5%) as medium, those with employees from 11 to 50 (15.4%) as small and the remaining (7.7%) with less than 10 employees as microenterprises.

Figure 2 Number of employees in the companies. Source: Developed by the authors with data obtained by this study.
Figure 3 shows the main crop product in the companies surveyed: 53.8% produce strawberry, 15.4% tomato, 15.4% cucumber, 7.7% onions and the remaining 7.7% produce a different crop, in this case peas.

Figure 4 shows that 76.9% of the companies export their products, and participation in the national, regional and local markets is 7.7% each.

Figure 4 Target Markets for products. Source: Developed by the authors with data obtained by this study.
Figure 5 shows that 92.3% of the companies use drip irrigation with irrigation tape and 7.7% use sprinkler irrigation. It is notable that most companies use drip irrigation, which is considered more efficient than sprinkler irrigation (Conagua, 2013).

Figure 5 Type of irrigation used in the production process. Source: Developed by the authors with data obtained by this study.
Figure 6 shows that 46.2% of the companies surveyed do not produce under protected agricultural conditions, 30.8% produce with 61% or more of the cultivated area under protected agricultural conditions, 15.4% grow their products with up to 10% of the surface under protected agriculture and 7.7% report having an area of 41 to 50% under protected agricultural conditions. Producing under protected agriculture conditions increases the efficient use of water, optimizing the use of the resource in the productive process (Moreno, Aguilar, & Luévano, 2011).

Figure 6 Production under protected agricultural conditions. Source: Developed by the authors with data obtained by this study.
Figure 7 shows that 46.2% of the companies have tunnel-type greenhouses, 30.8% do not have greenhouses, 15.4% have chapel-type greenhouses and 7.7% asymmetric greenhouses. It is important to mention that companies that do not have greenhouses present an area of opportunity to improve the use of water resources in the production process (Conagua, 2013).
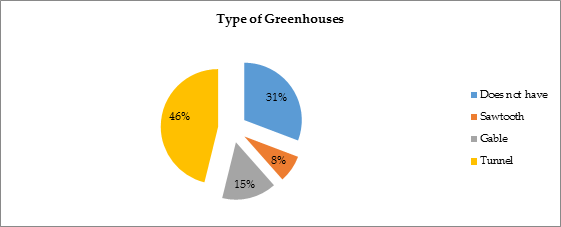
Figure 7 Type of greenhouses in the companies. Source: Developed by the authors with data obtained by this study.
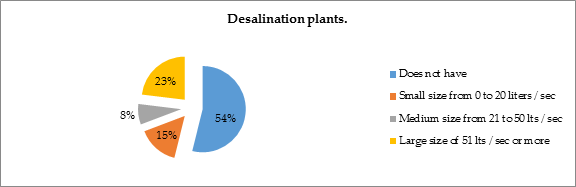
Figure 8 shows that 53.8% of the companies do not have a desalination plant for their production, 23.1% have a large desalination plant, 15.4% have a small desalination plant and 7.7% have a medium desalination plant.
Content validity
Table 2 shows the results of the content validity ratio procedure according to the model by Lawshe and modified by Tristán (2008). This demonstrates that the global validity of the 51-item instrument is 83%. Most of the instrument items are acceptable, 3 items were eliminated for having values lower than the acceptable minimum of 0.5823, which were 2, 30 and 33, leaving an instrument with 48 validated items.
Table 2 Content Validity (Lawshe Model). Source: Developed by the authors with data obtained by this study.
| Item | Essencial | Useful/not essential | Not important | CVR | CVR' |
|---|---|---|---|---|---|
| 1 | 6 | 1 | 0.71 | 0.86 | |
| 2 | 3 | 3 | 1 | -0.14 | 0.43 |
| 3 | 5 | 2 | 0.43 | 0.71 | |
| 4 | 7 | 1.00 | 1.00 | ||
| 5 | 6 | 1 | 0.71 | 0.86 | |
| 6 | 5 | 2 | 0.43 | 0.71 | |
| 7 | 5 | 2 | 0.43 | 0.71 | |
| 8 | 6 | 1 | 0.71 | 0.86 | |
| 9 | 6 | 1 | 0.71 | 0.86 | |
| 10 | 6 | 1 | 0.71 | 0.86 | |
| 11 | 5 | 2 | 0.43 | 0.71 | |
| 12 | 6 | 1 | 0.71 | 0.86 | |
| 13 | 5 | 2 | 0.43 | 0.71 | |
| 14 | 7 | 1.00 | 1.00 | ||
| 15 | 6 | 1 | 0.71 | 0.86 | |
| 16 | 6 | 1 | 0.71 | 0.86 | |
| 17 | 7 | 1.00 | 1.00 | ||
| 18 | 7 | 1.00 | 1.00 | ||
| 19 | 7 | 1.00 | 1.00 | ||
| 20 | 6 | 1 | 0.71 | 0.86 | |
| 21 | 7 | 1.00 | 1.00 | ||
| 22 | 7 | 1.00 | 1.00 | ||
| 23 | 7 | 1.00 | 1.00 | ||
| 24 | 6 | 1 | 0.71 | 0.86 | |
| 25 | 5 | 1 | 1 | 0.43 | 0.71 |
| 26 | 6 | 1 | 0.71 | 0.86 | |
| 27 | 5 | 2 | 0.43 | 0.71 | |
| 28 | 6 | 1 | 0.71 | 0.86 | |
| 29 | 5 | 2 | 0.43 | 0.71 | |
| 30 | 4 | 3 | 0.14 | 0.57 | |
| 31 | 5 | 2 | 0.43 | 0.71 | |
| 32 | 5 | 1 | 1 | 0.43 | 0.71 |
| 33 | 4 | 2 | 1 | 0.14 | 0.57 |
| 34 | 5 | 2 | 0.43 | 0.71 | |
| 35 | 5 | 2 | 0.43 | 0.71 | |
| 36 | 5 | 2 | 0.43 | 0.71 | |
| 37 | 5 | 2 | 0.43 | 0.71 | |
| 38 | 6 | 1 | 0.71 | 0.86 | |
| 39 | 6 | 1 | 0.71 | 0.86 | |
| 40 | 7 | 1.00 | 1.00 | ||
| 41 | 6 | 1 | 0.71 | 0.86 | |
| 42 | 7 | 1.00 | 1.00 | ||
| 43 | 7 | 1.00 | 1.00 | ||
| 44 | 5 | 2 | 0.43 | 0.71 | |
| 45 | 6 | 1 | 0.71 | 0.86 | |
| 46 | 7 | 1.00 | 1.00 | ||
| 47 | 6 | 1 | 0.71 | 0.86 | |
| 48 | 7 | 1.00 | 1.00 | ||
| 49 | 5 | 1 | 1 | 0.43 | 0.71 |
| 50 | 6 | 1 | 0.71 | 0.86 | |
| 51 | 7 | 1.00 | 1.00 | ||
| SUM | 297 | 50 | 10 | ||
| CVI: | 0.6639 | 0.8319 | |||
| CVI acceptable items: | 1.0000 | 0.8512 | |||
The overall validity of the instrument (CVI) (Table 2), considering the opinion of seven experts in the area, is 83%, so the instrument is acceptable, eliminating items 2, 30 and 33 increased this to 85%, according to Tristán (2008).
Analysis of the items
The item analysis was done by conducting a correlation analysis and determining its effect on the Cronbach Alpha coefficient, eliminating items that did not meet the 0.30 requirement to be acceptable.
In Table 3, the majority of the items have correlation indexes above 0.3, considered acceptable. The items that have values lower than this reference are numbers 1, 2, 3, 4, which correspond to water availability, 5, 6, 9, 11, 12, which correspond to water management, 13 which corresponds to performance, 16 and 19 which correspond to irrigation technology, and 26 and 27 which correspond to prices and costs. However, when eliminating the effects from the instrument they do not result in a significant increase in the Cronbach's alpha, remaining at the same level of reliability. And since the information that could be collected for the items is useful they would not be eliminated.
Items 2 and 16 have a negative correlation, nevertheless, their effect on the level of reliability when eliminated is minimal, and since the information gathered is of importance to the research, it was decided to keep the items in the instrument.
Table 3 Analysis of the items. Source: Own elaboration based on data in SPSS.
Reliability analysis
The general Cronbach's Alpha presented in Table 4 is 0.91 for the 48 items, which is considered an acceptable level since it is greater than 0.7. The 13 agricultural companies surveyed (100%) were included for its determination.
Construct validity by Factorial Analysis
Construct validity assesses the degree to which the instrument reflects the theory of the phenomenon or concept it measures. The validity of the construction of the instrument ensures that the measures resulting from the responses to the questionnaire can be considered and used as a measure of the phenomenon that we want to measure. The most frequently used calculation methods are factor analysis and a multimethod matrix (Arribas, 2004).
In this investigation, the construct validity was assessed after the content validity was determined by the experts. The instrument’s dimensions were determined through the exploratory factorial analysis by means of the SPSS software, using the principal components extraction technique and the orthogonal rotation method (Varimax), resulting in the determination of four factors that explain 75.69% of the variance. The internal consistency of the scale was also analyzed for each of the factors determining the Cronbach's Alpha coefficients (Table 5).
Determination of the number of factors to rotate
Table 5 shows the explained variance of the factors in order to determine the best factorial solution for the instrument. In this case it was determined that four factors explain 75.686% of the variance, which is considered adequate for the investigation since this exceeds the minimal acceptable percentage of 60%.
Table 5 Explained variance. Source: Developed by authors based on data.
| Components | Initial Eigenvalues | Sums of Factor Extraction | Sums of Factors Rotation | ||||||
|---|---|---|---|---|---|---|---|---|---|
| Total | % Variance | % Accumulated | Total | % Variance | % Accumulated | Total | % Variance | % Accumulated | |
| 1 | 13.357 | 35.149 | 35.149 | 13.357 | 35.149 | 35.149 | 8.196 | 21.568 | 21.568 |
| 2 | 6.289 | 16.550 | 51.700 | 6.289 | 16.550 | 51.700 | 7.553 | 19.876 | 41.444 |
| 3 | 5.389 | 14.181 | 65.880 | 5.389 | 14.181 | 65.880 | 6.891 | 18.135 | 59.579 |
| 4 | 3.726 | 9.805 | 75.686 | 3.726 | 9.805 | 75.686 | 6.121 | 16.107 | 75.686 |
| 5 | 2.787 | 7.335 | 83.021 | ||||||
| 6 | 1.939 | 5.103 | 88.124 | ||||||
| 7 | 1.640 | 4.315 | 92.439 | ||||||
| 8 | .916 | 2.410 | 94.850 | ||||||
| 9 | .822 | 2.163 | 97.013 | ||||||
| 10 | .594 | 1.562 | 98.575 | ||||||
| 11 | .541 | 1.425 | 100.000 | ||||||
Sedimentation graph
The sedimentation graph is a method for extracting factors, where the sum of the eigenvalues is equal to the explained variance. The purpose is to identify the values whose associated eigenvalue is large enough to be considered.
Figure 9 shows the sedimentation graph with the eigenvalues associated with the efficient water use and competitiveness variables for the agricultural enterprises in the San Quintín Valley, Baja California, Mexico.

Extraction of factors
The extraction of factors was done using the extraction method in the main components analysis and the rotation method used was that of Kaiser's Varimax in the SPSS System (Table 6).
Table 6 Matrix of the rotated components.
| Ítems | Factors | |||
|---|---|---|---|---|
| 1 | 2 | 3 | 4 | |
| 17 The irrigation system in the company can be modified to improve the efficiency in the use of water | .956 | |||
| 37 By efficiently using water in production, the expected yield is increased | .939 | |||
| 36 The production process in the company improves with the efficient use of water | .821 | |||
| 38 In the company, the duration of the production process is improved by efficiently using water | .792 | |||
| 35 With the efficient use of water in the company, production per hectare increases | .744 | |||
| 14 The efficient use of water reduces evaporation and prevents production leaks | .695 | |||
| 30 Efficient water use improves the packaging process of production in your company | .691 | |||
| 42 The irrigation systems installed in the company have been adapted to increase the efficiency in the use of water, and to ensure that they remain in the market | .640 | |||
| 44 Investment in greenhouses could improve their situation in relation to their competitors | .781 | |||
| 46 It considers that the production under conditions of protected agriculture, would improve the competitiveness of your company | .780 | |||
| 47 The company could increase its competitiveness if it had a desalination plant for an efficient use of water in production | .778 | |||
| 48 Technological innovation in the production of the company is a determining factor to improve competitiveness | .756 | |||
| 07 The storage of water in your company is done through reservoirs to ensure availability in production | .755 | |||
| 43 It is necessary to invest in irrigation systems that increase the efficiency of water use in the company, which allows it to be more competitive | .736 | |||
| 09 The quality of water that you get first hand needs to be improved for production | .683 | |||
| 22 The production in protected agriculture allows to increase the production per hectare of the company | .658 | |||
| 45 With an adequate financing source, it could invest in the installation of infrastructure to efficiently use water and improve its competitiveness | .657 | |||
| 32 Compliance with safety regulations allows improving the efficiency of water use in your company | .616 | |||
| 15 Water filtration in the company's production is controlled to improve the absorption in the plant | .572 | |||
| 08 The use of water in production can be improved by making efficient use of water | .535 | |||
| 11 The cost of extracting water from the company has been increasing due to the decrease in availability | .502 | |||
| 27 The cost of transporting water in production increases due to the decrease in availability in your company | .862 | |||
| 34 The efficient use of water in your company allows you to reduce the hidden costs of damage to soil and groundwater | .839 | |||
| 28 The cost of transporting water decreases with the efficient use of water in your company | .816 | |||
| 29 The cost of conserving water for production in your company decreases with the efficient use of water | .753 | |||
| 26 The efficient use of water in your company allows you to save on production inputs | .749 | |||
| 31 With the fulfillment of safety rules in your company, sales have increased | .718 | |||
| 06 Water management in the San Quintín Valley has allowed the conservation of its soils and plants | .715 | |||
| 40 In the productive process the efficient use of water allows to increase the inventory of quality production | .648 | |||
| 41 The increase in production per hectare has allowed it to remain in the market | .647 | |||
| 25 The efficient use of water in your company allows you to reduce production costs | .628 | |||
| 20 The greenhouses of the company allow to improve the efficiency in the use of water in production | .867 | |||
| 19 The company has greenhouses for its production | .862 | |||
| 24 The efficient use of water in production in your company increases the selling price | .774 | |||
| 10 The use of a desalination plant in your company allows efficient use of water | .770 | |||
| 18 The company has mesh-shades for its production that improve the efficiency in the use of water in production | .768 | |||
| 23 The sales prices of your company's production increase due to water scarcity | .733 | |||
| 21 The company produces under protected agriculture increasing efficiency in the use of water | .629 | |||
|
Extraction Method: Analysis of Main Components Rotation Method: Varimax with Kaiser | ||||
Determination of the internal consistency of the scale
Table 7 shows the coefficients determined by the extraction method corresponding to the principal components analysis of the competitiveness variables. The items that did not meet the correlation requirements were eliminated and a final instrument with 38 items was obtained, with a global Cronbach alpha of 0.926.
Table 7 Internal Consistency of the Scale. Source: Developed by the authors with data obtained from the database in SPSS.
| Competitiveness Variables | Cronbach´s Alpha | Number of Items |
|---|---|---|
| Productivity and yield per hectare | 0.898 | 8 |
| Technological Innovation and Management. | 0.925 | 13 |
| Prices and costs | 0.917 | 10 |
| Irrigation technology | 0.907 | 7 |
| Total | 0.926 | 38 |
Discussion
The objective of this research was to determine the validity of the content and construct of an instrument to measure the efficient use of water by the agricultural enterprises in the San Quintín valley and their competitiveness. The psychometric characteristics of the measuring instrument were studied in relation to the efficient use of water and the competitiveness variables for agricultural enterprises in the San Quintín Valley, Baja California, Mexico.
The necessary tests were carried out to determine the content validity of the initial instrument as proposed by the Lawshe model, modified by Tristán (2008), regarding the efficient use of water and the competitiveness of the agricultural enterprises in the San Quintín Valley, Baja California, Mexico, based on the opinion of the experts. The results obtained reflect diverse points of view, their valuation was assigned to each one of the proposed items, and only 3 of the 48 proposed items obtained did not comply with the minimum acceptable value of 0.5823.
The construct validity was performed with an item analysis, for which the correlation index of each of the proposed items was determined. The global Cronbach alpha coefficient of the 48-item instrument was 0.914. The items that did not meet the minimum requirements of 0.300 were eliminated, leaving 44 for the reliability test. The determination of the internal consistency of the scale was then made by means of the extraction of the main components and the Varimax orthogonal rotation method, 4 main components were obtained and 38 items were left in the final instrument, with an overall Cronbach alpha coefficient of 0.926, considered reliable according to Hernández, Fernández and Baptista (2010).
Conclusions
The contribution of this work to generate a data collection instrument to measure efficient water use by agricultural enterprises and their competitiveness can be considered a valuable product since it is difficult to obtain the efficient use of water variable and its relationship with competitiveness from the specialized literature, because the subject has not been investigated in-depth and no research has been done on similar topics at the local, national and international levels.
The importance of carrying out this work lies in the application of instruments having adequate content validity and construct validity for research regarding the efficient use of water as a factor in the competitiveness of agricultural companies in San Quintín, Baja California, Mexico. The methodology applied provides useful tools for the collection of data from primary sources, which can provide the expected results.
Therefore, this work contributes to the effort by many economic and social actors to solve the problem of the allocation and use of water resources, which would improve the living conditions of society and contribute to the millennium development objectives, which consider access to water as one of the basic and fundamental human rights for existence.
Referencias
Arribas, M. (2004). Diseño y validación de cuestionarios. Matronas Profesión, 5(17), 23-29. [ Links ]
Comisión Nacional del Agua, Conagua. (2013). Atlas del agua en México 2013. Recuperado de http://www.conagua.gob.mx/CONAGUA07/Noticias/SGP-3-14baja.pdf [ Links ]
Gómez, M. (2006). Introducción a la metodología de la investigación científica. Córdoba, Argentina: Brujas. [ Links ]
Grajales, T. (2004). Cómo elaborar una propuesta de investigación. Montemorelos: Publicaciones Universidad de Montemorelos. [ Links ]
Hernández, R., Fernández, C., & Baptista, P. (2010). Metodología de la investigación (5ª ed.). México, DF: McGraw-Hill. [ Links ]
Malhotra, N. (2004). Investigación de mercados. Un enfoque aplicado (4ª ed.). México, DF: Pearson Educación. [ Links ]
Moreno, A., Aguilar, J., & Luévano, A. (2011). Características de la agricultura protegida y su entorno en México. Revista Mexicana de Agronegocios, 15(29), 763-774. Recuperado de http://www.redalyc.org/pdf/141/14119052014.pdf [ Links ]
Organización de las Naciones Unidas, ONU . (2010). Water as a human right? Recuperado de http://www.un.org/spanish/waterforlifedecade/human_right_to_water.shtml [ Links ]
Organización de las Naciones Unidas, ONU. (2014). Combatir la escasez de agua. Desafío del siglo XXI. Recuperado de http://www.un.org/spanish/waterforlifedecade/scarcity.shtml [ Links ]
Pombo, A. (2014). Tecnificación en San Quintín una solución rentable ante la escasez de agua. Recuperado de http://www.colef.mx/?estemes=tecnificacion-en-san-quintin-una-solucion-rentable-ante-la-escasez-de-agua&lang=en&e=correo-fronterizo [ Links ]
Romo, H., & Rivas, L. (enero-marzo, 2012). Modelo de competitividad de las empresas operadoras de telefonía móvil en México. Contaduría y Administración, 57(1), 2012, 123-148. [ Links ]
Sánchez, C., & Avilés, S. (2012). Innovación tecnológica de sistemas de producción y comercialización de especies aromáticas y cultivos élite en agricultura orgánica protegida con energías alternativas de bajo costo. La Paz, México: Centro de Investigaciones Biológicas del Noroeste, S.C. [ Links ]
Schwentesius, R., & Gómez, M. (1997). Competitividad de la producción hortícola mexicana en el mercado norteamericano. Tendencias a tres años del TLC. Latin American Studies Association LASA 97, XX International Congress, Guadalajara, México. [ Links ]
Secretaría de Agricultura, Ganadería, Desarrollo Rural, Pesca y Alimentación-Organización de las Naciones Unidas para la Alimentación y la Agricultura, Sagarpa-FAO. (2008). Metodología de la medición de la competitividad d sistemas producto. Recuperado de http://www.sagarpa.gob.mx/programas2/evaluacionesExternas/Lists/Otras%20Evaluaciones/Attachments/7/DocumentoGeneralCompetividad.pdf [ Links ]
Secretaría de Economía, SE. (2009). Acuerdo por el que se establece la estratificación de las micro, pequeñas y medianas empresas. Recuperado de http://dof.gob.mx/nota_detalle_popup.php?codigo=5096849. [ Links ]
Tate, D. M. (2014). Principios del uso eficiente del agua. Recuperado de http://cidbimena.desastres.hn/docum/Honduras/PRINCIPIOSDELUSOEFICIENTEDELAGUA.pdf [ Links ]
Torres, M. (2014). Métodos de recolección de datos para una investigación. Recuperado de http://www.tec.url.edu.gt/boletin/URL_03_BAS01.pdf [ Links ]
Tristán, A. (2008). Modificación al modelo de Lawshe para el dictamen cuantitativo de la validez de contenido de un instrumento objetivo. Avances de Medición, 6(1), 37-48. Recuperado de http://dialnet.unirioja.es/servlet/articulo?codigo=2981185 [ Links ]
Received: December 03, 2015; Accepted: October 24, 2017
 Este es un artículo publicado en acceso abierto bajo una licencia
Creative Commons
Este es un artículo publicado en acceso abierto bajo una licencia
Creative Commons
