


 texto en
  Inglés (pdf)
 Artículo en XML
 Referencias del artículo
 Enviar artículo por email
 Citado por SciELO
  Similares en
SciELO
Similares en
SciELO 
 Permalink
Introduction
Internal waves (IW) are a nonsinusoidal, nonlinear, more-or-less isolated and often detected waves of complex shapes that frequently occur in the marine environment. The tidal flow over topographic features such as sills and continental shelf slopes in stratified oceans can generate IW of tidal frequency (Prinsenberg & Rattray, 1975; Baines, 1982). Several authors have noted that these waves are typically observed during the summer, when trapped in a strong and shallow seasonal thermocline (Apel, Ostrovsky, & Stepanyants, 1995; Apel et al., 1997; Apel, Ostrovsky, Stepanyants, & Lynch, 2006; Chapman, Golenko, Paka, Sabinin, & Vlasenko, 1997; Colosi et al., 2001). These waves have periods of 10 minutes and wavelengths ranging from 100-2000 m.
Internal waves can propagate over several hundred kilometers and transport both mass and momentum; these are often associated with a change in stratification. Their propagation carries considerable velocity shear that can lead to turbulence and mixing. Mixing often introduces bottom nutrients into the water column, and thereby fertilizes the local region, modifying the marine ecosystem (Apel, 2002; Gaxiola-Castro, Álvarez-Borrego, Nájera-Martínez, & Zirino, 2002).
In 1978, the launch of SEASAT with Synthetic Aperture Radar (SAR) onboard corroborated the capability of this sensor to detect IW. Some decades later, SAR systems of the European Space Agency (ESA), RADARSAT (Canada) and Almaz (URSS) satellites also confirmed the effectiveness of this sensor for detecting IW (Fu & Holt, 1984).
Given that nonlinear IW remain coherent for up to several days, the wave packets that are produced during successive tidal cycles are visible in many SAR images. As the packet propagates away from the generation site, additional waves within a packet are formed as the displaced pycnocline oscillates at the local Brunt-Väisälä period (Jackson, Da Silva, Jeans, Alpers, & Caruso, 2013).
Despite the importance of IW as a generator of productivity in the ocean, very few studies have been performed in the Gulf of California (GC). These surveys have been performed in short periods of time using satellite data and in situ measurements trying to describe its presence and its effects in the marine environment (Fu & Holt, 1984; Gaxiola-Castro et al., 2002; Filonov & Lavín, 2003). The scarcity of studies of this phenomenon is attributable to the high cost of in situ and satellite surveys and the unpredictability of finding or detecting it (dimensions, direction and shape). In this sense, the SAR sensor became a powerful tool in detecting IW but the very low temporal resolution of the sensor (coverage of the same location infrequently) and cost of the images are limitations on its use. Therefore, the goal of our study, the first of its kind in GC, consists of detecting, quantify, determine the number of SAR images needed to detect an IW and finally describe the seasonal and annual variability of IW, thanks to the support of the European Space Agency (ESA) image database.
Materials and methods
Study area
The GC is a marginal sea with high evaporation rates; it is considered to be the most important evaporation basin in the Pacific Ocean (Bray, 1988). This area is extremely interesting from oceanographic and meteorological standpoints given its similarity to other seas such as the Red Sea and the Adriatic Sea (Badan-Dangon, Dorman, Merrifield, & Winant, 1991). The rough dimensions of GC are 150 km wide and 1100 km long; its depth varies from approximately 200 m at its head to 3600 m at its mouth. Many physical processes such as seasonal winds, upwellings, gyres and tidal mixing continuously occur in GC. Also, GC experiences strong interactions with the Pacific Ocean through its mouth (Badan-Dangon, Koblinsky, & Baumgartner, 1985; Argote, Amador, Lavín, & Hunter, 1995).
The general circulation and seasonal variability of GC results from the forces exerted by the Pacific Ocean through its mouth. These forces include tides, low-frequency movements, and to a lesser extent, surface winds from buoyancy flux (Ripa, 1997; Beier, 1997; Marinone, 2003).
Tides in this basin are produced by the co-oscillation of tides from the Pacific Ocean (Filloux, 1973; Ripa & Velázquez, 1993). The semidiurnal components show amplification in tidal height toward the head of GC such as M2 component that ranges from 36 cm at the gulf entrance to 150 cm in the upper zone, with a minimum in the central part of the gulf (5 cm). In contrast, the diurnal components are in phase in the entire gulf, and the amplitude increases towards the head by continuity. As a result of the different characteristics of the diurnal and semidiurnal components, the tides in the Gulf become mixed (Lavín & Marinone, 2003).
This study focuses on the Northern GC (NGC), its location is 32°N-110°W and 28°N-106°W, which is a relatively shallow basin with an average depth of 200 m (Figure 1). One of the most important topographic features in this area is the presence of the Midriff Archipelago that includes the largest islands in GC, the Tiburon and Angel de La Guarda. The Ballenas Channel, located between the peninsula and Angel de la Guarda Island, presents a maximum depth of approximately 1600 m; Tiburon Basin, located between Angel de la Guarda and Tiburon Islands, reaches a maximum depth of approximately 500 m; Delfin Basin located to the north of Angel de la Guarda Island, presents a maximum depth of approximately 800 m (Shepard, 1950). The Ballenas Channel is isolated from the central GC by a submarine ridge, its base reaches a depth of around 450 m (Álvarez-Borrego, 2007). Additionally, there are four sills in this region: San Lorenzo, San Esteban, Delfin, and Ballenas Channel.
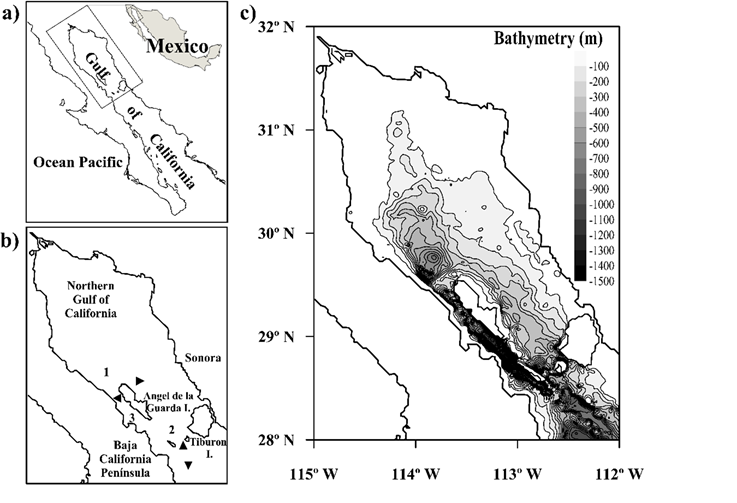
Figure 1 Study area: a) Gulf of California; b) Northern Gulf of California including the Mid riff Islands, basins and sills: (1) Delfin Basin, (2) Tiburon Basin, (3) Ballenas Channel, (◄) Ballenas Channel Sill, (▲) San Lorenzo Sill and (▼) San Esteban Sills; c) Northern Gulf of California Bathymetry (m).
The length of GC makes it almost resonant to semidiurnal tidal harmonics (Hendershott & Speranza, 1971; Filloux, 1973). This near-resonance results in large tidal ranges (up to 9 m) and strong tidal currents (up to 1 m/s) in the shallow area at the northern extreme of the Gulf. The presence of sills causes even stronger currents (up to 1.5 m/s), which releases large amounts of turbulent kinetic energy. This energy has a strong impact on the physics and biology of the area. Most of the tidal turbulent kinetic energy that dissipates in the GC is due to semidiurnal tides (especially M2) and mainly occurs around the islands and in the shallow areas of NGC (Argote et al., 1995; García-Silva & Marinone, 2000; Filonov & Lavín, 2003).
Winds are strong during winter with speeds that reach 8-12 m/s coming from the northwest. These winds cause mixing in the water column, which in the summer is largely stratified since the winds that come from southwest during this season are weak with speeds of less than 5 m/s and calms are frequent (Badan-Dangon et al., 1991; Santamaría-de-Ángel, Álvarez-Borrego, & Müller-Karger, 1994; Marinone, 2007).
Quantitative analysis
We analyzed 371 images in SAR_IM_0P (ERS-2 satellite) and ASA_IM_0P formats (ENVISAT satellite) provided by ESA to detect IW (internal waves) and describe their characteristics (direction, train number, wavelength). These are quick glance images with low resolution and are available on the EOLI-sa catalog of the ESA (European Space Agency). Despite lacking high precision, these are very useful for the detection of marine and atmospheric phenomena, in this case IW. Each image includes relevant data or metadata such as the satellite’s name, orbit number, track and identification record, satellite pass, acquisition date and time, and geographical location. The scene area varies from 300 to 400 km in azimuth (along-track) with a constant range of 100 km (throughout the track).
SAR data acquired by different satellites lack constant temporal and spatial coverage unlike passive sensor satellites (e.g., AVHRR-NOAA17, MODIS-AQUA/TERRA and SEAWIFS-SEASTAR) and even some active sensor satellites (e.g., NSCATT-ADEOS and SEAWINDS-QUIKSCAT). The acquisition of data depends on the number of scientific projects involved and the temporal scanning periods required. The latter causes the space agency database to be discontinuous in both space and time. Due to the inconsistency of SI acquisition at each sampled month over the period studied (seven years), we calculate the incidence of IW in each analysis made per time scale (monthly, seasonally and interannually).
To deal with this inconsistency we created a method to calculate the number of SI required to detect one image with IW for each time scale analysis. This is because in many SI are not detected IW. We first applied the relative abundance index to estimate the IW number in each time scale. This index is used by many authors such as Lessios (1996), and Lira-Torres and Briones-Salas (2012) when the study object is randomly sampled from an indefinitely large set of objects. In this sense Pielou (1977), Ludwig and Reynolds (1988), Gove, Patil, Swindel and Taillie (1994) describe the relative abundance as the balance descriptor of the population. In this particular case this relative abundance index was used as a descriptor of internal wave generation through time. Afterwards, we calculated the number of SI required to detect one image with IW (SI:IIW ratio) where IIW is the number of satellite images with presence of internal waves, using the following equation:
To calculate the IW relative abundance or denominator fraction in the monthly equation for each of the sampled months, we used the number of SI acquired and the number of IIW; we deleted the months where no IIW were detected. The mean and mode were also determined throughout the study period to obtain reference values.
For the seasonal analysis, we calculated the IW relative abundance using the total of SI acquired and the number of IIW for each season of every year. We obtained the average value for each season during the period of study, the equation was applied for each average value.
Likewise, IW relative abundance of the interannual equation was calculated using the total number of SI available each year and the IIW detected in each case. The equation was applied to each year.
Data obtained at different time scales were used as reference values for the presence of IW in the study area. Lower values were considered to indicate an increased occurrence of IW in SI; higher values corresponded to a decreased occurrence of IW.
Results
Time series of sample dates versus the number of images showed the strong variability in the availability of SI acquired by the sensor and the number of SI detecting the presence of IW during the study period (Figure 2a). The acquired SI clearly define two periods: April 2000 to June 2003 (where the number of available images ranged from 1-6 with a mean of 2 and a mode of 1) and July 2003 to December 2006 (where the number of available images ranged from 1-18 with a mean of 9 and a mode of 11). Despite differences in the availability of images over these two periods, the number IIW detected during the entire study period did not vary considerably. The first period ranged from 0 to 4 images with a mean of 1 and a mode of 0; the second period ranged from 0 to 5 images with a mean of 2 and a mode of 0. From the sampled months (59), 27 lacked IW detections and 12 (44%) corresponded to winter. In the first period, 70% lacked IIW detections and 31% during the second. These results reveal a dependence of IW detection from SI acquisition, and this dependence is not directly proportional.
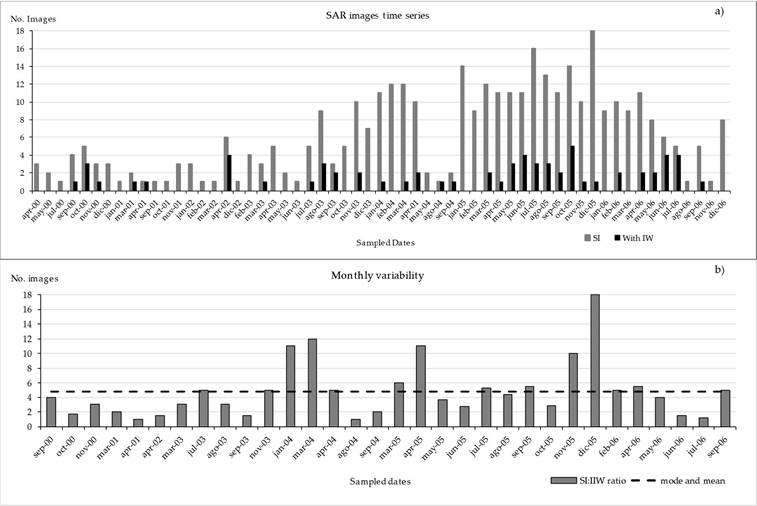
Figure 2 Time series variability from 2000-2006 in the NGC: a) sampled dates with SI (gray bars) and IIW detected (black bars); b) ratio between the number of SI acquired and IIW detected (SI:IIW) (gray bars) and mean and mode (dotted line).
The monthly results obtained from the equation (Figure 2b) are useful for determining the number of SI required to detect an IIW, expressed as the ratio SI:IIW. We found that the mean and mode shared the same ratio (5:1) during the entire study period. In December 2005, the mean and mode exhibited the highest ratio (18:1); this month presented the lowest occurrence of IIW. Other months with low IIW occurrences included March 2004 (12:1), January 2004, April 2005 (11:1), and November 2005 (10:1). We found the highest number of occurrences of IIW with a ratio of 1:1 in April 2001, August 2004 and July 2006. We noted that during the period 2000-2003 the ratio remained below the mean and mode, which indicated a high occurrence of IIW. The opposite situation persisted largely during 2004-2006 when ratio was higher than mean and mode, which indicated a lower occurrence of IIW (Figure 2b).
Due to the difference in SI availability during the two periods and the large difference in the detection ratio of IIW (Figure 2), we conducted a seasonal rate analysis of the study period. The results of this analysis (Figure 3a) showed that winter has the lowest occurrence of IIW with an average ratio of 15:1, this is, one IIW was found out of every 15 SI analyzed. In contrast, spring and summer were characterized by a higher occurrence of IIW with an average ratio of 4:1. Autumn data had an average ratio of 8:1.
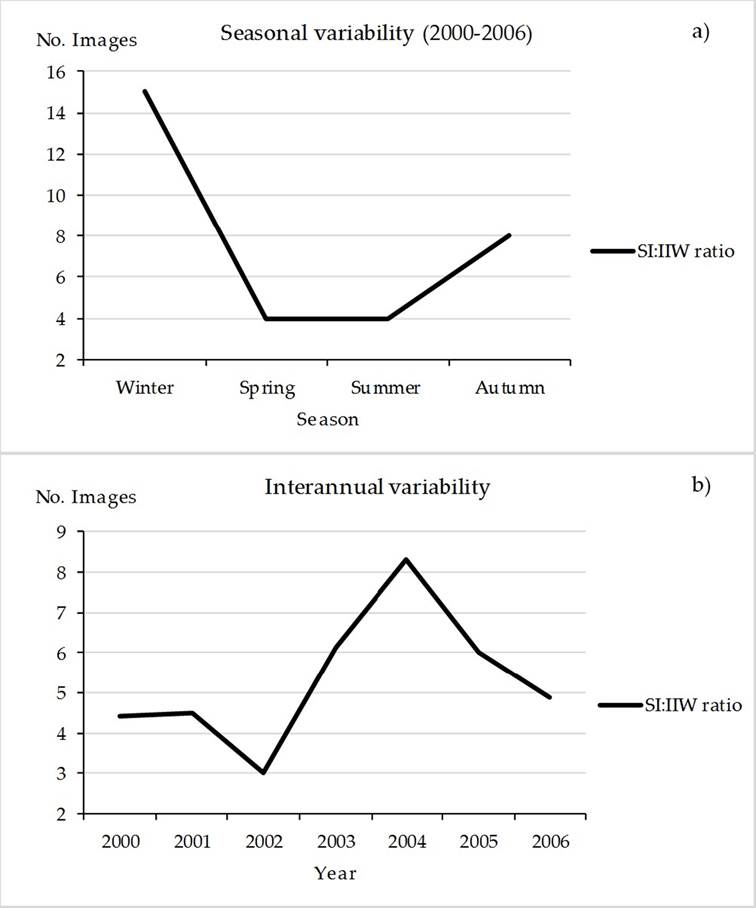
Figure 3 Average ratios of the number of SI acquired and IIW detected (SI:IIW) from 2000-2006 in the NGC: a) seasonal variability; b) interannual variability.
The interannual analysis revealed large variability in the detection ratio of IIW; 2002 had a ratio of 3:1, this year presented the most IIW. 2004 exhibited a ratio of 8:1, having the lowest number of IIW (Figure 3b).
IW detection in SAR images
Southern Midriff Island zone
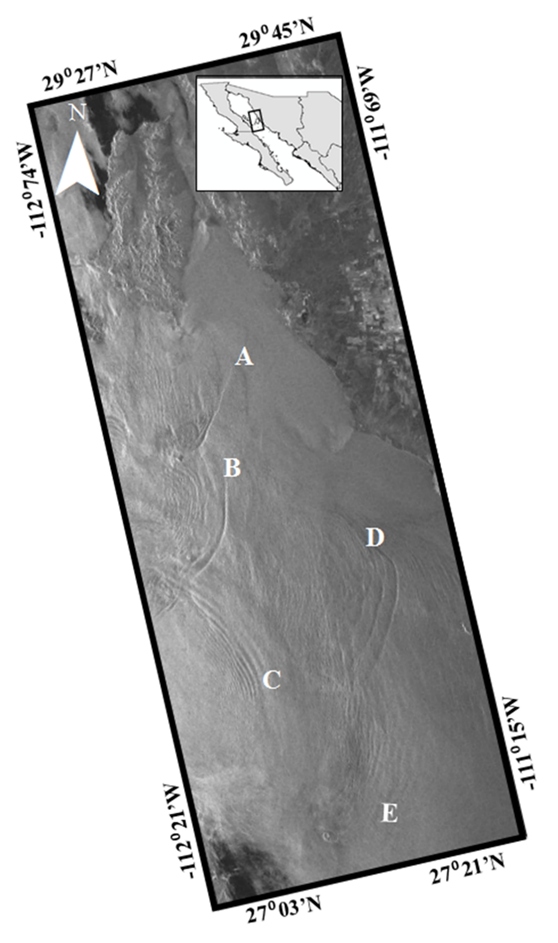
Approximately five wave trains (A-E) were detected in the ASAR image from August 30, 2004 (Figure 4). Three of the trains (A, B and D) appear to have been generated in San Lorenzo Sill; the other two trains (C and E) seem to have been generated at San Esteban Sill. All trains exhibited an easterly propagation. Packet A presented the largest wave deformation; D and E showed considerable attenuation.
Conclusions
We were able to identify the existence of IW in all of the seasons over the study period and area using SI. Our study is the first to describe temporal IW detection variability in this sea. This study showed that a significant number of IW were sensed at the vicinity of all of the sills at NGC. This finding allowed us to determine the monthly, seasonal and interannual variability of IW detection.
During the time series, the variability observed in the number of SI acquired and the number of IIW detected indicates that the number of images analyzed in each month somehow affects the detection of IW, however this effect is not always proportional. Therefore, the variability in the detection of IW by SI depends on how often this phenomenon occurs in the study area during each month of the year and not on the number of acquired images. This fact suggests that there may be other factors influencing the detection of IW.
The number of SI in which IW trains were detected about the total of images available allowed us to determine that according to the mode and mean (5;1) calculated in the monthly analysis, 5 SI are the minimum number of images required to detect this type of waves in GC.
Our monthly analysis of SI:IIW ratio also demonstrated the existence of periods with higher or lower ratios, hence, periods with lesser or more IW detections. Our proposed analysis circumvents the dependence between the detection of IIW and the number of SI acquired.
The variability found in the monthly analysis confirms that the marine variations occurring throughout the year in the study area determine the generation, and thus the detection of these waves. This fact is clearly observable in the seasonal analysis of SI:IIW (Figure 4) in which winter data presented the highest value, which means this season was associated with fewer IIW detection than in spring, summer or autumn. Additionally, our results showed that spring and summer were characterized by a high occurrence of IIW.
Our interannual analysis of SI:IIW allowed us to determine an important fact: even though the bottom topography of the study area remained unchanged, the IW detection rate varied every year. We observed extreme variations from year to year (e.g., 2004 with a detection ratio of 8:1 (SI:IIW) and 2002 with a detection ratio of 3:1). These results indicate that the number of SI required for an IW analysis varies every year.
Finally, as observed in SAR images presented herein, the IW generation occurred in the vicinity of all the sills with different directions, number of waves in each train, size and most cases, with a considerable interference among them, these findings should be consider in further in situ studies.

