


 nova página do texto(beta)
 Inglês (pdf)
 Artigo em XML
 Referências do artigo
 Enviar este artigo por email
 Citado por SciELO
  Similares em
SciELO
Similares em
SciELO 
 Permalink
Over view of the study area
Located in the northeast of Hunan Province and on the south bank of Jingjiang River, a stem stream of Yangtze River, Dongting Lake lies across Hunan and Hubei Province and has a close relationship with middle reaches of Yangtze River. Dongting Lake is the second largest freshwater lake in China, which has surface area 2 625 km2 and plays an important role in flood water storage. The inflow contains four big rivers of Hunan (Xiang River, Zi River, Yuan River, Li River), three bayous of Yangtze River (Songzikou, Ouchikou, Taipingkou) and several small rivers (Miluo River, Xingqiang River, etc.). Those flows inject into Dongting Lake, stored, and then discharges into Yangtze River at Chenglingji. The details of the schematic diagram are presented in (figure 1).

Temporal distribution of precipitation is uneven in Dongting Lake Region.The wet season which from April to September provides about 65% of annual precipitation, which increases the risk for regional flood disaster. Because of the unevenness of inter-annual rainfall, drought and flood possibility is very high, what’s worse, even in the flood years, the extreme weather like drought would possibly happen in Dongting Lake Region. Flood and drought disasters are the most severe disasters in Dongting Lake Region. According to the statistics, the annual average direct economic loss caused by flood is up to 1.858 billion in agriculture (Li, Zheng, & Gao, 2000). During last 60 years, the most terrible floods occurred in 1954, 1996 and 1998 (Mao, 1998; Mao, 2000) while in 1960, 1963 and 1968 occurred serious droughts. During time period from 1970 to 2005, the extreme droughts occurred 5 times.1998 and 2002 are extreme flood year and 1969, 1973, 1980, 1993, 1995 and 1999 flood years (Zhang, Zhang, & Li, 2009). In 21 century, the drought situation is getting worse; 2003, 2006 and 2011 were sustained drought years in Dongting Lake region. Water shortage threatened inhabitants’ water security and water supply in agriculture and industry around the lake, which has caused great attention from scholars. Researchers focus on the analysis of hydrology and sediment transport process, evaporation, precipitation, climate etc. The main aim of this study is an investigation of the relationship between runoff (three bayous and four rivers) variation and drought and flood disasters based on the hydrological database.
Data and methodology
Data
Hydrological database from 1951 to 2011 has been used in this study which was collected from hydrological stations on the following rivers: Songzikou (Xinjiangkou and Shadaoguan), Taipingkou (Mituosi), Ouchikou (Kangjiagang and Guanjiangpu), Xiang River (Xiangtan), Zi River (Taojiang), Yuan River (Taoyuan), Li River (Shimen), Chenglingji (Qilishan). Monthly data series were used to analysis annual characteristics. All these data were obtained from Hunan Hydrology Bureau and Bulletin of the Yangtze River Sediment during 2000 and 2011.
Methodology
Mann-Kendall trend test method
Mann-Kendall (M-K) trend test method is usually used for identification the mutation characteristic of a long time series data (Wang, Zhou, & Tang, 2011; Zhang, Chen, & Jiang, 2008). M-K trend test method is widely recognized which does not require the original data obeying certain probability distribution and require only submitted random independence. Set the time sequence x1, x2, x3,… , xn, mi represent the cumulative amount that the i sample xi is greater than xj (1 ≤ j ≤ i). Defined the statistical magnitude:
 (1)
(1)
If the original sequence is random and independent, the mean and variance of dk respectively are, E[dk] = k(k - 1)/4, var[dk] = k(k - 1) (2k + 5)/72 (2 ≤ k ≤ n). Further standardization of dk, defined statistic  (k = 1, 2, 3,…, n). If k > 10, UFk converges to the standard normal distribution. Adopt bilateral trend test, given a certain significant level a (a = 0.05). Check the critical value of Ua/2 in the normal distribution table, If |UFk| < Ua/2, it indicate that the tendency is not obvious; If UFk | > Ua/2, it indicated that there is a significant trend change. If the UFk value is positive, the long series shows increasing trend and vice versa. Make the inverse time series of x repeated computation according to the above process, at the same time make UBk = -UFk (k = n, n-1,…, 1). The two curves of UBk and UFk cross at one point, and the cross point is mutation point. If the mutation point is located between the given confidence level of 95%, it means mutation time is significant in statistics.
Concentration degree and concentration period method
The calculation principle of concentration degree and concentration period method follows (Liu, Li, & Su, 2007): to add the monthly runoff value up in terms of the vector sum in a year. The ratio of the modulus of resultant vector and annual runoff is the annual runoff concentration degree (Rd). The annual runoff concentration period (Rp) is the direction of the resultant vector.
Set a monthly runoff for ri (I = 1, 2, 3,.., 12). The vector ri is divided into horizontal and vertical direction vector; horizontal vector rix = ri cosθi; vertical vector riy = ri sinθi; the vector angle of the i monthly runoff is θi. Calculation formula:
 (2)
(2)
 (3)
(3)
 (4)
(4)
R stands for monthly runoff synthetic vector norm; Rx and Ry represent the horizontal and vertical component of the synthetic vector respectively; W is the annual runoff.
Annual distribution uniformity coefficient
Annual distribution uniformity coefficient reflects annual runoff distribution uneven degree in a watershed (Li, Li, & Wang, 2002; Yao, Guan, & Gao, 2003; Huang, 2003). Calculation formula:
 (5)
(5)
 (6)
(6)
Cv represents annual distribution uniformity coefficient;  represents average monthly runoff; Ri represents monthly runoff.
The mean difference T test
Defined mutation index of a sample sequence:
 (7)
(7)
 , s2 stand for the mean value and standard deviation before the base year m respectively;
  , s2 stand for the mean value and standard deviation after the base year m respectively.
Defined the statistics:
 (8)
(8)
m1, m2 represent the sample length of the two sequence before and after base year m respectively; sp stands for joint sample variance:
 (9)
(9)
Given a certain significant level a (a = 0.05), when t > ta, the mean value of m1 and m2 on both sides of the reference point has a significant difference, namely a mutation happen in the reference point.


Runoff characteristics of Dongting Lake
Essential characteristics of Dongting Lake’s inflow and outflow
The complicated flood combination of Dongting Lake’s inflow is composed of three bayous and four rivers. The flood of three bayous is similar to Yangtze River whose flood peaks are obesity and last long. The distribution of three bayous’ runoff is uneven, water in flood season (May to October) accounts for over 90% of the total. Four rivers’ flood peak is sharp, thin and last shorter. Floods in flood season contribute 65% to the total. According to the measured hydrological data from 1951 to 2011, incoming water from three bayous and four rivers is 2 567 × 108m3/a, and outflow was 2 862 × 108m3/a. water came from three bayous of Yangtze Rivers was 912 × 108m3/a, accounts for 31.9% of the total outflow. Four rivers contribute 1 655 × 108m3/a in the discharge which is 57.8% of the total. The rest local inflow is 295 × 108m3/a, occupying 10.3% of the portion.
Annual runoff variation characteristics
Concentration degree and Concentration period is a vector approach which was first applied to the analysis of meteorological factors. In 1982, Tang introduced this method to identified the distribution of monthly runoff annually and discovered water distribution characteristics of rivers in China (Tang, Cheng, & Li, 1982). Then, this method was adopted in other different basins (Zhang & Qian, 2003; Ding, Xu, & Pan, 2010; Zhang & Lu, 2011; Bai, Chin, & Ma, 2012). Concentration degree reflects the non-uniform distribution characteristics while concentration period informs the runoff concentrated period (monthly). The results are shown in table 1.

Table 1 illustrates the heterogeneity distribution of inflow and outflow. Distribution of three bayous’ annual runoff is uneven for its concentration degree is between 66.9 and 85.2%. The maximum is in Kangjiagang and the minimum is in Xinjiangkou. Four rivers’ concentration degree is between 32.2 and 43.7% and Chenglingji is 37.8% which is the smallest. Concentration period of three bayous and Chenglingji is July and that of four rivers is May-July. Their concentration period’s synthesis vector direction is between 103.2° and 190.2. Statistic results and measured reality are in phase. Judging from the runoff variation amplitude, Ouchikou is the largest and Taojiang is the smallest. Absolute variation amplitude difference lies in each river. Maximum variation is 402.5 × 10⁸m3 of Chenglingji outflow and Kangjiagang is the smallest of 7.3 × 10⁸m3. Of the four rivers, absolute runoff change of Xiangtan and Taojiang are generally inconsistent, while that of Taojiang and Shimen are with the same trend. This consistency has a close relationship with their catchment area. The Bigger area corresponds with the larger change rate of runoff.
Figure 2 gives an overall good consistency of annual runoff variation from four rivers and three bayous. From April to May, four rivers begin their rain period and runoff increase rapidly and peak in late May-early June, in the form of a single symmetrical peak.

Among all, Xiangtan and Taoyuan have larger peaks. Three bayous step into flood season in May-June. Their runoff peak out in July. Among them, the west branch of Songzikou and Ouchikou have larger peaks. The outflow at Chenglingji is alternately affected by flood peaks from three bayous and four rivers, experiencing a relatively longer flood period. It enters into flood period from April to May and then experiences a larger flow period from June-August. Flood peaks appear in late June-early July. The flood peak times is between that of three bayous and four rivers and disappears by the end of August. After a linear decrease, Dongting Lake enters into the dry season.
Concentration period of runoff in Dongting Lake is June-July of each year and the maximum runoff occurs in late June-early July. Flood happens in late July mostly. Zeng et al. analyzed the flood-inducing system of Dongting Lake and then made a conclusion as follows (Zeng, Hao, & Liu, 2004): The meteorology system in the upper reach leads to the flood. Watersheds of four rivers were in the same monsoon zone whose rain season is from May to August. Rain belt moved from upper reach to downstream or even cover the whole watershed. When four river’s flood arrived at the bank of Dongting Lake, it was experiencing its rainy period. The internal and external floods coincided to form severe disasters. The most typical examples are floods of Taojiang and Taoyuan in 1995 and 1996.
Inter annual runoff variability
Inter annual runoff variations are commonly calculated by variation coefficient (Cv) and inter annual extreme ratio. Cv is the ratio of the standard deviation and arithmetic mean of the sample sequence. It is an important indicator to reflect the evenness of inter annual runoff. Results are in table 2. According to calculation results, the Cv of inflow and outflow is between 0.194-0.761, among which three bayous’ Cv are larger than others’. Results demonstrate the variability and unstable status of inter annual runoff. Cv of three bayous is different from that of four rivers. The maximum Cv of three bayous is 0.761 in Ouchikou and that of four rivers is 0.277 in Shimen.

Runoff trend analysis
There are many methods to diagnose the continuous hydrological sequence. The most widely used and simple intuitive ways are moving average method and Mann-Kendall (marked by M-K) trend test method. This paper analyzes Dongting Lake’s inflow and outflow with M-K trend test method which is widely accepted by a hydrologist. This method does not assume the distribution form for the data under investigation, only provided it is random independent with its time. The statistical significance of the trend was assessed at the 5% in this paper.
Figure 3(a) shows four crosses of UF and UB within the confidential interval. Based on the statistical significance of M-K mutation test, 1995, 1980, 1983 and 1987 were possible runoff mutation time of Xiangtan. From 1957 to 1994, UF curve was below the zero line within the confidential thresholds which explained a downward but not obvious trend in its runoff. In fig. 3(b), UF statistic curve and UB statistic curve for 5 times within the confidential intervals; 1955, 1962, 1967, 1972 and 1978 were potential mutation time for Zi River. From 1956 to 1993, Taojiang’s runoff performed downward but not significant trend while in the rest of the time it was on the rise. Taoyuan’s UF and UB have seven crossover points within the confidential intervals. The abscissa value of these points was likely to appear during mutation moments. An unobvious descent trend occurred from 1956 to 1967, 1985 to 1995 and 2007 to 2011. In figure 3 (d), Shimen’s runoff trend was more complex than others. UF and UB coincided a lot in the confidential intervals and fluctuated. Its runoff went upward in 1951-1975 and declined in 1976-2011.But the trend was not significant for its crossovers were located in the confidential intervals.

Songzikou’s runoff in figure 4(a) presents that UF and UB intersected in 1985 within the confidential intervals. After the mutation, UF overcame the confidential threshold to form a significant change. It demonstrated that after continuous descending, its runoff experienced an obvious and sudden change in the vicinity of 1985 which was exactly the 4th year after the completion of Gezhou Water Control Project. The discharge kept on decaying after the mutation point. Taipingkou’s runoff in figure 4 (b) mutated at the same time with that of Songzikou and broke the confidential threshold in 1990 downwardly. The mutation time of Ouchikou’s runoff was earlier and it’s UF and UB met between 1975 and 1976 within the confidential zone. Its UF breaks the confidential zone and exhibited a significant attenuation trend in 1989. Ouchikou’s runoff was affected by the lower- Jingjiang River’s channel straightening project from 1967 to 1972. Figure 4 (d) shows outflow of Dongting Lake mutated between 1974 and 1975, after which the outflow revealed a continuous and downward oscillation and intersected with the confidential line in 1985 showing a significant attenuation.

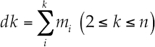
In order to identify the accuracy of M-K mutation test, this paper uses the mean-difference T-test to verify the accuracy of the mutation year. The results are shown in table 3.
Table 3 Mean-difference T-test statistic of annual runoff of three outflows, four rivers, and Chenglingji.
According to results from mean-difference T-test, statistic t value of three bayous and Chenglingji is 6.533, 7.660, 10.156 and 4.366, respectively. All have passed the significant test (significant level α = 0.01, the critical value is 2.704). Four rivers’ runoff did not mutate which means they have failed to pass the significant test.
Dry period and wet period of inter annual runoff series
To identify wet period and dry period of inter annual runoff series, this paper follow the hydrology forecasting manual established by the information center of the water resources ministry to define the runoff classification. The annual runoff anomalies (in percentages) Ki is defined into 5 levels: Ki < -20% is dry year, -20% ≤ Ki < -10%is semidry year, -10% ≤ KI ≤ 10% is normal flow year, 10% < Ki ≤ 20% is semi wet year, Ki > 20%is wet year.
According to annual Ki of four rivers in Hunan in figure 5 and table 4, we can find that wet years alternate with dry years. The percentage of normal flow year in Xiangtan, Taojiang, Taoyuan and Shimen are 22.95, 40.98, 36.07 and 27.87%, respectively. From wet to dry, percentages in each classification of Xiangtan are 22.95, 11.48, 22.95, 18.03 and 4.59%. These data listed above indicates a small inter annual runoff change and relatively equal wet and dry years in the last 61 years. The normal flow percentage of Taojiang is 40.98% which means very few floods and droughts in Zi River Basin. Wet years, dry years and normal flow years are of the same percentage in Shimen of Li river basin. It suggests a great even of inter annual runoff which is beneficial for the exploration of water resources. On the other hand, four rivers’ normal flow year percentage is the maximum followed by wet years’ and dry years’. Each level does not last long. Therefore, the flow of four rivers is neither wet nor dry sustainable. In other words, the water allocation is relatively average yields the likelihood of drought and flood is small.


The statistical anomalies of three bayous’ runoff describe its variation characteristics (figure 5, table 4). The portions of Songzikou’s normal flow years, wet year and dry year accounts for 32.79, 21.31 and 24.59% of the total. That is a fairly large inter annual change. The 5 ratios from wet to dry of Taipingkou is 24.59, 9.84, 22.95, 18.03 and 24.59% which is evener. In Ouchikou, the dry years account for 57.38% of all while the wet years occupies 32.79%.The dramatic inter annual water change is unfavorable for rational utilization of water resources. Figure 5 displays the runoff characteristic of three bayous. From 1951 to 1968, three bayous sustained in a wet period. During the period between 1969 and 1985, wet years alternated with dry years. From 1986 on, its runoff was low and exhibited an obvious duration till 2011. Ouchikou, in particular, with the maximum dry percentage, faces the severe risk of shrinking up. The increasing percentage of dry years of three bayous has posed a threat to the water utilization in the lake. At the same period, the outflow runoff in Chenlingji is evenly distributed. Its normal flow percentage is 37.7%, semi-wet and semi-dry portion are both 16.39%, wet and dry ratio are both 14.74%, which demonstrate the stability of outflow.
To further identify the characteristics of inflow and outflow, this paper curves Dongting Lake’s runoff by calculating its annual anomalies.
As can be seen from figure 6, since 21 century, four rivers have entered into a low flow period. The anomaly percentage of that period is the lowest in the past 61 years. Four rivers annual average discharge is 594 × 108m3, 198 × 108m3, 548 × 108m3, 139 × 108m3, respectively. Judging from the descending slope of that stage, the absolute value of 4 stations indicated a consistent reducing rate. Xiangtan station’s runoff from 1951 to 2011 can be divided into four stages: 1951-1955 and 1988-2002 were a wet period, 1956-1987 and 2003-2011 were dry periods. Taoyuan station’s runoff can be divided into 6 stages: 1951-1954, 1964-1983 and 1991-2003 were wet periods, 1955-1963, 1984-1990 and 2004-2011 were dry periods. Shimen station’s runoff can be divided into four stages: 1951-1973 and 1980-1983 were wet years; 1974-1979 and 1984-2011 were dry periods.

According to three bayous’ runoff cumulative anomalies (figure 6), Songzikou, Taipingkou, and Ouchikou stepped into the dry stage from the 1970s and 1980s, among which, Ouchikou’s flow reduced most early in 1971 and got worse after the 21 century so that its slope ratio reached the sharpest. Songzikou and Taipingkou began to reduce at 1986 and 1978, but their curve slope ratio is flatter so the inter annual change was less velocity. Based on the periodical statistics data of three bayous, their runoff can be divided into two stages. The wet periods of Songzikou, Taipingkou was and Ouchikou is 1951-1985, 1951-1977 and 1951-1970, while the dry stages are 1986-2011, 1978-2011 and 1971-2011.
The stage runoff changes are the result of comprehensive functions of nature factors and human activities. Based on existing research, the climate is the main factor that leads to the runoff change (Zhai, Ren, & Zhang, 1999); Liu, Ji, & Wu, 2006); Wang, Wang, & Zhao, 1999) water and soil erosion and hydraulic engineering constructions also accelerate the change to some extent (Li, 1998). The author used wave-let analysis to study the period of inflow and outflow of Dongting Lake. The conclusion is as follows: Xiangtan station’s runoff is characterized with multi-temporal periodicity, among which the period of 30-40a is the most distinct. Meanwhile, the first period of Taojiang station’s runoff is 30-40a, the most stable period of Taoyuan’s is 8-15a and the most obvious period in Shimen station is 20-27a. Those periods are identical with our stage analysis conclusion. The wavelet analysis of three bayous’ runoff is 25-40 (Songzikou), 22-40 (Taipingkou) and 25-40 (Ouchikou), which is also in accordance with this paper’s research. The conclusion means that three bayous will stay in a dry period now and move into another cycle in the next stage.
Conclusions and discussion
River runoff can reflect water quantity supplied from precipitation, as well as the hydrological phenomena such as watershed closure, soil infiltration, evaporation etc. Watershed storage change results from the comprehensive effects of climate change, hydraulic engineering construction, human activity and soil underlying surface parameters.
Concentration period of Dongting Lake’s runoff focuses on June-July each year. The maximum runoff appears in the late June-early July. Due to the time of combined flood peaks coming from three bayous and four rivers, floods are usually in late July, The catchments of four rivers come into the raining season from April to May, after which their discharge increases rapidly and reaches a peak in the late May and early June with a single symmetrical. The peak shape is approximately symmetric single. However, three bayous’ runoff starts their wet period in May and June and gets their peaks in July. The flood peaks superimpose in the lake and raise the water level. Meanwhile, the stage of Yangtze River rises, resulting in the flood jacking on the outflow of Dongting Lake and increasing the lake’s flood hazard. In summary, 1996 and 1998 extraordinary floods were the typical examples of floods superposition.
The variation coefficient of outflow and in-flow is between 0.194 and 0.761 which is pretty significant, especially that of three bayous. It can explain the instability of runoff and inter annual variation. All branches’ extreme ratio is bigger than 0.6, particularly that of three bayous, indicating the significant inter annual reduction. The water reduction of three bayous is the main reason of seasonal water shortage which aggravates the drought disaster and threatens water supply around the lake.
Wet years alternate with dry years regularly in four rivers’ regions. The normal flow percentages in Xiang River, Zi River, Yuan River and Li River are 22.95, 40.98, 36.07 and 27.87%, respectively, which accounts for the maximum possibilities of five classes. Percentages of normal years are followed by that of wet years and dry years who always appear in a short time which shows the water distribution is well allocated in four rivers. According to three bayous’ wet and dry period, Songzikou’s inter annual runoff is variable while Taipingkou’s is evener. The wet year percentage and the dry year percentage of Ouchikou are 32.79 and 57.38%. The dramatic inter annual change doesn’t make for the rational development of water resources. Three bayous’ drought possibility increases, with the dry percentage of Ouchikou the maximum, which indicates a higher risk of drying up and ultimately threatens the water utilization. The lake’s discharge is related to the atmospheric circulation, precipitation change, ENSO and solar activity.
According to M-K test results, four rivers’ runoff within the statistical time were mutated, the annual runoff trends fluctuate up and down, but did not break the confidence intervals. Thus the change is not significant. As can be seen, the hydraulic engineering constructions, water and soil conservation and other measures in four watersheds play significant ecological effects. Songzikou’s flow mutation occurred in 1985, after that, runoff showed significant attenuation changes, which may be one of the effects of the completion of the Gezhou dam in 1981. Taipingkou’s mutation time happened in 1985 which is consistent with that of Songzikou and a breakthrough confidential threshold in 1990 showed significant attenuation trend. Ouchikou broke the confidential threshold in 1989 then exhibited a significant attenuation trend afterward. From 1967 to 1972, after Jingjiang channel straightening, Ouchikou’s flow was greatly affected and decayed sharply.
The stage changes in runoff are affected by human activities and nature factors. Climate change takes the main responsibility for the runoff stage evolution, meanwhile, water and soil erosion, hydraulic engineering constructions and human activities accelerate the change progress. In climate respect, four rivers’ flood peak encounters with that of three bayous’ is the main cause of lake’s flood disaster. Since the 1990s, the Yangtze River basin has experienced several large precipitation progress, a flood from four rivers and three bayous superimposed on each other and lead substantial water to the lake. At the same time, the water level of outflow was very high. As a result, abundant income and flood water jacking yielded a high water level of the lake and caused severe flood disasters. Floods in 1954 and 1998 are such typical examples. Human activities don’t affect four rivers significantly for their water amount is large and inter annual fluctuation is small. But channel straightening, constructions of Three Gorge and Gezhou dam have changed the natural law between Dongting Lake and Yangtze River. Three bayous’ runoff attenuation has resulted in the seasonal drought of Dongting Lake. In conclusion, the appearance of Lake Flood is the result of floods superimposition by the flood from three bayous and four rivers. In the long-term, climatic is the dominant factor causes runoff change, while human activities such as building dam intensify the procedure.
The runoff variation of Dongting Lake are caused by the comprehensive impact of climate change and human activities, but how many the contribution rate of the two kind factors to runoff variation at inflows, outflow and totality respectively, what are the drive mechanism causing the difference of the contribution rate et al. These will be researched in future.

