


 nueva página del texto (beta)
 Inglés (pdf)
 Artículo en XML
 Referencias del artículo
 Enviar artículo por email
 Citado por SciELO
  Similares en
SciELO
Similares en
SciELO 
 Permalink
Introduction
With the development of hydrological automatic measuring technology, the hydrological data become more and more sufficient nowadays. The best way to make full use of these big hydrological data is to adopt the machine learning method. The most popular machine learning methods, which have been widely used in the field of hydrological simulation, are the artificial neural network (ANN) and K-nearest neighbor (KNN) method (Li et al., 2014; Chen et al., 2017; Dong et al., 2015; Kan et al., 2016a, 2016b, 2016c, 2016d, 2016e; Lei et al., 2016; Li et al., 2016; Zuo et al., 2016). In previous literatures, we proposed an effective and efficient machine learning based streamflow simulation model, NU-PEK model, which is constituted by coupling the ANN and KNN methods. It has been successfully applied in the field of event-based hourly streamflow simulation task. However, when applied to daily streamflow tasks, its performance becomes poor significantly.
In order to overcome the poor performance problem of the NU-PEK model for daily stream-flow simulation task, we proposed an improved machine learning based streamflow simulation model, named PKEK. The PKEK model is composed by partial mutual information (PMI) based input variable selection (IVS) module, the K-means clustering input vector clustering module, the ensemble artificial neural network (ENN) based output estimation module, and the KNN based output error estimation module. The PKEK model and the previously proposed NU-PEK model were applied in Chengcun catchment in China to compare the model performance and stability. Simulation results indicated that the improved model has better accuracy and stability, and has a bright application prospect for daily streamflow simulation task.
Watershed, hydrological and meteorological data utilized in this research
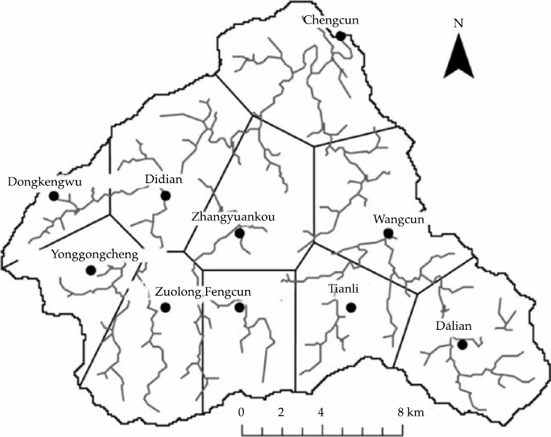
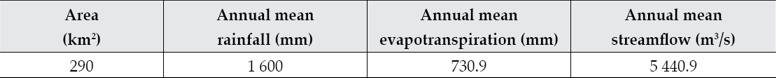
The daily streamflow simulation is carried on in the Chengcun catchment. The Chengcun catch ment lies in the Qiantang River basin, Anhui province, China. It is located in the subtropical monsoon region and is a typical humid catchment. Rainfall mainly falls in the period from April to June. There are ten rainfall gauges located in this area. Observed daily rainfall, evaporation, and average discharges range from 1986 to 1994 were utilized as the calibration data, while data from 1995 to 1999 were utilized as the validation data. The watershed map, hydrological and meteorological characteristics for the Chengcun catchment are shown in figure 1 and table 1.
Methodology
K-means clustering algorithm
The K-means clustering is a famous and widely used partitioning and clustering method (MATLAB, 2012; Grigorios & Aristidis, 2014; Kapageridis, 2015). It is a method of vector quantization, originally from signal processing, that is popular for cluster analysis in data mining. K-means clustering aims to partition n observations into K clusters in which each observation belongs to the cluster with the nearest mean, serving as a prototype of the cluster. The K-means method is usually calibrated or trained by the iterative method which minimizes the sum of distances from each object to its cluster centroid over all clusters.
PEK model
The PEK model is a hybrid data-driven model (Kan et al., 2015a, 2015b) and is composed by ensemble artificial neural network (ENN) and K-nearest neighbor (KNN) algorithm. The PEK approximator functions as a general purpose function approximator. It can be applied for the simulation of the multi-input single-output (MISO) system mapping relationship. The PEK approximator is firstly proposed by Kan et al. (2015a, 2015b) and its detailed principle can be found in the corresponding literatures (Kan et al., 2015a, 2015b).
PKEK model
PKEK model is an improved version of the previously proposed PEK model. It is proposed for the purposed of improving the non-linear simulation capability of the PEK model. It is combined by the PMI-based input variable selection (IVS) module, the K-means clustering algorithm based input variable clustering module, and the ENN and KNN simulation module. The PKEK model can be seen as a hybrid approximator which composed by a K-means clustering module and multiple PEK modules. The simulation and calibration method of the PKEK model is as follows: The input variables are selected by the PMI-based separate IVS scheme to generate the selected input vectors. After that, each selected input vector is fed into the K-means clustering algorithm to determine which category it belongs to. After that, for each selected input vector, we choose a corresponding PEK module to calculate the output. In the PEK module, the output is estimated by the ENN, and the output error is estimated by the KNN regression. The final simulated output is the sum of the estimated output and output error. The calibration of the PKEK approximator is almost the same with the PEK approximator. The difference is that the K-means algorithm needs to be calibrated by an iterative method (Grigorios & Aristidis, 2014; Kapageridis, 2015).
Non-updating RR simulation of the PKEK model
The non-updating modeling approach of the PKEK model is similar to the previously proposed NU-PEK model. The difference is the addition of the K-means clustering algorithm. The modeling approach of the PKEK model is as follows:
 (1)
(1)
 (2)
(2)
 (3)
(3)
 (4)
(4)
 (5)
(5)
 (6)
(6)
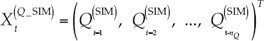
where  denotes the candidate simulated antecedent discharge (SAD) input vector;
  denotes the candidate sliding window cumulative rainfall (SWCR) input vector;
  denotes the SAD, i=1, 2, …, nQ;
  denotes the SWCR with sliding window width i, i=1, 2, …, nP; nQ and nP denote the order of the SAD and the SWCR respectively; IVSQ_SIM denotes PMI-based IVS for candidate SAD input vector; IVSSWCR denotes PMI-based IVS for candidate SWCR input vector;
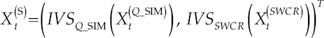
  denotes the selected input vector;
  denotes the estimated output discharge associated with ;
  denotes the estimated output discharge error associated with ;
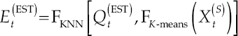
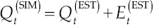
  denotes the simulated output discharge and it is the final prediction of the output discharge; FEBPNN denotes the EBPNN discharge estimation; FKNN denotes the KNN discharge error estimation; FK-means denotes the K-means clustering algorithm. The non-updating simulation procedure of the PKEK model for each flood event is almost the same with the NU-PEK model. The difference is that after the PMI-based separate IVS, the K-means clustering algorithm is executed to classify the input vector and fed it to different PEK module to calculate the forecasted discharge value.
Calibration of the PKEK model
The calibration of the PKEK model is almost the same with the NU-PEK model. The difference is the addition of the calibration of the K-means clustering method. The K-means algorithm is calibrated by the iterative method and this calibration process is repeated for 500 times with different initial parameters to avoid the local minimum problem. The optimal number of classes is determined by the Silhouette value. In this paper, approximately 70% of the flood events are utilized to create the calibration data and the remaining events are utilized to create the validation data.
Results and discussion
Model structure and parameter calibration
Input variable selection
Considered that we are studying the daily simulation, we set the order of SWCR and SAD (i.e. nP and nQ) equal to 10 and suppose 10 is large enough. This means that the rainfall will becomes runoff with a lag at most 10 days. After the IVS we have found that the lag time of most selected SADs are less than 10. Therefore, we conform that the order of 10 is large enough to describe the mapping relationship between the rainfall and runoff data of the Chengcun catchment.
K-means clustering
We use the Silhouette value to optimize the best number of clusters. The Silhouette refers to a method of interpretation and validation of consistency with clusters of data. The technique provides a succinct graphical representation of how well each object lies within its cluster (Rousseeuw, 1987). The classification result show that the Silhouette value reaches the maximum value when the input samples are clustered into 3 clusters. Therefore, we divide the input sample into 3 clusters.
The PEK module
The PEK module are calibrated by the NSGA-II, LM, and cross-validation methods. The arithmetic parameters of the NSGA-II algorithm are set as: population size = 90, evolution generation total number =1000, crossover probability = 0.85, and mutation probability = 0.15. The arithmetic parameters of the LM method are set as suggested by the MATLAB software. As for the early stopping strategy, approximately 3/4 of the calibration data are utilized as the training set, and the remaining data are utilized as testing set. The maximum number of testing failures is set to 5. The lower and upper boundaries of K for the KNN algorithm are set to 1 and 300, and the K is optimized by the leave-one-out cross-validation method. Because we divide the input samples into 3 clusters, we construct a PEK module for each cluster for the PKEK model. The objective function used for the NSGA-II algorithm is mean squared error (MSE), mean squared value of the network parameters (MS), and hidden layer neuron number. The calibration results indicate that all the Pareto fronts distribute evenly which means that the optimization results is reasonable.
Model performance comparison
Scatter plots comparison
We use the scatter plots of the observed and simulated discharges and the regression R values to inspect the overall performance of the models. The scatter plots and the regression R values are demonstrated in figure 2.
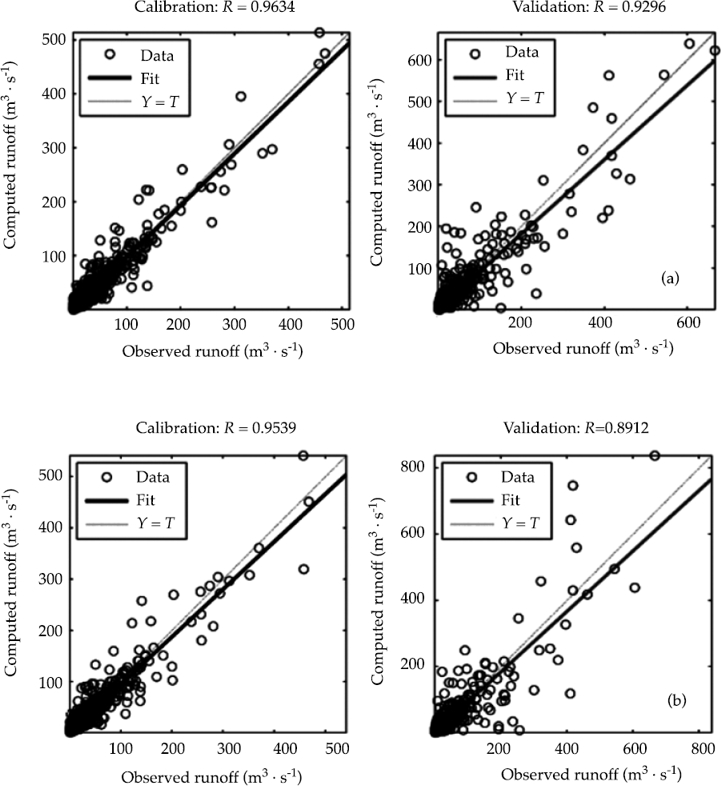
Figure 2 The scatter plots of the observed and simulated discharges and the regression R values: (A) PKEK model, (B) NU-PEK model.
As demonstrated in figure 2, as for the calibration period, the PKEK model obtains better result (R = 0.9634). The NU-PEK model obtains the worse result (R = 0.9539). It can be noticed that the data scatters of the PKEK model intensively lie close to the 45 degree line. The distribution of the data scatters of the PKEK model is relatively more uniform for small, middle, and large discharge values. These results indicate that the PKEK model generates the best result and obtains the most stable performance in the calibration period. As for the validation period, the PKEK model obtains the best result (R = 0.9296). The NU-PEK model obtains the worse result (R = 0.8912). As demonstrated in the figure 2, the data scatters of the PKEK model distributed normally around the 45 degree line. This result indicates that the simulation results of the PKEK model do not have bias to be larger or smaller and shows a very stable property. However, the simulated discharges of the NU-PEK model is larger than the observed values. This phenomenon becomes more obvious especially for large discharge values.
After analyzing the accuracy in calibration and validation period, the accuracy declination is also compared in this section. The PKEK model obtains better accuracy declination value (0.9296/0.9634 = 0.9649), and the NU-PEK model obtains worse accuracy declination value (0.8912/0.9539 = 0.9343). The comparison of accuracy declination value shows that although the PKEK model outperforms the original NU-PEK model and generates better forecasted results.
The analysis of the three models shows that the PKEK model can generate better overall results than the original NU-PEK model. As demonstrated in figure 2, for peak values, the PKEK model is much better than the NU-PEK model. The comparison results indicate that the PKEK model outperforms the NU-PEK model in Chengcun catchment and prove its satisfactory accuracy and stability.
Simulated hydrographs comparison
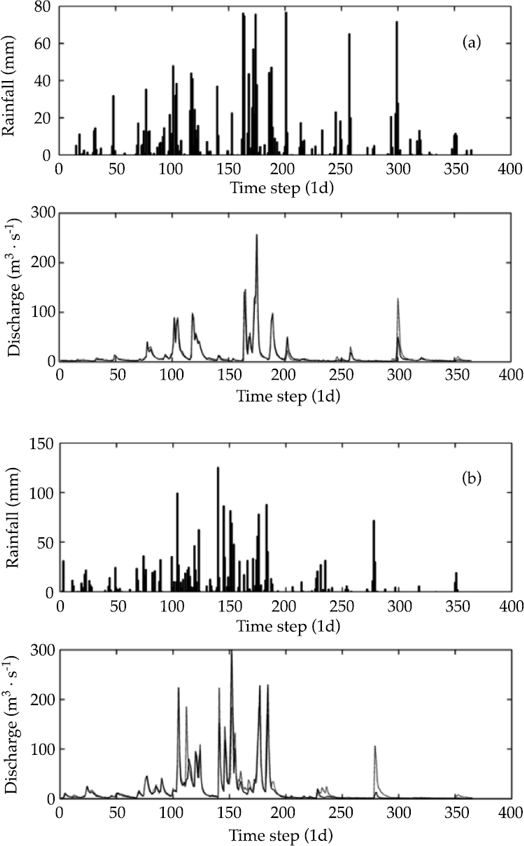
Figures 3 and 4 show the observed and simulated hydrographs in the calibration and valida tion period of the PKEK and NU-PEK models, respectively. Due to the space limitation, we only demonstrate two hydrographs for each model. They are year 1986 for calibration and year 1995 for validation, respectively. As shown in these figures, a further ascendency of the PKEK model is that the hydrographs simulated by the PKEK model are much smoother. The hydrographs simulated by the PKEK model are more consistent with the observed hydrographs. The improvement in hydrograph shape is owe to the inclusion of the SADs and is attributed to the autoregressive characteristic of the ANN models. The ANN models place a higher weighting to the latest simulated discharge value utilized as inputs to the model. As a result, the model follows the general trend as prescribed by the simulated discharge.

Conclusions
An improved hybrid data-driven model, named PKEK, is proposed in this paper to overcome the disadvantages of the previously proposed NU-PEK model in daily RR simulation. For the purpose of comparing performances of different models, the PKEK and NU-PEK models are applied to daily RR simulation in the Chengcun catchment. It can be remarked that the PKEK model is able to simulate generally much better runoff hydrograph than other models. From the application and analysis of the PKEK model, we can conclude that:
The PKEK model have all the advantages of the previously proposed NU-PEK model, including better calibration and validation non-updating simulation accuracy, automatic calibration without much impact from human experiences, good compromise between the sufficiency and parsimony of the input data, and good compromise between the simulation accuracy and topology complexity, and so on. Compared with the original NU-PEK model, the performance of the PKEK model becomes much better for the daily RR simulation. The improvement in the goodness-of-fit to the observed discharge of the PKEK model is owed to the addition of the K-means clustering method combined with the utilization of multiple PEK modules. With the clustering method and multiple PEK modules, the PKEK model can simulate the characteristics of the RR relationship much precisely and it’s forecasting capability and stability becomes better. Furthermore, the hydrographs simulated by the PKEK model are much smoother and more consistent with the observed hydrographs. The smoother performance of the PKEK model is attributed to the autoregressive nature of the ANN which allocates a higher weighting to the antecedent discharge inputs.

