


 nueva página del texto (beta)
 Inglés (pdf)
 Artículo en XML
 Referencias del artículo
 Enviar artículo por email
 Citado por SciELO
  Similares en
SciELO
Similares en
SciELO 
 Permalink
Introduction
In the arid and semi-arid regions of China, many hydrological changes have occurred due to the impact of climate change and human activities (Zhao & Cheng, 2002; Huang & Pang, 2010), particularly the irrigation projects with use of groundwater. Groundwater in the arid areas plays an important role in ensuring the stability of the desert and oasis ecosystem (Naumburg, Mata-Gonzalez, Hunter, Mclendon, & Martin, 2005; Mu Oz-Reinoso, 2001; Gullison & Bourque, 2001). Tarim Desert Highway shelter-belt ecological engineering project is the longest artificial shelterbelt system crossing drifting desert. It has been completed 436 km protection forest in the Taklimakan desert, sometimes known as “the green corridor”. Groundwater resources in the desert region are very precious, and various environmental problems could arise without optimal use and effective conservation (Zhang, 2004). One of the most pertinent issues in achieving water saving irrigation is to study the formation and movement pattern of water in the vadose zone. The thickness of vadose zone along desert highway is different, and the irrigation system for shelterbelts is the same, which is conducive to the convenient management of water resources, but is also an indirect waste of groundwater resources (Han, Cao, Yimit, Xu, & Zhang, 2012). Currently, there have been few reports on the effect of irrigation with saline water on the growth of artificial forest and groundwater environment (Li, Lei, Zhao, Xu, & Li, 2015; Zhang, 2016). These studies not only help deepen the scientific insight into the SPAC (soil-plant-atmosphere continuum) (Shaozhong, 1994), but also have important guiding significance for groundwater pollution control as well as ecological and environmental engineering projects (Guswa, Celia, & Rodriguez-Iturbe, 2002; Scott, 2001).
The volume of irrigation water and the salt distribution in soil profile can affect the salt leaching process (Swarajyalakshmi, Gurumurthy, & Subbaiah, 2003), so the soil salt dynamics has been extensively explored (Xu, Li, & Wang, 2006; Zhou, Xu, Lei, & Li, 2006; Miyamoto, Chacon, Hossain, & Martinez, 2005; Mousavi, Soltani-Gerdefaramarzi, & Mostafazadeh-Fard, 2010). However, most of the laboratory studies were focused on the effect of water and soil properties on the response to irrigation, while there is scarce information on the impact of drip irrigation with saline water on the growth, soil, and groundwater of Tamarixramosissima and Haloxylonammodendron forests under desert environment. Therefore, the purpose of this study is to evaluate the impact of drip irrigation with saline water on plant growth in shelterbelts and underground environment in the study area under natural conditions. In this study, four irrigation experiments with different water treatments were set up in which water volume decreased gradually, and the cross-sectional distribution of water and salt for each treatment and ultimate impact on the groundwater environment were analyzed. Finally, an approach for water conservation and the observed differences between various treatments were described.
Experimental
Study area
The Taklimakan desert is the largest desert in China, at the same time, is the world’s second-largest drifting desert, and covers an area of 33.7 square kilometers (Sun & Liu, 2006). It is located in the center of Tarim basin in northwest China. This basin is a major area for producing oil and gas resources in China. The Tarim Desert Highway crosses the Taklimakan desert from south to north. The shelterbelt forests were built on both sides of the highway with the width of 72-78m. Due to the distance of the road across, the drifting desert is the longest in the world (Alles, 2012), so it is listed in the Guinness Book of Records.
From north to south, Tarim Desert Highway sequentially crosses five major geomorphic units-compound transverse dune area, dome-shaped dune area, high compound longitudinal dune area, compound longitudinal dune area, and compound transverse dune area (Lei et al., 2008). The study area is located in a dome-shaped dune area and the geomorphic unit has a total length of about 20 km, and the ground-water level is generally around 2 m. The water supply for the shelterbelt is basically ground-water with total dissolved solids (TDS) was 4.138 g/l and pH value is 7.21. The main pipe was used to convey the water from the ground while the branch pipe diverted the water with drippers installed on the drip tube for irrigation. The Aeolian sandy soil is fine sand, the soil bulk density of peripheral plantations is 1.43 g/cm3, and the soil porosity is 45.55%.
Test design
In order to effectively use the groundwater characteristics of the regions with relatively rich groundwater resources and to achieve water-saving irrigation, three additional water supply schemes for conservation of water resources were proposed based on the original irrigation system for shelterbelt project. As shown in figure 1, the entire shelterbelt land irrigated by well water was divided into four regions: region I with the existing irrigation system and regions II, III, and IV with modified irrigation systems for the comparison with region I (table 1).
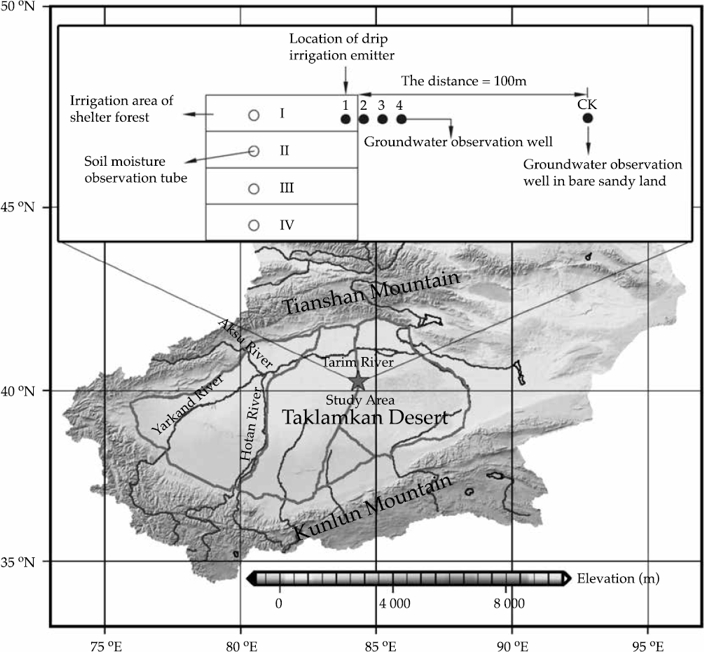
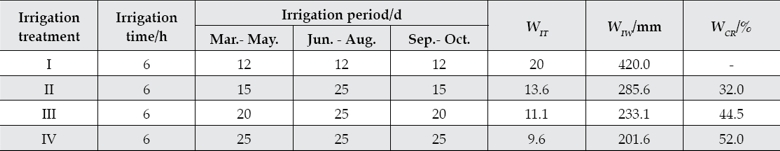
Since the Tarim Desert Highway Ecological Shelterbelt Project completion in 2005, the annual irrigation cycle from March to October was used for the shelterbelt. Under the condition of sufficient water resources for the spring and autumn irrigations, the above irrigation period was elongated, so that plants were under water stress compared to the original irrigation system. The growth of plants in different regions was monitored, in order to achieve effective water conservation without affecting plant growth. The specific experimental design is shown in table 1.
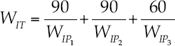
The data in table 1 are calculated as follows
Annual irrigation times (WIT):
 (1)
(1)
Irrigation water (WIW):
 (2)
(2)
Water conservation rate (WCR). We set irrigation treatment I′ for WIW = WIWCK:
Then:
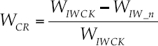 (3)
(3)
Here the number of days with irrigation is 240 from March to October. The water volume that drips out of emitters is 3.5 × 10⁻³ m3 per hour. The control area of the drip water emitter is 1 m2. The single irrigation time is 6 hours per emitter. WIP is irrigation period/interval, WIP_1,WIP_2,WIP_3 are March to May, June to August, and September to October irrigation periods, respectively; n is II, III, IV.
Measurement and analysis
The effect that saline water irrigation to the groundwater was observed by four wells from the emitter every 30 cm called 1, 2, 3, 4, and set a control check (CK) observation well in bare sandy land around 100 meters away (figure 1). It reflected cumulative-change values by subtracting groundwater level and chemical indicators (TDS, pH, total alkalinity & total hardness) before the irrigation from the corresponding value after irrigation, where TDS were tested by using the 180 ºC drying weight method (APHA-AWWA-WEF, 1998). Measurement of pH was performed using a pH meter (Model PHS-3C, Shanghai Lici Ltd., China). Total alkalinity was determined by titration with acid (Larocque et al., 2016). Total hardness was determined by an EDTA complexometry.
The effect of the irrigation to the groundwater level was observed every day in an irrigation period 12d. It measured by releasing a probe connected with a multimeter by dual-cable wire into the well pipe. The multimeter was switched to the resistance shift. When the probe touched the water table, the cable was marked at the height of the well head, and the distance between the mark and the probe was measured after retrieval. The subtraction of the nth water table observation Hn data from the initial observation data H0 gave the relative water level at the nth observation (H0−Hn) to each observation wells.
Seedling investigation method was used for shelterbelts trees during the whole growing season, ten representative plants were randomly selected by human from Tamarixramosissima and Haloxylonammodendron respectively, and three indicators of plant height, crown width, and diameter at the ground level were measured. The One-Way ANOVA and least significant difference (LSD) method were used to analyze the influence of irrigation water for plant growth using SAS statistical software (version 9.1, SAS Institute Inc.).
Regular on-site investigation method was adopted to observe the soil salt in the experiment area on 1d, 6d, and 9d after irrigation. Soil electrical conductivity (EC) exhibiting a linear relationship with soil salinity within the study area (Wang, Xu, Lei, Li, & Wang, 2010), the respective EC value was measured, in order to assess the soil salinity, by a SY-3 conductivity-thermometer (Institute of Soil Science, Chinese Academy of Sciences, 1987) with the weight of water: soil = 5:1 (Han, Cao, Yimit, Xu, & Zhang, 2012). The soil samples were collected at depths of 0, 5, 15, 25, 35, 55, 75 and 95 cm under the emitter with the horizontal distances of 0 to 150 cm every 30 cm from the emitter. Three samples per each fixed point were used to measure EC.
In each experimental area, a 2 m long Soil moisture observation tube was embedded into soil under emittter made of aluminum/plastic composite pipe of 50 mm in diameter. Soil moisture was determined via neutron probes (Gardner & Kirkham, 1952) with five replicates after irrigation, then the mean value of replications was used as the soil water content. This rapid, in situ, nondestructive means of measuring soil moisture profiles in forestry (Wells & Fityus, 2011) was used in this work to determine soil moisture at 10-cm intervals from the soil surface to a depth of 180 cm.
Results and discussion
Spatial distribution of soil water and salt under different irrigation conditions
Water spatial distribution
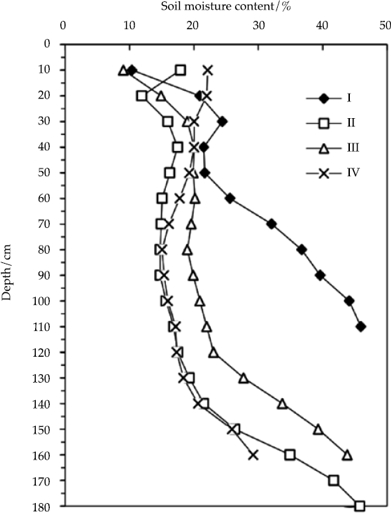
Four different irrigation cycle experiments during irrigation season were carried out in four different regions of well irrigation area (table 1). According to figure 2, after the irrigation, the soil water content in region I with the original irrigation system reached saturation at a depth of 100 cm, while the soil water content in regions III, II, and IV reached saturation at depths of 160, 180, and 160 cm, respectively. Due to the shallow groundwater in the entire irrigation area, an aquifer is present within 180 cm soil depth, while the groundwater depths of four irrigated areas were different. The shallowest and the deepest groundwater depths were found in regions I and IV, respectively, with a gap of about 60 cm. Therefore, irrigation has a relatively high impact on the surface soil water, but a feeble one on deep soil water; the soil water content of each region can be maintained at a high level with the soil porosity of 45.55%.
Salt temporal change
Since shelterbelt plants have high tolerance to soil salinity, plant could grow normally under various irrigation systems, and soil salinity increases from spring to autumn (Huang et al., 2015). Due to multiple repeated irrigation cycles, salts dissolved in irrigation water may increase soil salinity, resulting in a salinity level higher than that tolerated by the plant (Zhang et al., 2008), so understanding of the patterns of the salt migration and accumulation is very important. For example, the pattern in salt migration of region I was studied by continuous salinity monitoring within the irrigation cycle. As shown in figure 3(b), 3d after irrigation, the total soil salinity was significantly reduced, as compared to that in figure 3(a) and there was no significant salt accumulation. Most of the salt was infiltrated with the soil water from the range defined by the dashed line in figure 3(a) (i.e. the range from the surface to 20 cm) through the vadose zone into groundwater body. As can be seen from figure 3(c), over the course of evaporation and water redistribution, the salt gradually moved from the lower layer to the upper one in the vadose zone, and was accumulated in a depth range from 0~25 cm (dotted line) on day 9. Figure 3(d) shows that salt was continuously accumulated in the surface soil body at a horizontal distance of 20-140 cm from the dripper and a depth of about 20 cm.
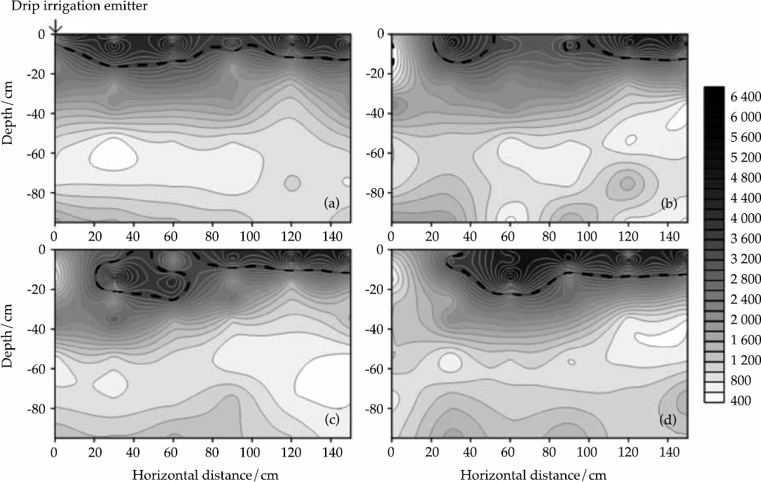
Figure 3 Soil salt migration process within the irrigation cycle (a) Isoline of soil electrical conductivity one day after irrigation; (b) Isoline of soil electrical conductivity three days after irrigation; (c) Isoline of soil electrical conductivity six days after irrigation; (d) Isoline of soil electrical conductivity nine days after irrigation.
Differences in plant growth under various irrigation volumes
With the survey method for shelterbelt tree seedlings, ten representative plants were randomly selected for the measurement of plant height, crown width, and diameter at the ground level. These characterization parameters are used to reflect the impact of different irrigation systems on plant growth. Single-factor analysis of variance was used to analyze the data from statistical experiments, and the respective results are presented in table 2.
Table 2 Variance analysis of the increment in plant growth with different irrigation treatments for selected plants.
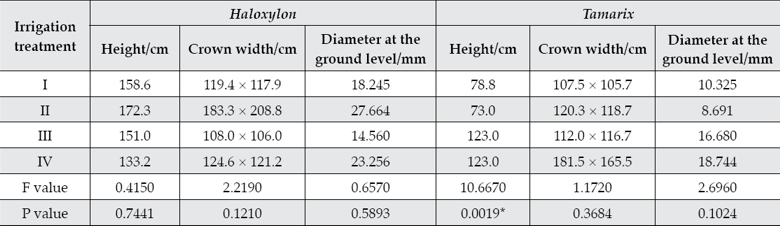
Note: * There is significant difference at p = 0.05; in the plant height, crown width, and diameter at the ground level.
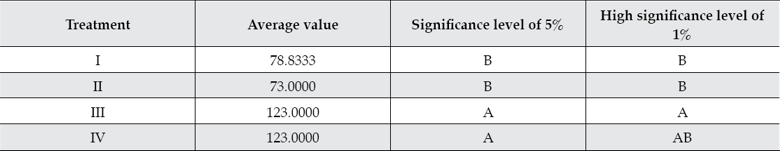
The comparative analysis of the above results revealed no significant differences on all indicators of various treatments, except for plant height of Tamarixramosissima. This indicates that various irrigation systems have no significant effect on plant growth. The plant height difference for Tamarixramosissima can be assessed using the multiple comparison procedure among groups, which yields the results as shown in table 3. As can be seen, no significant difference was found between regions I and II, while there were differences found between region I and region III or region IV at the significance level of 5%. At a high significance level of 1%, there were differences between regions I and III.
Impact on groundwater
Groundwater level
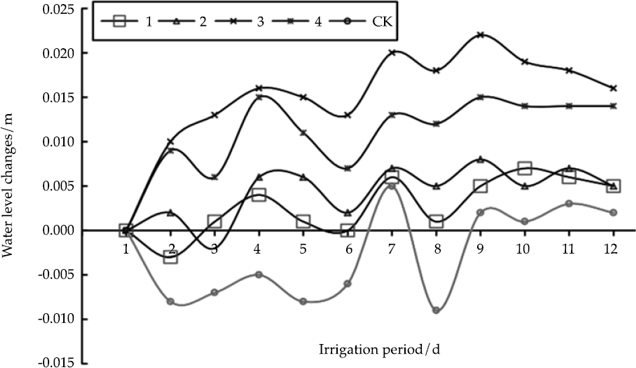
The values of the groundwater level changes at different observation wells during each irrigation period were obtained by subtracting the groundwater level after irrigation from the groundwater level before irrigation (figure 4). According to the changes in the groundwater level at different observation wells, the water levels in the four groundwater observation wells in the shelterbelt area showed an upward trend. The highest water level at No. 1 observation well was reached on day 10, and the highest water levels at the remaining three observation wells were reached on day 9. On the other hand, no obvious change pattern was found in the groundwater level in the observation well CK that was located in the original sands outside of the shelterbelt. According to observational data, the largest and the smallest rises of water levels were 0.022 m (No. 3 observation well) and 0.001 m (No. 1 observation well), respectively, indicating that irrigation can raise groundwater levels, but this effect is feeble, resulting only in few centimeter changes.
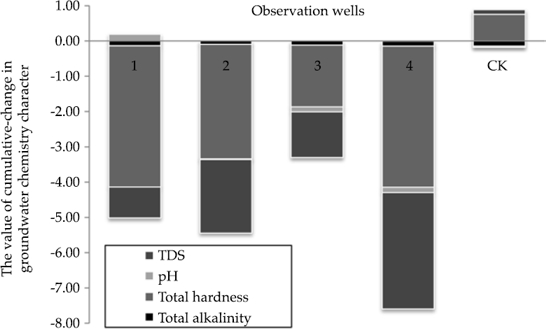
Groundwater chemistry
In this study, groundwater chemistry was indicated by pH, TDS, total hardness and total alkalinity (Salem, Atwia, & El-Horiny, 2015). The value of cumulative-change as relative comparison was carried out to obtain the change values compared with the initial value, such as heavy metal accumulation (Unterbrunner et al., 2007), plant relative growth yield (Keyantash, & Dracup, 2002), cumulative precipitation (Alkhayri & Albahrany, 2004), etc. Figure 5 shows that the main characteristic changes in groundwater chemistry were reflected on the changes in TDS and total hardness. The changes in the above mentioned two indicators decreased within the shelterbelt area, while the changes of the same two values increased for the bare sandy land outside of shelterbelt land (the change was positive). Therefore, under the influence of irrigation projects, the groundwater environment in the local areas allowed the TDS and total hardness of groundwater in the shelterbelt area covered by the irrigation system to exhibit the significant upward trend. However, values of pH and total alkalinity showed no significant changes.
Discussion
In this study, we have designed a water-saving irrigation test at the desert shelterbelt land irrigated by groundwater was designed. There were 4 testing treatments have used to study the effect of the distributions of different irrigation schedules to soil moisture and salt, plant growth and groundwater chemical. It was revealed that the irrigation has a relatively high impact on the surface soil moisture, but a feeble one on deep soil. The study of soil moisture in the direction perpendicular to the horizon indicates that the soil moisture varies slightly below a soil depth of 100 cm (Wang et al., 2008). With the same age of forest, the soil moisture gradually increases from surface to deep soil (Zhang et al., 2008). Other studies have shown that the distributions of the soil water content at the capillary saturation zone were determined by groundwater, while vegetation could affect the soil salinity, but not soil moisture (Wang et al., 2012).
The soil salt was continuously accumulated to the surface soil body at a horizontal distance of 20-140 cm from the dripper and a depth of about 20 cm. It is in agreement with the salt accumulation at the shifting aeolian sandy soil surface (Zhang, 2008), and has different temporal dynamics in an irrigation cycle (Zhang, 2016). In addition, some other factors also influence the spatial distribution of soil salinity such as soil spatial variability, groundwater salt content (Huang et al., 2015; Rose, Konukcu, & Gowing, 2005), because the clay soil is suitable to adsorb soluble salt ions (Brantley S L. Geology, 2008).
Some studies indicate that average soil moisture above 6% in shelterbelts along the Tarim Desert Highway can meet the requirement for plant growth (Unterbrunner et al., 2007). By our water-saving irrigation test, the plant growth was not abnormal, while average soil moisture above 21%, and 32% of water could be saved when the irrigation treatment in region II was used. Based on this work results, more efficient irrigation methods can be elaborated for similar applications.
Conclusions
Irrigation has relatively large impact on the water content of surface soil, but has little effect on deep soil water content. In the layer with root distribution, the soil water content of each region could be maintained at a high level. Three days after irrigation, the entire soil salinity was significantly decreased, as compared to that before irrigation, indicating that most salt was infiltrated with water via the range from soil surface to 30 cm entering the groundwater body. The groundwater level, TDS and total hardness exhibited an upward trend in the shelterbelt area.
The plant growth showed no significant variations under the impact of various irrigation treatments. Based on the analysis of variance, the response in the radial growth of Tamarixramosissima tree trunk is more sensitive to water stress. Therefore, if the statistical results obtained are verified and the height growth issue of Tamarixramosissima is disregarded, then at least 50% or more of water as well as the corresponding manpower and resources could be saved when the entire area was irrigated with the irrigation system in region IV. If the above issue is considered, 32% of water could be saved if the irrigation system of region II was used.
The results in this paper can provide a very good theoretical support on the sustainability study on desert shelterbelt systems, and also show practical significance in the study of the relationship between shelterbelt irrigation volume and shelterbelt tree growth. However, the investigation on the status of shelterbelt plant growth is affected by subjective factors, including standard plant selection, judgement of observation staff, and differences in readings, and objective factors, including observation tools, microtopography, soil heterogeneity and observation time. The results of statistical analysis can be affected to some degree. Therefore, in order to obtain more accurate data, it is necessary to strengthen the standardized operation for observers, adopt a more scientific and convenient measurement instruments, increase the observation density, and increase observed sample density. Therefore, the data from a longer scientific observation is still needed for validation.
Author contributions
Jinglong Fan designed the study and analyzed the experimental data, wrote and edited the paper.Yaping Wei, XinwenXu andXinghu Yang provided the plan and suggestions on writing and editing this paper. All authors have read and approved the manuscript.
Conflicts of interest
The authors declare no conflict of interest.

