


 nova página do texto(beta)
 Inglês (pdf)
 Artigo em XML
 Referências do artigo
 Enviar este artigo por email
 Citado por SciELO
  Similares em
SciELO
Similares em
SciELO 
 Permalink
Introduction
All cities —even those in wealthy countries— are vulnerable to disasters and extreme climate events, and their resilience and capacity to cope vary markedly (Seto, Parnell, & Elmqvist, 2013). Therefore, achieving urban sustainability and resilience is a priority for all governments (Sukhdev, 2013). Recently, besides the physical vulnerability approach, the social vulnerability approach has been proposed as a crucial perspective in discussing the causes of contemporary disasters, because it stresses human agency when discussing the issues of environmental change, or the occurrence of disaster (Lee, 2014; Khan, 2012).
Some researchers have suggested that given identical natural hazards, the consequent damage will be more severe when the social system is more vulnerable (Cutter 1996; Cutter, Boruff, & Shirley, 2003; Mendes, 2009; Menoni, Molinari, Parker, Ballio, & Tapsell, 2012; Turner et al., 2003). Thus, because the structural characteristics of social systems moderate various impacts of disasters, discourse on disasters is considered a social construct rather than a simple natural event (Adger, Brooks, Bentham, Agnew, & Eriksen, 2004; Adger et al., 2011; Cutter, 1996; Cutter, Mitchell, & Scott, 2000; Cutter et al., 2003; Khan, 2012; Tierney, 2007).
Some scholars have noted that the traditional epistemology of disaster was based on an “event-based” perspective that overemphasized specific disaster events such as typhoons or earthquakes. However, it is easy to overlook that many disasters have human causes. For instance, overuse or improper use of slopelands owing to urbanization can cause building collapses and landslides. Focusing solely on a disaster event or its immediate impact excludes consideration of human agency (Tierney, 2007).
The institutional roots of disasters thus are difficult to improve, and consequently social vulnerability researchers consider the “process of vulnerability” necessary to understand the causes of disasters (Turner et al., 2003). Such understanding of disasters can help establish more local-contextual strategies to respond to disasters, environmental changes and sustainable lifestyles (Turner et al., 2003). Hence, only by understanding disasters from the perspectives of trajectory and process, is it possible to clarify the limitations and possibilities for human action when facing changes in social-environmental systems.
On the other hand, rural-urban mobility has increased urbanization in both developing and newly developed countries. Socio-economic articulation is also increasing between larger and smaller urban communities (Barbieri & Carr, 2005). Indeed, a hallmark of contemporary urbanization is that urban areas are growing faster and larger than before, and in new geographic locations (Fragkias, Güneralp, Seto, & Goodness, 2013). Furthermore, since the 1990s, urbanization has led to clear trends of an ageing rural population and shrinking working population in the agriculture, forestry and fisheries sectors (Kohsaka, Shih, Saito, & Sadohara, 2013). Consequently, the most vulnerable residents tend to be socioeconomically deprived. Such residents also tend to live in informal or traditional settlements, located in areas at the greatest risk for flooding or landslides, and also for eviction during environmental crises (Nagendra, Sudhira, Katti, & Schewenius, 2013).
Social fragmentation refers to the social organization or structure of a neighborhood, where a highly fragmented neighborhood influences social connections within the neighborhood and between residents, with potential consequences for the quality of social life (Ivory, Collings, Blakely, & Dew, 2011). The social fragmentation construct fits broadly into the social properties of neighborhoods, along with the more commonly used social cohesion and capital constructs. However, few studies have examined social fragmentation can be used to examine the relationship with vulnerability.
This study applies social fragmentation to explore the integration of a social system to supplement social vulnerability index. Furthermore, this study examines whether longitudinal data can represent the trend of social fragmentation and potential responses in the face of natural hazards in Chiayi County, Taiwan, a newly industrialized country.
Social vulnerability, social fragmentation and disaster
Vulnerability has become an important concept in elucidating the condition of a system or its vulnerability to damage from hazards (Lee, 2014). Vulnerability is “the degree to which a system is susceptible to, or unable to cope with, adverse effects of climate change, including climate variability and extremes. Vulnerability is a function of the character, magnitude and rate of climate change and variation to which a system is exposed, its sensitivity, and its adaptive capacity” (IPCC, 2001, 2007). Vulnerability is a function of exposure to a stressor, the effect of that stressor (also named or potential impact sensitivity) and recovery potential (termed adoptive capacity or resilience) (Adger, 2006; Lange, Sala, Vighi, & Faber, 2010; Dwyer, Zoppou, Nielsen, Day, & Roberts, 2004; Sonwa, Somorin, Jum, Bele, & Nkem, 2012; Turner et al., 2003). In short, vulnerability is exposure to unforeseen events, incidents and stress, and the difficulty of coping with them (Elmqvist et al., 2013). Analysis of vulnerability provide an effective approach to promoting corrective actions to reduce impacts from disasters by supporting coping strategies and facilitating adaptation (Kelly & Adger, 2000).
There are three processes related to vulnerability, namely the production and application of knowledge related to vulnerability, and the answering of questions related to interactions between the first two processes. These three processes exist due to multi-faceted and dynamic of vulnerability. The range of focal points differs dramatically among different disciplines, and the degree of interest influences both the production and application of knowledge related to vulnerability (Lee, 2014).
Due to the multiple dimensions and high levels of abstraction, definitions of vulnerability vary among different knowledge fields and disciplines (Cutter & Finch, 2008; Khan, 2012; Menoni et al., 2012). Vulnerability can be either physical (or biophysical) or socio-economic (Adger et al., 2004; Birkmann, 2006; Cutter, 1996; European Commission, 2011; Tate, Burton, Berry, Emrich, & Cutter, 2011). Physical vulnerability resembles that was devoted to the traditional impact method, which is based on natural science, and stresses the risk of exposure to risks associated with natural hazards (Adger et al., 2004; Cutter, 1996; Cutter et al., 2003). In contrast, social vulnerability denotes the state that exists before disasters (Finch, Emrich, & Cutter, 2010; Schmidtlein, Shafer, Berry, & Cutter, 2011), and includes social, economic, political and institutional components (European Commission, 2011). Therefore, the social vulnerability is the characteristics of social system and represents the wellbeing of residents. The more social vulnerability may increase the impacts of natural hazards on the society. Furthermore, while the hazards happened, residents may be inadequate to recover from their vulnerable state, and probably fall into worse conditions while facing coming hazards.
Therefore, considering social vulnerability as a planning tool and utilizing it to planning practices can motivate sustainable planning and human life. The sustainability of treating social vulnerability as a planning tool is important for responding to climate change, because of the difficulty of forecasting environmental trends. Social systems on various geographical scales must develop their own capacities to respond to extreme weather events. Only by doing so can the social capacity building become a real and long-term adaptation strategy. Social vulnerability thus can respond to environmental changes and disasters that impact social systems, and can remind government agencies, the private sector and residents to base developmental strategies on social conditions — particularly when facing with the development of highly vulnerable places.
Furthermore, the complexity of disasters means the content and application of social vulnerability needs to be a developing concept. Certain factors have been recognized as crucial determinants of the degree of a social system, such as personal property, age, density of buildings, single department economics, race, ethnicity, etc. However, few studies have attempted to conceptualize these factors or thoroughly examine the relationships between the main factors and the changes in those relationships.
Considering the regional characteristics of disasters, most studies have found it difficult to determine the weightings of measurement items. Consequently, most social vulnerability studies primarily measure social vulnerability without weighting (Cutter, 1996; Cutter et al., 2003; Mendes, 2009). Although measurement methods can provide an abstract picture of the vulnerability of a social system, such an approach cannot easily display details and other potential characteristics. Such measurements and the lack of historical data may neglect potential heterogeneity in terms of the role of human agency among social systems and the reflection of institutional mechanisms.
On the other hand, the origins of the term “social fragmentation” can be found in the work of Durkheim, who is widely considered the “father” of sociology (Emirbayer 2002; Syme 2000). Generally, social fragmentation was more significant than deprivation in explaining small area variations for mental rather than physical health outcomes (Ivory et al., 2011; Evans, Middleton, & Gunnell, 2004).
Social fragmentation appears to be the preferred term, and is generally defined as the inverse of social integration (Evans et al., 2004) or social cohesion (Cramm, Van Dijk, & Nieboer, 2013; Fagg et al., 2008). There is also little reference to the wider research on the processes of anomie or social fragmentation at a societal level, such as work on urbanization (Ivory et al., 2011) or changes in societal structure and anomie (Makinen, 2000).
Social fragmentation represents weak social solidarity and a lack of social support, whereby individuals who belong to a highly social fragmented society can hardly cope with the difficulties they face. Thus it can be assumed that to some extent, a system based on high social integration is better able to respond to disaster or recover from damage. The other crucial point is that social fragmentation, which denotes the degree of social integration of a social system, must result from long-term societal development. That is to say, local residents with more social fragmentation could be uneasy to recover from natural hazards. But the social integration, contrary to concept of social fragmentation, could be the important tools for local residents to adapt to natural hazards. Therefore, like two sides to one coin, this paper highlights the indicators of social fragmentation to catch the whole concept.
High divorce rate, high migration rate and percentage of people living alone can cause high social fragmentation. Therefore, divorce rate, migration rate and percentage of people living alone provide effective measurements of social fragmentation (Dorling & Gunnell, 2003). On the other hand, the consolidation of the feed, seed, processed grain, and livestock industries has decreased the number of small businesses in rural areas. This decrease has contributed to the decrease in demand for labor. Rural areas that once provided employment for all young adults willing to work in challenging conditions now offer only partial employment. The situation is exacerbated by the decrease in services such as schools, shops, and cultural opportunities that accompanies the population decline, and the rising age of the remaining population further stresses social services in rural areas (Carr & Kefalas, 2009; Elmqvist et al., 2013).
Moreover, the rapid growth of the elderly population worldwide, and increasing urbanization, will influence international trends in living arrangements, family structure, and the informal care-giving options available for older persons (Hokenstad & Roberts, 2010). Vulnerable socio-economic settlements, particularly slums, are likely to be especially affected by this double whammy of urbanization and climate change (D’Souza, 2011). Urbanization will result in poor infrastructure in rural areas, including in the areas of sanitation, treated water, and accessibility to health facilities, and thus will further induce migration from rural to urban areas (Elmqvist et al., 2013). Therefore, out-migration can be seen as a root cause of social fragmentation in rural areas.
Marriage and social support limit the negative impacts of chronic illness (Elliott, Charyton, Sprangers, Lu, & Moore, 2011). Furthermore, single and unpaired individuals are more responsive to psychological stress than married individuals, consistent with a growing body of evidence suggesting that marriage and social support protect against stress (Maestripieri, Baran, Sapienza, & Zingales, 2010).
Data and Method
Study site
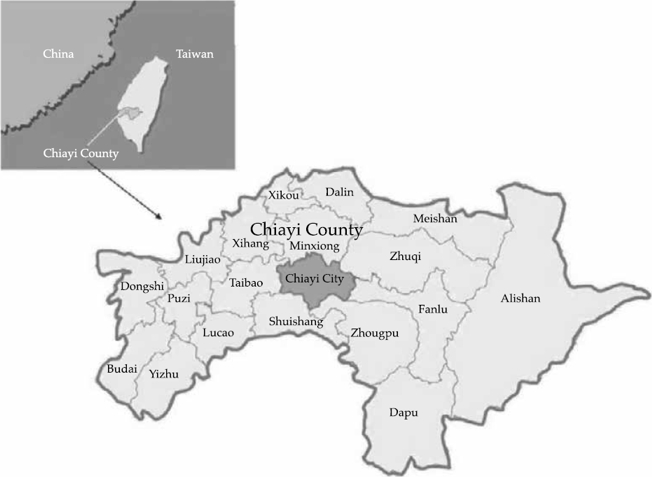
Chiayi County, one of the 22 municipalities and counties of Taiwan, is located on the west coast of the country. To the east of Chiayi County is Jade Mountain; to the west is the Taiwan Strait; to the south is Tainan County, and to the north is Yunlin County. Chiayi County has an area of 1,903 square kilometers, or 5.35% that of Taiwan. Chiayi County has 18 cities and townships (figure 1). Located in Central Southern Taiwan, Chiayi is easily accessible, particularly now the completion of the Taiwan High-Speed Rail has cut travel time to Taipei, the capital of Taiwan, to just one hour.
The population of Chiayi County was approximately 540 000 in 2013. The Tropic of Cancer runs through Chiayi, which has a different landscape to other places on the Tropic of Cancer, most of which are either dessert or semi-dessert while Taiwan is forested owing to the abundant rainfall brought by the trade wind and airstreams. Chiayi County has four notable geographic features: coastal, plains, hills and mountains.
Land subsidence and changes in the coastline are important issues in Taiwan (Chen, Wang, Hsu, Yu, & Kuo, 2010). Coastal land subsidence has continued unabated because most fish species raised in coastal fish farms require more than 80 percent fresh water, which is sourced underground. Chen and Kuo (2000) analyzed data from 1976 to 1996 and determined that sea-levels on the Chiayi coast rose approximately 1.92cm/year during that period, exceeding the global average. Ground subsidence has slowly decreased since the government implemented some control measures, and thus its contribution to rising sea-levels has also decreased. Although whether climate change is the cause of the rise in sea-level on the Chiayi coast cannot be determined, the existence of the phenomenon is undoubted. For example, the typhoon Mindulle attacked Taiwan in July, 2, 2004. Around 11,793 hectares of lands were flooded in Chiayi County. In June 12, 2005, the extremely torrential rain continued for several days, this area was serous flooded including 8,261 hectares of lands in Dongshi Township and 4,859 hectares of lands in Budai Township.
Variables and data resources
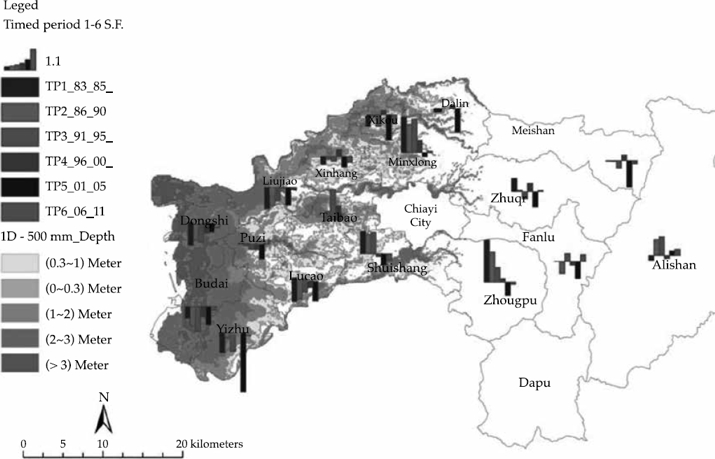
This study conducts two analyses. First, this study examines the historical trend of social fragmentation at the township level in Chiayi County by using longitudinal statistical data from 1983 to 2011. Second, this study performs overlay analyses of social fragmentation trends and flood maps. Using the map of social fragmentation trend as the base map, this study overlays a second layer, the flood map of Chiayi County, under the condition of rainfall exceeding 500 mm daily. According to the Central Weather Bureau of Ministry of Transportation and Communications in Taiwan, the extremely torrential rain means the accumulative rainfall up to the threshold of 500 mm daily or above. Thus, the rainfall threshold set to 500 mm daily. Through this strategy, this study examines the potential responsive capacity to major disasters at the township level.
This study suggests that high migration from rural areas manifests high social fragmentation. Accordingly, the rate of social increase is assumed to be negatively related with social fragmentation. On the other hand, marriage is considered to be a crucial factor that increases social integration in a social system (table 1).
Table 1 Variables and their relation to social fragmentation.

Note: (1) Dapu Township has recently had extremely high social migration rates. To avoid confounding the index framework, this study excluded data from Dapu; (2) social increase rate = (inmigration rate) - (out-migration rate); (3) the original data of the rate of social increase are absent for 1988 and 1995; (4) crude divorce rate = (registered divorces/population of mid-year)*1 000 (5) Crude marriage rate = (registered marriages/ population of mid-year)*1 000.
To summarize, this study uses the rate of social increase, crude divorce rate and crude marriage rate to measure social fragmentation. Longitudinal data for these three variables were collected from the Department of Accounting and Statistics of Chiayi County Government from 1983 to 2011. To assess the responsive capacity of a social system to natural hazards, this study uses flood maps from Taiwan’s Water Resources Agency for 2007 to 2011. The two data are transformed from long-term statistics to a stationary description of local characteristic. Thus, this study will not attempt to analyze the longitudinal statistical data year by year. Restated, the longitudinal statistical data are used for realizing the types of social fragmentation of social system, and the flood map data are used for mapping the spatial distribution of the natural hazards. By so doing, this study can examine different disaster exposure risks, trends in responsive capacities, and differences among townships.
Analysis Method
The analytical procedure comprises two steps. The first step is to analyze social fragmentation during 1983-2011. Meanwhile, the second step is to overlay the flood map on top of that of social fragmentation trends in Chiayi County by GIS.
To obtain meaningful comparisons among the three variables and integrate them into a social fragmentation index, this study subjects the variable to a standardization procedure whereby social fragmentation increases with decreasing social increase and marriage rate, and decreases with decreasing divorce rate. Therefore, before summing the standardized scores, this study reverses the direction of the standardized scores of divorce rate. Next, this study sums the standardized scores of variables and calculates the annual averages for each variable as an annual social fragmentation index. The longitudinal data is from 1983-2011. To clearly interpret the characteristics of social fragmentation, this study divides the 18-year period into six sub-periods, namely 1983-1985, 1986-1990, 19991-1995, 1996-2000, 2001-2005 and 2006-2011. This study sums the standardized scores and then averages them for each time period. Thus, due to the standardization procedure, the different longitudinal data could be utilized to explain the trend of social fragmentation in different periods. Furthermore, this study overlays the spatial distribution of flood maps and the six time period map of social fragmentation.
Results
According to the range of standardized scores of the rate of social increase from 1983 to 2011, Fanlu is the township with the highest inmigration, while Dongshi and Xikou are the townships with the highest out-migration. The townships that changed from out-migration to in-migration are Dalin, Lucao, Xinkang, Yizhu and Liujiao. Moreover, Zhuqi, Taibao and Minxiong show decreased in-migration. Finally, Puzi, Meishan, Zhongpu and Shuishang changed from in-migration to out-migration (tables 2 and 3).

Table 3 Characteristics of the rate of social increase from 1983 to 2011.

Note: Ranges of standardized scores are ranked sequentially from low to high.
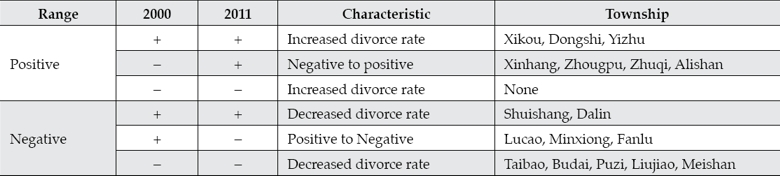
Tables 4 and 5 list the standardized scores of crude divorce rate, which are original and not subject to reverse adjustment. The different range of standardized scores of divorce rate from 2000 to 2011 shows that townships with increased divorce rates are, ranked from low to high, Xikou, Dongshi, Yizhu, Xinkang, Zhongpu, Zhuqi and Alishan. Specifically, Xinkang, Zhongpu, Zhuqi and Alishan transformed from negative to positive values. Meanwhile, the townships with decreased divorce rates are Taibao, Dalin, Budai, Shuishang, Puzi, Liujiao and Meishan. Lucao, Minxiong and Fanlu changed from positive to negative values. Based on the distribution of the range of standardized scores of marriage rate from 2000 to 2011, Table 6 shows that the townships with increased marriage rate were Fanlu, Meishan, Minxiong, Taibao, Shuishang, Budai, Zhuqi, Zhongpu, Puzi and Alishan. Meanwhile, the townships with decreased marriage rate were Lucao, Dalin, Xinkang, Dongshi, Xikou, Liujiao and Yizhu. Townships where marriage rate changed from decreasing to increasing are Minxiong, Taibao, Zhuqi, Puzi and Alishan. Finally, marriage rate changed from increasing to decreasing in Minxiong, Taibao, Zhuqi, Puzi and Alishan (Tables 6 and 7).


Tables 8 and 9 point out that townships with increased standardized social fragmentation scores include Alishan, Meishan, Zhuqi, Zhongpu, Shuishang and Minxiong. Meanwhile, townships with decreased standardized social fragmentation scores include Taibao, Xinkang, Dalin, Puzi, Yizhu, Budai, Xikou, Dongshi, Fanlu, Lucao and Liujiao. Only Lucao had its standardized score change from negative to positive, while only Meishan and Zhuqi had their scores change from positive to negative.


Based on the trend of social fragmentation from 1983 to 2011, this study overlaid the map of social fragmentation score with the flood map (figure 2), thus revealing four types of social fragmentation trend. Type one is characterized by social fragmentation scores that remain continually below the average for all townships. Such types can be represented as “continuous high social fragmentation,” which includes Dongshi, Budai, Yizhu, Lucao, Puzi, Liujiao and Xinkang. Type Two is characterized by social fragmentation scores that change from positive to negative, indicating increased social fragmentation. Type Two is labeled “transformed social fragmentation,” and includes Shuishang and Zhongpu. Type Three exhibits fluctuating social fragmentation, and includes Dalin, Meishan, Zhuqi, Fanlu and Alishan, and this type is termed “fluctuating social fragmentation.” Finally, Taibao is categorized as Type Four because of its higher social fragmentation score than the average of all townships. Type Four thus is named “continuous low social fragmentation”.
Discussions
The social fragmentation is an important factor of social vulnerability concept. Comparing to the concept which is a comprehensive measure, the social fragmentation may specifically reflect on the degree of social integration of social system. The less social fragmentation, or let’s say, the more social integration is a chance to overcome the natural hazards at local level. Thus, instead of social vulnerability, this paper highlights the relationship between social fragmentation and natural hazards.
In addition, the social fragmentation is able to reflect the local characteristics, but hard to manifest them onto spatial distribution. Thus, this paper will contribute to mapping the longitudinal indicators of social fragmentation on the spatial distribution. The efforts help to illustrate the local characteristics of social structure in the map and to explain how flood map interact with the trends of social fragmentation as well. This paper identifies four types of social fragmentation, including “continuous high social fragmentation,” “transformed social fragmentation,” “fluctuating social fragmentation” and “continuous low social fragmentation.”
This study adopts migration and marriage as indicators of social fragmentation, because the decision of migration and marriage are usually based on the household units. Thus, the migration and marriage indicators are able to represent local characteristics in the household. Another social system is a community basis. Communities represent local characteristics among the households. Although this study cannot capture them owing to data availability, however, the other indicator including neighborhood, organizational mobilization, social network, trust, etc. will be suitable for the chosen factors of social fragmentation for future studies.
Conclusions
Individuals and institutions should move from “crisis fighters” to “proactive and systematic risk managers” (World Bank, 2013). After all, understanding more about the changes of human society can help mitigate and adapt to future disasters. This study identifies four types of social fragmentation that include “continuous high social fragmentation,” “transformed social fragmentation,” “fluctuating social fragmentation” and “continuous low social fragmentation.” Of the four types, “continuous high social fragmentation” is located in coastal Chiayi. Meanwhile, “transformed social fragmentation” is clustered in the plain area. “Fluctuated social fragmentation” occurs in the hill-mountain area. Finally, “continuous low social fragmentation” occurs only in Taibao City, because it is the county capital and located in the core of the county.
Clearly studies may overlook such potential social fragmentation if the longitudinal trend analysis is missing. Restated, trend analysis is required to clarify different characteristics of social fragmentation. Analysis of changing trends based on the longitudinal data as well as the loss maps of flood disasters thus can avoid the limitations of the event-based perspective on discussing disaster, and can also provide historical and local contexts for further insights into human agency and the institutional mechanism of natural hazards.
Unlike the traditional social vulnerability approach of using indicator measurements, this study suggests that social fragmentation is related to social integration in terms of social systems. The social fragmentation approach thus can help adjust the shortage of indicator measurements.
Some interesting follow-up analysis can be performed to identify more appropriate variables that can be used to calculate social fragmentation, and that can help identify the relationships between social fragmentation and social vulnerability, the two factors that determine differences in resilience and adaptation between cities, counties and countries. Furthermore, analysis of social fragmentation and physical vulnerability dynamics by land type category can help to assess the specificity of each profile and confirm the study classification.

