


 nueva página del texto (beta)
 Inglés (pdf)
 Artículo en XML
 Referencias del artículo
 Enviar artículo por email
 Citado por SciELO
  Similares en
SciELO
Similares en
SciELO 
 Permalink
Introduction
The surface water cycle in the continental interior is more seriously influenced by snow accumulation and ablation processes in the 40° latitude than most global land areas (Adam & Hamlet, 2009). Xinjiang is located in the northwestern part of China. The hydrological distribution and extreme climate condition in the mid-interior of Eurasia complícate the snowmelt processes. The Tian Shan Mountains belt is a hot research area in the field of global hydrological system and climate change (He & Meng, 2014; Meng & Yu, 2015). Specifically, Xinjiang is located deep inland, far from oceans and surrounded by high mountains. It is there-fore difficult to attract marine currents and has a distinct continental climate temperature. Huge air temperature difference, adequate sunshine duration (i.e., annual sunshine duration reaches 2500-3500 h), small precipitation, and dry weather are observed in this area. Xinjiang has an annual average precipitation of about 150 mm. However, a great difference in precipitation exists across different regions. South Xinjiang also has higher air temperature and lower precipitation than north Xinjiang. Yang and Wei (2003) studied the temperature and humidity changes in Xinjiang, as well as corresponding space-time distribution characteristics, based on climatic data of nearly 40 years (i.e., 1961 to 2000). They found a clear warming and humidifying trend in the past four decades. The average temperatures in the 1990s in south Xinjiang, north Xinjiang, and Tian Shan moun-tainous area are 0.6, 0.4, and 0.6 °C, respectively, than the average temperature in other years. Climate warming (mainly in winter) in north Xinjiang is more intensive than in south Xinjiang. The annual average precipitation increases by 11.4%, 25.2%, and 6.9% in north Xinjiang, south Xinjiang, and Tian Shan mountainous area, respectively. Most precipitation occurs in winter and summer, and a few in autumn. An urgent evaluation of the snowmelt processes in Xinjiang under regional climate changes is needed because of prominent climate changes.
A recent research showed that glaciers are gravely influenced by small-scale fluctuation in the natural climate. The said research indi-cates that a warming climate can influence the hydrological regimes of glacier and snow-melt driven watersheds (Barnett & Adam, 2005; Immerzeel & Van, 2010; Schaefer & Denton, 2006). Qing, Ji, Chang and He (2004) indicated that the global average temperature will increase by 1.1-6.4 °C in the 21st century. The effect of global climate change on the hydrological system and the change in mountain snow and glacier melt can express the timing and amount of runoff in mountainous watersheds. Both the water resource redistribution and the global hydrological system are affected by global climate change. Conducting research on the hydrological and climate changes of high mountain regions is important because of the sensitive hydrological process in circumpolar latitude and high altitude localities. Global climate change has led to ice and snow melt in recent years. This phenomenon has caused many spring floods. Flood from the northern slope of the Tian Shan Mountains has caused many problems, such as the destruction of properties, cessation of traffic, human casual-ties, water pipes,etc (Su & Guo, 2003; Ebrahim & Hamidreza, 2015). The mountain-front stream discharge has increased by 10% in the last ten years (Chen, Pang, Hao, Xu, & Chen, 2008; Shi & Zhang, 1995). The decreased water resource use efficiency and water shortage restrict the development of agriculture and industry in Xinjiang. Thus, research on the snowmelt runoff from the northern slope of the Tian Shan Mountains, accurate simulation of the stream flow, and comprehensive forecasting are necessary to help the government manage water resources and reasonably develop them (Liangge & Jie, 2013; Abudu, Cui, King, & Abudukadeer, 2010). These methods can also minimize the disaster risk caused by rapid spring snow and glacier melt and provide a research basis for the fore-cast of water resource availability. However, no clear research exists on the impact of climate change on water resource areas in China (Piao et al, 2010; Yao & Qing, 2014).
Many researchers use models, such as Şorman (Şorman, Şensoy, Tekeli, Şorman, & Akyürek, 2009; Garcia, Martin, & Castro, 2015; He & He, 2015), to simulate daily stream flows and adapt hydrologic conditions in glacier- and snow-fed catchments (Şorman et al., 2009; Dragan & Nauparac, 2015). These simulations are complicated and data intensive. Generally, varied hydrologic conditions can be processed using only a few snowmelt models (Tekeli, Akyürek, Şorman, Şensoy, & Şorman, 2005). Some researchers use a new method of simulating daily discharges. They study the impact of climate change on these discharges in a research area, which is integrated between remote-sensing snow cover products and MIKE-SHE, a snowmelt runoff model (SRM). Various agencies, institutes, and universities use the SRM in more than 100 basins at various eleva-tions. However, research conducted using Soil and Water Assessment Tools (SWAT) to simulate the watershed hydrological cycle under differ-ent climate changes is rare. SWAT model has been most widely used in simulation and fore-casts. Furthermore, the SWAT model does not require data from snow-covered areas. Arnold and Williams (1995) developed SWAT model for the United States Department of Agriculture and Agricultural Research Service, This tool is used to predict the effect of water, sediment, and fertilizer in large-scale watersheds on water and land resource management (Bingner, 1996; Chow & Maidment, 1998; Chu & Shirmoham-madi, 2004; Gitau & Gburek, 2012; Rosenthal & Srinivasan, 1995; Sophocleous et al., 1999; Spruill & Workman, 2000; Weber & Nicola, 2001; Akinro & Olufayo, 2012; Jie & Zheng, 2014).
The present study selects the Juntanghu watershed as its study area. This watershed is located in the northern slope of the Tian Shan Mountains in Xinjiang, China. The data source consists of the annual mean temperature and precipitation annual average data of ten weather stations in the northern slope of the Tian Shan Mountains The data can be used to simulate the relationship among snowpack, meteorology, and runoff. The SWAT model is also used as a framework to discuss the changes in the snowmelt runoff under different climate scenarios.
Materials and Methods
Regional setting
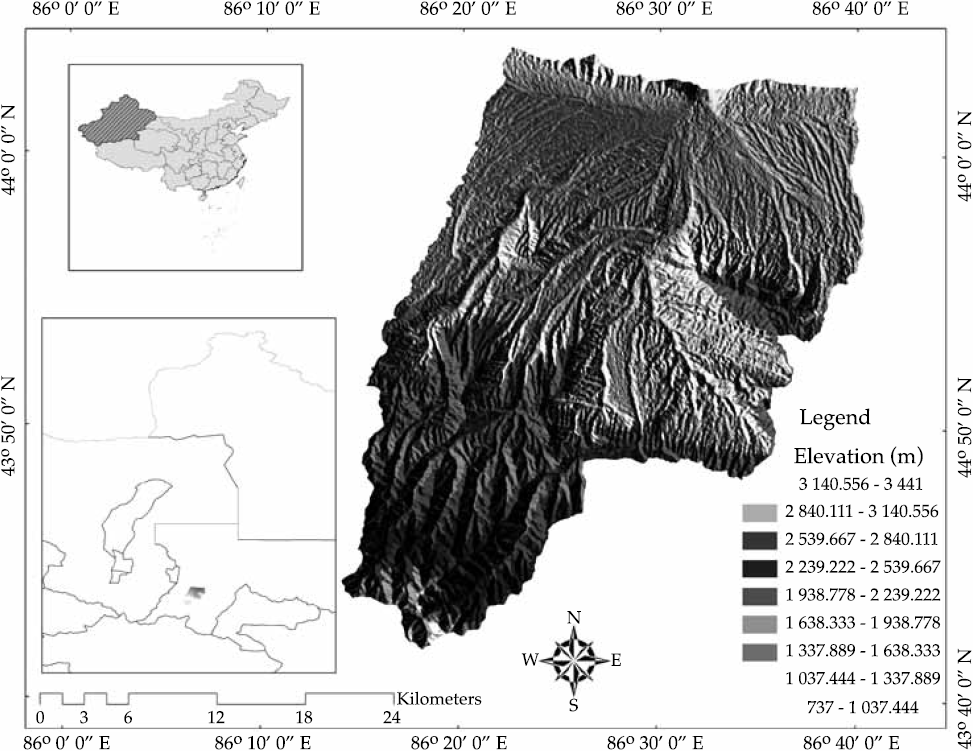
The Juntanghu River basin was chosen as the study area. The distance from the source of the Juntanghu River to the Hongshan reservoir was 60 km. The Hongshan reservoir catchment area was about 861 km2, and the total watershed área was 1218 km2 (Figure 1). The average elevation of the basin was 1503 m, and the mean annual runoff was 3273 x 104 m3. The snow cover in the Tian Shan Mountains accounted for 55% of the total area in winter and about 5% in sum-mer (Dou, Chen, Bao, & Li, 2010). The snow melt runoff produced about 40.3% of the total stream of the river in Xinjiang. However, the contribution of snowmelt to the runoff varied with the interactions between climatic and en-vironmental factors (Li & Simonovic, 2002). The snow cover started to emerge at mid-September, and the peak of the snow cover would last until January of the next year. The thickness of the snow pack could reach from 20 cm to 30 cm. Temperature was identified as a critical factor that could influence the hydrological process in the Juntanghu watershed because of its contributions to snowmelt, surface soil frost, thaw, and evaporation (Anderson, 1973; Li & Simonovic, 2002; Tanasienko & Chumbaev, 2008). Snow melt occurs when the air tempera-ture rises again in February and can reach its maximum proportion in March. The occurrence of snowmelt flood in this area has become more frequent in recent years, and it is imperative to better understand the snowmelt process for better agriculture practices and flood control.
Data
The input data in this study was derived from various sources (Table 1). The data on the daily stream (form 2000 to 2010) were obtained from the Hongshan reservoir, Hutubi county, Xinjiang, China. The monthly precipitation and temperature data (form 1961 to 2009) of three stations (i.e., Manas, Hutubi, and Xiaoquzi) in the Tian Shan Mountains were taken from the Xinjiang Bureau of Meteorology. These monthly data were used to conduct the Mann-Kendall (M-K) monotonic trend test. The 11-year daily meteorological data of the Hutubi station (form 2000 to 2010), which included the average air pressure, average wind speed, average temperature, daily maximum temperature, daily minimum temperature, average relative humidity, 20-20 h precipitation, evaporation, average solar radiation, and average wind speed, were used to conduct the SWAT model simulation. All the data, including soil, land use, topography, weather (XPR, YPY), and stream data were formatted as the same project (WGS_1984_UTM_Zone_45N). The resolution for the land use and soil raster file was 1 arc second (30 m * 30 m).
Table 1 Source of input data for research area (Northern mid-slope of Tian Shan mountains, Juntanghu watershed).
| Data | Sources |
|---|---|
| Soil | http://webarchive.iiasa.ac.at/Research/LUC/External-World-soil-database/HTML/ (FAO-1:1,000,000) |
| Land use | http://westdc.westgis.ac.cn/data/f1aaacad-9f42-474e-8aa4-d37f37d6482f (WESTDC--1:10,0000) |
| Topography | http://asterweb.jpl.nasa.gov/gdem.asp (DEM-30m) |
| Weather data | http://www.climate.xj.cn/gx/dsQuery.do?id=5&pid=-1 (Temperature,solar radiatio -n,pricipitation,wind,etc.) |
| Stream data | Hongshan Reservior (Daily stream data at hongshan guage station) |
Methods
Climate change analysis using the M-K test
This research used the M-K monotonic trend test (Yue & Pilon, 2002) to identify the climate changes in the Juntanghu River basin. This test was mainly used to analyze the trend of the mean annual temperature (MAT) and precipitation in the northern slope of the middle Tian Shan Mountains. Hipel and McLeod (1994, 1991) used the M-K trend test in all kinds of circumstance data analysis. The M-K trend test has been well developed because of its many advantages (Hamed & Rao, 1998; Yue & Pilon, 2002).
Normalized variable statistics UF and UB
Given stream frequency variables, x1, x2,..., xn, ni is the accumulation of samples for which xi > x. (1 ≤ j ≤ i). The equation for the statistical parameter d k is expressed as follows (Zhang et al, 2014):
 1
1
 2
2
where the normalized variable statistic dk is denoted as follows:
 3
3
The calculation for the backward sequence UB uses a series of data F' = f1', f2',.f3', ..., fn') = (fn, fn - 1, fn - 2, f1). UB(k) can be calculated as follows:
 4
4
SWAT model
This research used the SWAT model to predict the relationship between snowmelt flood and climate change in high cold mountains. SWAT can simulate a number of different physical processes in a watershed. A watershed needs to be partitioned into many sub-watersheds or sub-basins for modeling purposes in SWAT, because the sub-areas within a watershed are dominated by different land uses or the properties of soils are sufficiently dissimilar to impact the hydrology of areas. Dividing a watershed into many sub-basins makes it easy for users to spatially reference different watershed areas to one another. Watershed delineation in the SWAT model is generated from a given digital elevation model to a number of sub-basins. The input information for each sub-basin can be classified into different categories, including climate, hydrologic response units (HRUs), ponds/wetlands, groundwater, and the main channel/reach draining the sub-basin (Neitsch, Arnold, Kiniry, & Williams, 2009). The HRUs within each sub-basin consist of similar land use and soil distribution. These units are the basic modeling units. Physical characteristics, such as slope, reach dimensions, and meteorologi-cal data, are considered for each sub-basin (Di Luzio & Srinivasan, 2004). The meteorological data from the station nearest to the centroid of each sub-basin are used in SWAT (Abbaspour et al., 2007). In each HRU of the sub-basin, the processes of evapotranspiration, infiltration, surface flow, percolation, underground flow, sediment erosion, and crop growth are simulated. The nutrient and sediment fluxes from each HRU are accumulated and routed to the main outlet of each sub-basin. The discharge and sediment fluxes are routed within the stream network from one sub-basin to another and finally to the outlet of the watershed. Channel routing is calculated using either the variable storage routing method (Arnold & Williams, 1995) or the Muskingum River routing method.
In SWAT, Water balance is the key and driving force behind everything that occurs in the watershed regardless of the problems be-ing studied. The hydrological cycle process is expressed as follows:
 5
5
where SWt and SW0 are the final and initial soil water (mm), respectively; t is the simulation time (days); Rday is the quantity of precipitation on simulation dayi (mm); Qsu is the quantity of the surface runoff on simulation dayi (mm); E a is the evapotranspiration on dayi (mm); ws is the water quantity entering the vadose zone in the soil on simulation dayi (mm), and Qgw is the quantity of the return flow on dayi (mm).
The second division is the water routing phase of the hydrological cycle, defined as the movement of water, sediment, nutrients, and or-ganic chemicals through the channel network of the watershed to the outlet (Neitsch et al., 2009).
The snowmelt module in the SWAT model is based on equations similar to the sine formula (Neitsch et al., 2009). This module assumes two boundaries of the snowmelt rate: maximum (assumed to occur on June 21st) and minimum (assumed to occur on December 21st), which fol-low the trend of the sine formula. The SNOmlt value can be calculated as follows:
 6
6
where SNOmlt is the volume of the snowmelt on simulation days (mm H2O); Bmlt is the snowmelt factor on simulation days (mm H2O/day-°C); SNO cov is the snowmelt fraction covered by snow; T snow is the snowpack temperature on the simulation days (°C); Tmx is the maximum air temperature (°C), and Tmlt is the snow melt temperature threshold value (°C).
The snowpack temperature in the SWAT module can be considered the function of the average temperature of the previous day and is changed by temperature according to the Damping form. The snowpack temperature in the previous day affects the current snowpack temperature, which is controlled by the delay factor Lsno. This factor considers the snowpack depth, density, and exposure degree, which can influence the snowpack temperature. The snowpack temperature is calculated as follows:
 7
7
where Tsnow(dn). is the snowpack temperature on simulation days (°C); Tsonw(dn-1) is the snowpack temperature of the previous day; δsnow is the delay factor of the snowpack, and
 8
8
where bmlt is the snowmelt factor (mm H2O/day-°C), bmax is the snowmelt factor on June 21, bmin is the snowmelt factor on December 21, and n is the number of the simulation days in one year.
Model setup
In this study, the Juntanghu watershed was divided into 33 sub-basins, and HRUs were used for land division. Land utilization, soil, and slope classification were set to 0% in SWAT to retain all HRUs and refine the SWAT model. A total of 144 HRUs were finally acquired. In the SWAT model, the potential evapotranspiration was calculated based on the Penman-Monteith method. Given that all the input data were daily data, the surface runoff was calculated using the soil conservation service (SCS) curve. The SCS curve was a non-linear function between the precipitation and initial losses. The surface runoff in every HRU was calculated, and it converged in the main channel of the river basin. The water evolution in the main channel was finally calculated using the channel storage method based on the equation of continuity. The N value of Manning was set for the channel flow. The channel flow condition was set to Manning's default N of natural streams (0.025).
The SWAT model was calibrated and vali-dated based on the observed inflow series at the Hongshan Reservior station. The data from 1995 to 2000 were used to warm up the model. The data from 2000 to 2004 and 2006 to 2010 were used for calibration and validation, respectively.
Results
Climate change feature analysis using the M-K trend test
The M-K trend test and wavelet analysis were applied on the 50-year data (from 1961 to 2011) of ten weather stations in the study region. Figure 2 shows a significant increasing in the MAT trend in the northern slope of the middle Tian Shan mountains during 1961-2011 (P < 0.001). The M-K statistical test showed a rate of 0.40 °C/decade. The step change points also occurred in 1995 (P < 0.01). The rising rate in the northern slope of the middle Tian Shan mountains was consistent with the temperature of northwestern China, with values of 0.34 °C/ decade (Li & Chen, 2012). Furthermore, the rising rate was also much higher than the average increasing rate of the global temperature (0.13 °C/decade) (Brohan, Kennedy, Harris, Tett, & Jones, 2006; Solomon, 2007) and that of China (0.25 °C/decade) (Ren et al., 2005). The Mountains had the lowest rate (i.e., 0.21 °C/ decade) among all the oasis landscapes and mountains. The oasis had the highest increasing rate (i.e., 0.42 °C/decade). The landcovers, including the glacier, snow, various vegetations, and ecosystem, had an important role as buffer under global climate change (Li & Chen, 2012). The lowest increasing rate for all the seasons was in spring, whereas the highest was in summer. The coefficient of variation (Cv) was selected to measure the variation statistics of the observed value and variation degree of the variable (i.e., precipitation and temperature) in the time series. The temperature had moderate variability in the northern mid-slope of the Tian Shan Mountains, and the Cv value was 0.168. The Cv of the temperature in each season ranged from 0.073 to 0.246 and indicated moderate variability. The Cv of the temperature reached its highest value in autumn, which also indicated moderate variability. The lowest value was observed in summer, which could be considered to have weak variability (Figure 2).

Figure 2 Variation M-K test in MAT from 1961 to 2009 in the northern mid-slope of the Tian Shan Mountains.
The increasing precipitation rate in the northern mid-slope of the Tian Shan Mountains during the past 50 years was 15.38 mm/decade. This rate indicated the step change points in 1991 (P < 0.05). The increasing rates of precipitation on the mountains were the fast-est with a rising rate of 21.10 mm/decade. The slowest rate was observed in the oasis area with a value of only 12.17 mm/decade. The rising rate was at its highest in winter and lowest in autumn. The precipitation in the northern mid-slope of the Tian Shan Mountains had moderate variability (i.e., the Cv was 0.178). The Cv of the precipitation in each season was low (i.e., ranging from 0.221 to 0.443), which indicated moderate variability. The Cv of the precipitation was the lowest in summer and the highest in winter (Figure 3). The climate change analyzed via the M-K trend test showed a significantly increasing trend in terms of MAT and the precipitation in the northern slope of the middle Tian Shan mountains from 1961 to 2011. These two factors (i.e., precipitation and tempereature) could influence the snowmelt process. Climate change scenarios were then established based on both factors.

Simulation of climate changes using the SWAT model
Figure 4 shows the calibration period from 2000 to 2004. The NS efficiency coefficient for the SWAT model was 0.85. The correlation coefficient R2 was 0.92. The NS efficiency coefficient of the original SWAT model in the validation period from 2006 to 2010 was 0.81, while the correlation coefficient R2 was 0.83. Figure 5 shows the simulation results in the Juntanghu watershed (from 2 000.2.1 to 2 000.12.31). The NS efficiency over the annual simulation period was greater than 0.81.

Figure 4 Measured (observed) and simulated runoff during the calibration (from 2000 to 2004) and validation periods (from 2006 to 2010) using the SWAT and SWAT-JTH models at the Juntanghu watershed, Xinjiang, China.

Figure 5 Measured and simulated runoff during the calibration period using the SWAT model at the Juntanghu watershed, Xinjiang, China. The x-axis shows continuous days throughout year 2000.
The SWAT model was a good choice to simulate the discharges in the glacier- and snow-fed Juntanghu River basin. Figure 5 shows that the surface runoff in winter was rarer than that in the spring snowmelt stage (from February 20 to April 20, 2000). This change could have been caused by the increasing temperature, which would increase not only the volume of the spring snowmelt runoff but also the volumen of the summer stream flow in the region. The snowmelt water would significantly influence the hydrological surface in the spring snowmelt stage. This influence would influence the im-portant core of the regulation in the Juntanghu River basin.
The SWAT model was selected to study the impact of climate variability on the Juntanghu River runoff after calibration and validation (from 2000 to 2010). Different future climate scenarios for precipitation and mean temperature were used to estimate the relative stream flow in the future for water resource management. The scenarios are described as follows:
(a) An increase in mean temperature
This scenario was used to validate the contribu-tion of changes in the temperature to snowmelt runoff. The annual average temperature of the research area has always exhibited a rising trend after 1996, as shown in Figure 2. Thus, the temperature in the simulation day was manually increased (i.e., temperature +1 °C and temperature +3 °C), and the other parameters were kept constant. The SWAT 2009 model was used to simulate the changes in the condition of the snowmelt runoff.
(b) An increase in precipitation
Given the uncertainly of precipitation, the set-ting of this factor differed from that of tempera-ture (i.e., precipitation +10% and precipitation -10%).
Influence of temperature variability on the Juntanghu River runoff
The average temperature (i.e., +1 °C and + 3 °C) of the Juntanghu catchment was manually increased. The other physical variables were kept constant. The snowmelt runoff was simulated using SWAT. The mean temperature of the Juntanghu catchment was assumed to increase up to 1 °C and 3 °C. The other variables, particularly precipitation, were kept constant. Figure 6 shows the daily discharges of the Juntanghu River simulated under these scenarios. Accordingly, a 1 °C rise in temperature resulted in an increase of 7.78 m3/s, which was greater than 3.62 m3/s. This result was derived using T simulation on day 27 of February. In addition, the snowmelt phenomenon seemed to occur earlier on the 34th day and reached its flood peak (17.37 m3/s) on the 38th day. The value increased by 4.27 m3/s compared to the result simulated with T. When compared with the runoff (4.27 m3/s) simulated with T, a 3 °C rise in temperature would force the mean discharge to increase earlier by nearly 7 days (i.e., from 25th to 18th), and reach its flood level (12.393 m3/s). The snowmelt phenomenon was unno-ticeable earlier on the 33th day at a 3 °C rise in temperature. This result indicated the relatively small influence of temperature variability on the Juntanghu River runoff, except for the snowmelt period. The peak value and the runoff hydro-graph significantly changed during the spring snowmelt period when compared with those in the the other stages in a year. The earlier starting date of the snowmelt runoff correspondingly occured when the temperature was raised. The runoff greatly changed when the temperature substantially changed. However, these results may only be specific to this particular local area because the watershed response to the climate warning (i.e., rise in temperature) may not be the same in other watersheds. Null and Viers (2010), and Young (2009) explained that the river runoff decreases with increasing temperature scenarios.

Influence of precipitation variability on the Juntanghu River runoff
The precipitation of the Juntanghu catchment was assumed to change (i.e., P + 10% and P - 10%), and the other parameters were kept constant (Figure 7). The snowmelt runoff during the preliminary to interim stages had less influence in relation to changes in precipitation. The simulation values were underestimated by 1.02 m3/s (i.e., observed data of 1.05 m3/s vs. simulation value of 0.98 m3/s) under P + 10% conditions. The rise in the precipitation on the 26th also slightly increased the runoff. The precipitation influenced only the snowmelt in the later snowmelt period. Above all, the snowmelt runoff in the Juntanghu watershed seemed to be more sensitive to temperature. The Juntanghu River runoff was greatly influenced by the snow and glacier cover melt caused by the change in temperature, instead of the catchment precipitation. This conclusion is also been confirmed by Archer (2003). The M-K test showed that the mean annual precipitation and the temperature (from 1961 to 2009) in the northern mid-slope of the Tian Shan Mountains had a rising trend. Thus, the research area selected in this study was predicted to receive an increasing amount of precipitation in the future without significant increase in the mean temperature. This may be because of an extended snow cover area. This area will produce a large amount of runoff on melting if the mean temperature increases too rapidly in the future.

Conclusions
This research concludes that the SWAT model based on a degree day factor can efficiently simulate the glacier- and snow-fed watershed in the northern slope of the Tian Shan Mountains in Xinjiang, China. The M-K trend test analysis is selected to analyze the ten-year data (from 1986 to 2011) of the annual average precipitation and temperature of ten weather stations in the northern slope of the Tian Shan mountains. The annual average temperature and precipitation have obviously increased in the past ten years. The SWAT model is also used to analyze the most sensitive parameter related to snowmelt runoff. The analysis of the impact of climate change indicates that the research area's hydrological system alters under different climate change scenarios. The increasing temperature not only increases the volume of stream flow but can also trigger an early occurrence of the snowmelt period. This study shows that a change in temperature greatly affects all the hydrological elements in the Juntanghu River basin. Moreover, the results produced from the Juntanghu watershed can be extended to all the areas in the northern mid-slope of the Tian Shan Mountains in Northwest China. The avail-ability of the snowmelt runoff changes accord-ingly with the rise in the average temperature in spring. The research analysis also indicates that new or present reservoirs (e.g., Hongshan reservoir) are needed for large flow storage to meet the increasing needs for flood control and water supply. This study conducts climate scenario analysis using the SWAT model to provide useful information in managing the water cycle and meeting the country's future needs.

