


 text new page (beta)
 English (pdf)
 Article in xml format
 Article references
 Send this article by e-mail
 Cited by SciELO
  Similars in
SciELO
Similars in
SciELO 
 Permalink
Introduction
Globally the water demand to produce food, supply industries and sustain urban and rural populations increases continuously since many years. Moreover an increasing number of regions in the world face freshwater scarcity (Hoekstra, Mekonnen, Chapagain, Mathews, & Richter, 2012).
Agriculture uses about is responsible for 86% of the world's freshwater use in the world. One of the main challenges of planetary sustainability is to achieve a balance between the increasing demand of water for food production and its social and environmental impacts (Chapagain & Orr, 2009).
Also in Cuba agriculture is the main water consumer with 55% of the total fresh water withdrawals, 63% from surface water and 47% from ground water (ONEI, 2013a). The planning of water use is focussed is on satisfying the water demand, merely by increasing the supply.
The Water Footprint (WF) is a comprehensive indicator of water use: "the water footprint is an indicator of freshwater use that looks not only at direct water use of a consumer or producer, but also at the indirect water use". (Hoekstra, Chapagain, Aldaya, & Mekonnen, 2011). WF assessments have been used finding solutions and contributing to a better management of water resources (Aldaya & Hoekstra, 2010).
Using indicators as the WF in Cuba contributes to the evaluation and analysis of the water supply in the country (Garcia & Cantero, 2008). The importance of using indicators for Latin American countries was pointed out by Vazquez and Buenfil (2012).
Potato accounts for about 10 percent of the Cuban production of tubers and roots it is the only fully irrigated crop during the dry season. Potatoes are grown in particular and limited areas, which facilitates the calculation of their WF.
This study aims calculating the green, blue and grey WF of the potato production in Cuba and its comparison with other crops in Cuba and with WF of the potatoes farmed in other Caribbean and Latin-Americans countries in order to identifying its environmental significance for the country.
Materials and Methods
Water Footprint
The WF provides a framework to analyse the link between human consumption and the appropriation of the freshwater. It consists of three components: (Mekonnen & Hoekstra, 2010) Blue water: the volume of surface and groundwater consumed as a result of the production of a good or service. Green water: the volume of water evaporated from the global green water resources (rainwater stored in the soil as soil moisture). Grey water: the volume of freshwater required to assimilate the load of pollutants based on ambient water quality standards.
Mekonnen and Hoekstra (2011) ranked countries according to their WF during the period 1996-2005. Industrialized countries have a WF per capita ranging between 1 250 and 3 550 m3/ year. The United Kingdom shows the lowest WF with 1 255 m3/year, while the United States of America are the biggest water consumers with a calculated WF of 2 842 m3 /year. The WF of developing countries varies widely: from 550 to 3 500 m3/year per capita. The Democratic Republic of Congo with 552 m3/year shows the lowest WF, while Bolivia with 3 500 m3/ year shows the highest value. The Cuban WF is estimated at 1 687 m3/year per capita. Consequently Cuba ranks as number 36 among 208 countries studied. The Cuban WF is 21% above the global average which is surprisingly high. Among the 19 Latin American countries, Cuba ranks seventh (Vázquez & Buenfil, 2012).
The main component of the Cuban WF is the agricultural production which accounts for 1 519 m3/year, 90% of the total, 85% of this account (1 305 m3/year) is internal and result from Cuban resources. The components of the agricultural internal WF include: 1 189 m3/ year of green (91%), 74.9 and 41.4 m3/year per capita blue and grey respectively (Mekonnen & Hoekstra, 2011a and 2011b).
García and Cantero (2008), and Gonzalez (2012) link the high WF in Cuba with: 60% of the water is for irrigation, inefficient technology for irrigation, inadequate irrigation planning, climatic factors of the tropics: plenty precipitation and high evaporation, and evapotranspiration and limited crop yield.
Water Footprint of Crops
The WF of a crop is the sum of the green, blue and grey amounts of water used for its production. Applied to potatoes in Cuba the following calculation is used (Hoekstra et al., 2011).
 1
1
Where: WF is the total water footprint of the potato crop (m3/t). WFB is the blue WF of the potato crop (m3/t) and WFG is the green WF of the potato crop (m3/t). WFGr is the grey WF of the potato crop (m3/t).
The blue and a green WF values are calculated by:
 2
2
 3
3
Where: CWUB is the blue water used (m3/ ha). CWUG is the green water used (m3/ha). Yp is the yield of potatoes (t/ha).
The green and blue water used growing potatoes is calculated by integrating the daily evapotranspiration (ET, mm/day) over the growth period:
 4
4
 5
5
Where: ETB is blue daily evapotranspiration (mm/day); ETG is green daily evapotranspiration (mm/day); lgp-length of growth period (days).
To convert water depth in millimetres into water volume per unit of land (m3/ha) a factor 10 is used. Evapotranspiration is estimated using the CROPWAT model (Allen, Pereira, Raes, & Smith, 1998) which provides two ways: crop water requirement (CWR), assuming optimal conditions and the irrigation schedule (IS), including the possibility to specify actual irrigation supply in time (Hoekstra et al., 2011). CWR is less accurate and simpler than the IS and it is more often used (Chapagain & Hoekstra, 2011).
The "optimal conditions" require that crop evapotranspiration (ETC) equals CWR, that the harvest is disease-free, that crops are properly fertilized, and grown under optimal soil and water conditions, and achieving a maximal production (Allen et al., 1998), maximal yield and the lowest value of the WFG. Calculating the CWR only needs climate and crop data.
The evapotranspiration is calculated as:
 6
6
Where: Kc is the crop coefficient, which incorporates crop characteristics and averaged effects of evaporation from the soil. ETO is evapotranspiration from a hypothetical grass reference grown under conditions of sufficient water availability (mm/day).
ETC is estimated with a ten day interval and over the total growing season, using the effective rainfall (Hoekstra et al., 2011).
The irrigation requirement (IR) of the crop is the difference between CWR and the effective rainfall (P eff). The IR is zero if P eff is exceeds the CWR; otherwise is the difference between CWR and Peff is used:
 7
7
In case the CWR is fully met by rainfall (IR = 0) then its value equals the ETC. Therefore ETG will be equal to the minimum value of ETC, and Peff and ETB will be equal to zero:
 8
8
 9
9
In case the CWR is not fully met by rainfall (IR > 0), ETB is the difference between CWR and Peff.
 10
10
Peff is calculated using the method recommended by Hoekstra et al. (2011):
 11
11
 12
12
Where: Pt is monthly accumulated rainfall (mm).
The Kc considers the evaporation from the soil and the major factors affecting it are: crop variety, climate and the growth stage. Due to differences in evaporation during the growth stages, Kc for a given crop varies during the production period (Chapagain & Orr, 2009). The trends in Kc during the growth period are shown in the crop coefficient curve: the initial stage (Kc ini = 0.5), the mid-season stage (Kc mid = 1.15) and the end of the potato growth (Kc end = 0.75).
The Food Agriculture Organization (FAO) defined the duration of these periods (days) for a series of crops (Allen et al., 1998). For potatoes are: Initial stage (Lini = 25 days), stage of develop (Ldev = 30 days), middle stage (Lmid = 30 to 45 days) and final stage (Lend = 30 days). This provides a total growth period of 115 to 130 days. A regular period to grow potatoes in Cuba is around 100 days, and the stages coincide respectively with: Lini = 20, Ldev = 25, Lmid = 30 and Lend = 25 (González, 2012).
The Kc curve for potatoes harvested in Cuba is compared with the FAO data in Figure 1, the period of the potato crop cycle in Cuba is shorter than that the FAO reported and Kc values are different in the development and final. Table 1 are shown the Kc values for potatoes crop in Cuba.

Table 1 Crop coefficient (Kc) values for potatoes harvested in Cuba. Source of data: own production.

The reference crop evapotranspiration (ETO) values are taken from Mendez, Solano, and Ponce (2012). In Cuba the annual ETO shows a normal distribution, which is common in tropical and subtropical areas. ETO behaves as in subarid zone during half a year and during the other half as in the arid subtropics.
Figure 2 shows that the annual average distribution of the ET in Cuba behave not homogeneously throughout the country and decreases from east to west. Table 2 shows the average monthly ETO values in the western and central regions of Cuba estimated using the Penman-Monteith equations.

Table 2 Average monthly by region in Cuba, 1960-2000. Source of data: Pacheco, Domínguez and Lamadrid (2006).

The WFGr is an indicator of freshwater pollution caused by growing potatoes, it is the water required to dilute the contamination by fertilizers and pesticides, until the concentrations do not exceed the regulatory defined maximum permissible levels (Hoekstra et al., 2011).
The grey component in the WFGr is calculated as:
 13
13
Where: AR is Chemical application rate of fertilizer or pesticides (kg/ha); α is leaching-run-off fraction; C max is maximum acceptable concentration (kg/m3); C nat is natural concentration of the pollutant (kg/m3); YP - Crop yield (t/ha).
Potato Crops in Cuba
Potatoes in Cuba are grown in the western and central regions of the country (Figure 3). These areas are characterized by temperatures, ranging between 18 and 28 °C during the dry season, which is the growth period for this crop. Consequently its production necessitates irrigation (González, 2012).
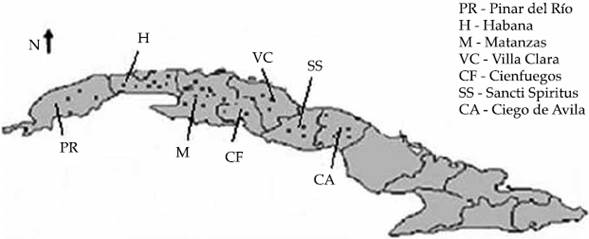
Table 3 shows the production and yield of potatoes in Cuba during the period 2009-2012.
Table 3 Yearly production and yield of the potatoes in Cuba by provinces. Source of data: ONEI (2013a).
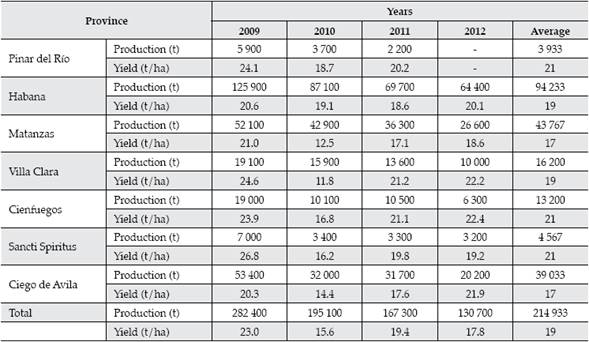
The yearly yield of potatoes in Cuba averages 19 t/ha, which exceeds the world average of 16 t/ha, but is far from the highest yields: Netherlands (45.8 t/ha), United States (40.6 t/ ha), Germany (40.5 t/ha) and the UK (40 t/ha) (Infoagro System SL, 2011).
Cuba has two seasons: a dry one from November to May and a rainy season from May till October. Potatoes are planted between November 20 and December 30. They are harvested by March. Table 4 shows the monthly average rainfall for the different provinces where potatoes are grown.

Results and Discussion
For this study December 10th has been chosen as the date when potatoes are planted. December 10th is the median between November 20 and December 30. An estimated 100 days later, on March 20 the potatoes are expected being harvested (Gonzalez, 2012).
Blue and Green Water Footprint
The evaporation is calculated on a day-by-day basis, whereas the rainfall is calculated over longer periods. The CROPWAT model (Allen et al., 1998) assumes that the mean monthly rainfall occurs during a six days interval events and that the rain is uniformly distributed over the month. Several studies use ten days intervals to calculate the effective rainfall and the irrigation needs (Hoekstra et al., 2011). In this study a 5 day interval is used, in analogy with the work of Aldaya and Hoekstra (2010).
The results of the average WFG and WFB for the last four years in the different Cuban provinces, are shown in Table 5. The average value of the WFG is 104.45 t/m3, a 30% higher than the WFB, but has less variability over the provinces with a mean standard deviation of 22.12 against 32.5 of WFB.

Despite potatoes are grown during the dry season (winter), the average rainfall contributes 64% to the CWR. The WFG is about 30% higher than WFB.
Grey Water Footprint
Nitrogen is used as an indicator for the impact of fertilizers and pesticides on the WFGR evaluation (Chapagain & Hoekstra, 2011). The amount of nitrogen that reaches the water bodies is assumed to be 10% of the amount of fertilizer applied. The recommended maximum value of nitrate (NO3) per liter in surface and groundwater, according to the World Health Organization and the European Union, is 50 mg of nitrate per liter and according to the US-EPA is 10 mg per liter (Mekonnen & Hoekstra, 2010). In Cuba there is a permissible standard of 50 mg of NO3 per liter (Gonzalez, 2012). In this study a naturally occurring concentration of 4 mg nitrate for litter is used (Betancourt, Suarez, & Jorge, 2012).
To grow potatoes in Cuba between 120 and 160 kg of fertilizer per ha is recommended (Gonzalez, 2012). This research uses a value of 140 kg/ha.
Table 6 shows the values of the WFGR for the last four years in the provinces where potatoes are grown.

The WFGR values have a low variability because the fertilizer application is implemented according to recommendations by the national planning.
Comparison of the WF of Potato with the WF of other Crops in Cuba
The mean value of crop potatoes WF for the period 2009-2012 in Cuba is 202 m3/t. Table 7 shows the comparison between the results obtained in this study and the reported by Mekonnen & Hoekstra (2011) for potatoes crop and others selected crops in Cuba. Also a result reported by Carmona (2010) about the WFGr for potatoes grown in Cuba is shown.

The different between values confirm the point raised by Herath (2013) about the need for more accurate measurements and calculations of the WF prior to its use as an effective tool to manage sustainability locally.
The WF of potatoes in Cuba is smaller than this of most other crops reported by Mekon-nen & Hoekstra (2011a and 2011b). Differences amount to a factor 15 in comparison with sugar cane. This is mainly related with the lower values of the WFG because potatoes are a dry season crop. On the contrary, potatoes show higher blue water values than half of the other crops, mainly because all production areas are irrigated. Potatoes show also high grey water values highlighting the environmental significance of this assessment. Cuban agriculture is subject to over fertilization, despite the financial problems of the country and the transition towards an ecological agriculture.
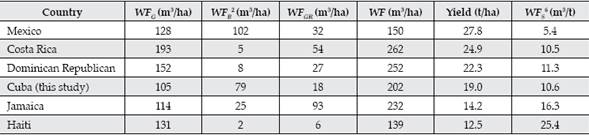
Table 8 shows that the WFG values are similar in these countries with similar climates. Also the WFB should show similar values, but more blue water is consumed in Jamaica, Cuba and Mexico. The WFGR shows the highest value in Jamaica where a lot of fertilize (1.5 t/ha), while the lowest value is recorded in Haiti where the fertilizer use is minimal (an application rate of 1.5 t/ha) (Carmona, 2010). Nevertheless, both countries obtain similar yields. The other countries in Table 8 show WFGR values in between those of Jamaica and Haiti, while they realize higher yields. Finally, the WFS values show that Mexico consumes the least amount of water per ton of produced in Costa Rica, Dominican Republic and Cuba consume similar amounts of water; and Jamaica and Haiti show the highest consumption.
Table 8 Comparison of the yield and the WF of potatoes in some countries. Source of data: FAO (2012); Mekonnen and Hoekstra (2011a and 2011b).
Conclusions
This study evaluated the WF of potatoes in Cuba, it shows that despite potatoes are harvested is in dry season and grown in irrigated areas exclusively, the rain could meet on average more than 60% of crop demand. Also is the crop with less difference between WFG and WFB.
The WF of potatoes in Cuba is less than in countries like Costa Rica and the Dominican Republic, although WFs are similar, the WFGR is much smaller achieving a more efficiency in fertilize use.
The significant differences between the results of the WF based in local Cuban data and reported in international studies highlight the importance of local studies for the implementation of more sustainability management of agriculture.

