


 nueva página del texto (beta)
 Inglés (pdf)
 Artículo en XML
 Referencias del artículo
 Enviar artículo por email
 Citado por SciELO
  Similares en
SciELO
Similares en
SciELO 
 Permalink
Introduction
Groundwater constitutes the largest reservoir of freshwater in the World, accounting for over 97% of all freshwater available on Earth, excluding glaciers and ice caps. The remaining 3% is composed mainly of surface water (lakes, rivers, wetlands) and soil moisture (Quevauviller, 2008). Despite their relevance, contamination of groundwater systems is an increasingly critical problem, once an aquifer is contaminated it is practically unfeasible to clean and the possibilities of remediation involve high economic costs (Wang, 2006).
Groundwater is a hidden source which is quantitatively much more significant than surface water, and for which pollution prevention and quality monitoring and restoration are even more difficult than surface waters, mostly due to its inaccessibility (Quevauviller, 2008). Prevention of contamination is critical for effective groundwater management (Babiker, Mohamed, Hiyama, & Kato, 2005), especially considering the uncertainty about future climate scenarios. Projections indicate that climate change will vary by region and locality, bringing a modification on the frequency of extreme climate phenomena, such as floods and droughts (Bergkamp, Orlando, & Burton, 2003). Groundwater is extensively used by humans as drinking water, with some countries depending almost entirely on it, while others only partly, highlighting the relevance of groundwater quality and quantity conservation as an adaptation strategy to climate change (Quevauviller, 2008).
Groundwater vulnerability to contamination maps are becoming more in need because, on the one hand, groundwater represents the main source of drinking water, and on the other high concentrations of human/economic activities, e. g. industrial, agricultural, and household, represent real or potential sources of groundwater contamination (Rahman, 2008). The concept of groundwater vulnerability mapping is useful for environmental planning and decisionmaking, and different methods have been developed for the determination of aquifer pollution vulnerability (Gogu & Dassargues, 2000). These methods, mostly based on index and overlaying techniques, have been used under distinct geological contexts: DRASTIC, SINTACS, AVI and GOD (Exposito, Esteller, Paredes, Rico, & Franco, 2010), and they have also been addressed in comparative studies (Agüero & Pujol, 2002; Gogu & Dassargues, 2000; Lobo-Ferreira & Oliveira, 2004; Napolitano & Fabbri, 1996). The nature of the index is to assign values to each hydrogeological characteristic, which are later combined to calculate an overall vulnerability value in order to classify regions into different units of potential contamination (Kumar, Bansod, Debnath, Thakur, & Ghanshyam, 2015).
An estimated 80% of the potable water supply in Paraguay in South America is made from underground water. Cabral (2005) estimates that at least 38% of the population of the Country lives on the Guarani Aquifer System and is supplied by its waters and that certain conditions, specifically intensive agriculture and urban wastes are or will be risking water quality of the Guarani Aquifer System, specially due to widespread use of land for intensive soybean production as well as other crops (e. g. maize, sunflower). Global concerns about the association of soybean production and other crops as a major source of groundwater contamination (Clay, 2004) have been taken as subject of interest for this study, specifically for two catchments located in this region. Our study aimed to determine current groundwater vulnerability to contamination of the "shallow aquifers" using DRASTIC and GOD models for the Mboi Cae and Quiteria River watersheds and to assess possible effects of climate change on vulnerability categories as well as water table changes derived from the Yacyreta Dam operations. Our two study watersheds are locally perceived as a single socio-hydrological unit, sharing one watershed committee and common actors involved in its management. This study focuses on the area of both watersheds located within the influence of the Guarani Aquifer System and the Yacyreta Dam. Groundwater mapping was carried out to provide the resulting maps to the watershed committee, but also as a comparative exercise of the suitability of the application of the two models, specifically data input, considering available information for this region. Groundwater vulnerability maps are presented here as an intrinsic characteristic of the studied site in the possible threat of contaminants including, but not limited to, soybean intensive production (For a list of contaminants associated with soybean intensive agriculture see: Paraíba et al., 2003).
Materials and Methods
The Guarani Aquifer System is one of the largest groundwater reservoirs of the planet (Oporto & Vassolo, 2003; Fariña et al., 2004). It is located in South America between 12° and 35° latitude South and 47° and 65° longitude West. It is estimated that the aquifer contains a reserve of 45 000 cubic km of water covering an area of approximated 1.2 million sq km of which 840 000 sq km belong to Brazil, 225 500 sq km to Argentina, 71 700 sq km to Paraguay and 58 500 sq km to Uruguay (Cabral, 2005). In Paraguay, the Guarani Aquifer System is located in the eastern side of the country, forming a strip that extends from North to South, along the Parana River (Fariña et al., 2004), part of La Plata river basin.
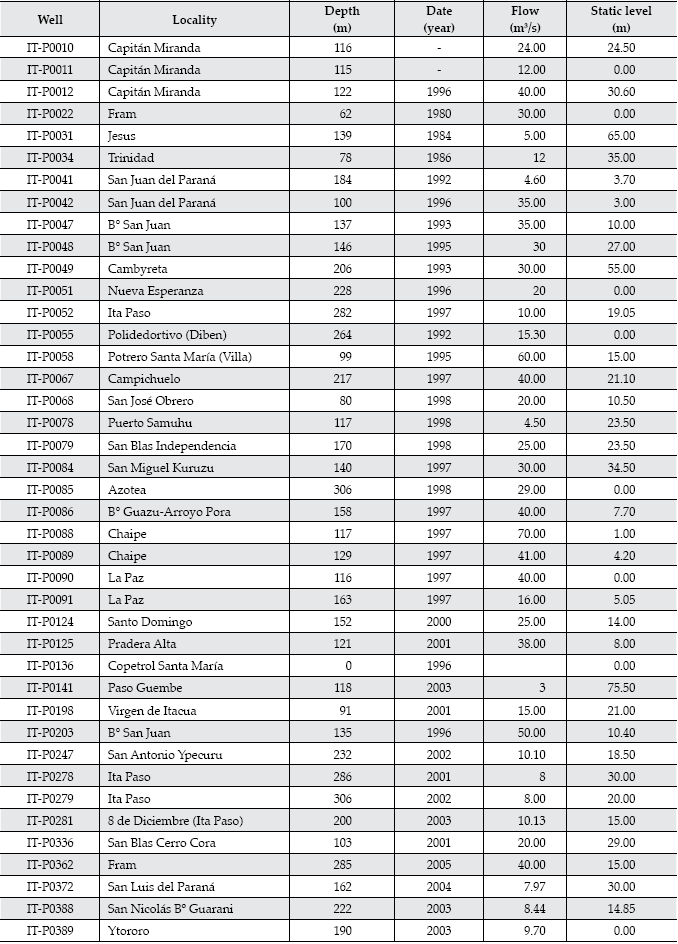
Within the aquifer system, we selected two watersheds which are of local interest for the Yacyreta Binational Entity and the local watershed committee and where the largest urban populations in the Itapua Department are being affected by the Yacyreta Dam project in Paraguay and intensive agricultural activities account for at least 80% of the total area of the watersheds. The watersheds of the Mboi Cae and Quiteria Rivers (286 sq km and 352 sq km respectively) are located in the Itapua Department of Paraguay, both draining to the Parana River, which partially constitutes the political boundary between Paraguay and Argentina (Figure 1). We used two models for groundwater vulnerability mapping: DRASTIC, originally published by Aller, Bennett, Lehr, Petty, and Hacket, (1987) and GOD published by Foster, Hirata, Gomez, D'elia, and Paris (2002). These models being trialed in several subsequent works: in India (Kumar, Thirumalaivasan, & Radhakrishnan, 2014; Rahman, 2008; Shahid 2000), Paraguay (Laino, Jiménez, Velazquez, Paez, & Casanoves, 2006, Larroza, Fariña, Baez, & Cabral, 2005), Japan (Babiker et al., 2005), El Salvador (Vignola, 2005), Nicaragua (Obando, 2005), Mexico (Ceballos & Avila, 2004; Exposito et al., 2010), Portugal (Lobo-Ferreira & Oliveira, 2004), USA (Chowdhury, Iqbal, & Szabo, 2003), Costa Rica (Agüero & Pujol, 2002), and Italy (Napolitano & Fabbri, 1996). Input data and sources for the models is presented in Table 1. Data of the hydrogeological conditions was obtained for each parameter using different sources and methods and explained in Table 2.
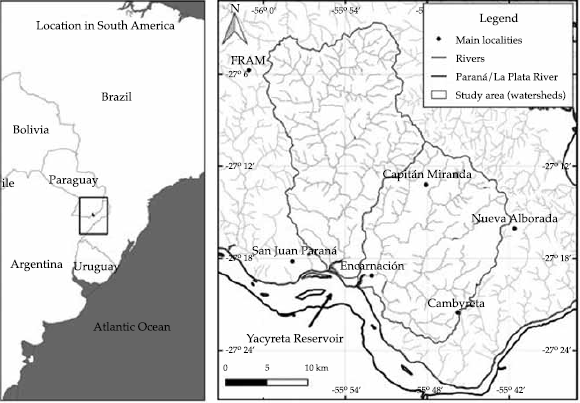
Figure 1 Location of the study area, Mboi Cae and Quiteria watersheds in Itapua Department, Paraguay. Yacyreta binational reservoir partially shown (Argentina and Paraguay). Sources: NaturalEarth, Military Geographic Institute of Paraguay and Musálem (2010).
Table 1 Summary of the sources of information and processes followed to obtain DRASTIC and GOD ratings for the watersheds of the Mboi Cae and Quiteria Rivers in Paraguay.

Table 2 Data used and considerations for the application of the groundwater vulnerability models DRASTIC and GOD. Values were reclassified to vulnerability classes respectively, using DRASTIC (Aller et al., 1987) and GOD (Foster et al., 1987) indexes for final computation. For more details about the data calculations see Musálem (2010).

DRASTIC Calculation
The acronym DRASTIC corresponds to the initials of seven base maps as follows: D: Depth to water / R: Net Recharge / A: aquifer media / S: Soil media / T: Topography / I: Impact of the vadose zone/ C: Hydraulic Conductivity. Each of the parameters is mapped and classified either into ranges or into significant media types which have an impact on pollution potential. Each factor or parameter is assigned a subjective rating between 1 and 10. Weight multipliers are then used for each factor to balance and enhance its importance. The final vulnerability, the DRASTIC index, is computed as the weighted sum overlay of the seven layers, according to Aller et al. (1987).
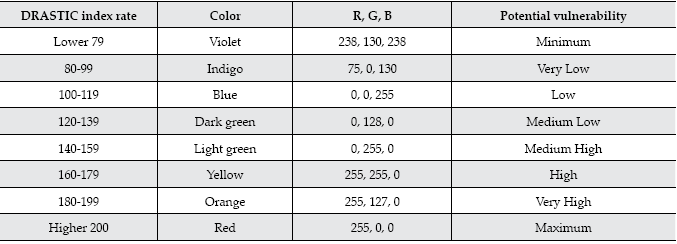
Drastic index categories were also taken from Aller et al. (1987) case study for the DRASTIC methodology assigning a color scheme known as "US national color code for DRASTIC index ranges" (Table 3). We used this same categorization to determine changes derived from water table changes (section 3.3) and climate change scenarios (section 3.4). Due to its relevance as a frame of reference seldom utilized it is presented in this paper.
Table 3 DRASTIC index classification from Aller et al. (1987) and interpretative values according to US national color code.
GOD Calculation
GOD is the acronym for the following parameters: groundwater confinement (G) in the aquifer under consideration; overlaying strata (O) or vadose zone in terms of lithological character and degree of consolidation that determine their contaminant attenuation capacity (equivalent to impact of the vadose zone for DRASTIC); and depth to groundwater table (D) or to groundwater strike in confined aquifers (See Table 3 for more details in how data has been obtained and prepared for the models). According to GOD methodology the resulting aquifer vulnerability to pollution index is considered as the product of these three parameters, which is translated into a proposed categorization by Foster et al. (2002).
Changes in Groundwater Vulnerability from Dam Operations
An increase in water table due to Yacyreta dam operations has been debated, in face of the final 5 meter rise of the the Yacyreta reservoir to full capacity (years 2008-2009). Information of hydrogeological studies carried out by Lotti-Associatti (1999) and a review made by hydro-geologist Miguel Auge (n/a), regarding the possible effects of water table elevation to the aquifer, show that still little is known on how groundwater will behave after the water level of the dam changes from 78 m to 83 m. On one side of the predictions Lotti assures that due to the "strong basaltic" hydrogeology of the area, only a small "marginal fringe" of approximately 12.5 meters will be affected generating changes in the water table; in the other hand, Auge opposes this prediction by stating that there is not enough hydrogeological data available in the area to determine how change in the water level of the reservoir will affect groundwater, concluding the need for a stronger sampling using boreholes and the use of tridimensional models instead of the two dimensional models used by Lotti. So far no complementary studies or field data has been found in literature regarding changes in water table until this publication.
A worst case scenario was used to visualize and compare possible changes in aquifer vulnerability to pollution, where the change in the water table is equivalent to the elevation of the dam reservoir (5 m). Although unlikely to actually occur, considering information from Lotti, it serves the purpose of showing the extreme event of affecting the water table (depth to water parameter in DRASTIC and GOD) in the whole area of the watersheds.
Changes in Vulnerability from Climate Change Scenarios
We used climate change scenarios in mean annual precipitation and mean annual temperature caused by global climate change according to three diffeent greenhouse gases emission scenarios considered by Limia (2000) and Gonzalez (2005). Our climate change scenarios considered changes of mean anual precipitation (+16.2% and -11.5%) in a 100 year span. These changes in precipitation were used to change values in net recharge, estimated locally as 3% of precipitation for the basaltic area of the watersheds (Table 4).
Results and Discussion
Vulnerability mapping as a result from application of GOD and DRASTIC models is shown in Figure 2 for current conditions and predictions of change in groundwater vulnerability derived from dam operations. Results of GOD model show a 96% of the area of the Watersheds with values of 0.3 - 0.5 (moderate vulnerability to pollution) and 4% (Values 0.51 -0.6) resulted as high vulnerability. Higher values are present in lower areas of the watersheds, where depth to groundwater is minimal and alluvial sands are present. DRASTIC model shows a 56% of the area of the watersheds to be classified as "medium high" (DRASTIC index 140-159) and a 22% percent as either "high", "very high" or "maximum" (DRASTIC index values 160 ->200).
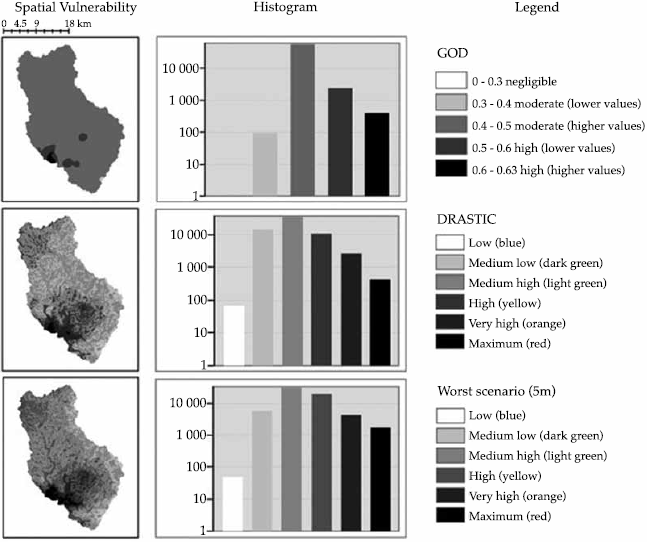
Figure 2 Aquifer vulnerability to pollution according to GOD and DRASTIC models and a worst case scenario for DRASTIC assuming water table increase from dam operations. Watersheds of the Mboi Cae and Quiteria Rivers in Paraguay.
Worst case scenario regarding water table change increase in 5 meters showed changes in vulnerability categories in DRASTIC. While "low" and "medium low" values lowered from 21.7 to 9.11% of the watersheds, and medium high values lowered from 56 to 50% of the total area of the watersheds, "high", "very high" and "maximum" values increased from 22% to 40% of the watersheds.
Changing the precipitation values, hence changing net recharge estimations, using climate change scenarios for a 100 year span, did not seem to affect the final DRASTIC outcome. Even though values changed in the resulting maps, vulnerability categories remained the same. Climate change scenarios were not analyzed with GOD model, since recharge values cannot be changed directly within the model, but instead focuses on geological characteristics of the overlaying strata.
Discussion
DRASTIC outcome maps show a more heterogeneous distribution of vulnerability classes compared to the GOD model. Similar remarks were made by Agüero and Pujol (2002) while discussing their experience in applying the same models in the Central Valley of Costa Rica. Despite the DRASTIC model being used worldwide to determine aquifer intrinsic vulnerability, a constant discussion is the relation of the DRASTIC index with the real pollution found in the aquifer. Leone, Ripa, Uricchio, Deak, & Vargay (2009) after studying the vulnerability and risk evaluation of agricultural nitrogen pollution for Hungary's main aquifer using DRASTIC and GLEAMS models conclude that DRASTIC, as a parameter/qualitative method, performs better in the general correspondence of trends, which means a correspondence between higher nitrate content and higher DRASTIC scores. However, this is not necessarily true for all areas where these and other pollutants have been sought, thus, papers where investigation on areas which were evaluated with these techniques, and when applied to areas which are already contaminated are still in great need to understand the application of these models and their prediction capacities and results.
As a first approach, and not withstanding the need of proper further water quality analysis, we propose the use of these models, which can also provide help determining knowledge gaps of hydrogeological characteristics of the watersheds. It should also be noted that the application of these models, does not seek to evaluate on specific threats, which would require each threat to be studied independently, but instead, intends to determine the intrinsic hydro-geological settings and their vulnerability, which could better lead to determining areas which could be directed towards conservation or special management considerations.
According to Rupert (1999), DRASTIC, despite being used to develop groundwater vulnerability maps in the United States, has met with mixed success, since it is usually not calibrated to measure contaminant concentrations, suggesting necessary improvements to the DRASTIC groundwater vulnerability mapping by calibrating the rating scheme. However, DRASTIC still can be considered a first approach to GVP, specifically when information is limited or when the vulnerability concept does not include only a particular pollutant threat or risk but as described by Lobo-Ferreira and Oliveira (1997) "vulnerability is the one that refers to the intrinsic characteristics of the aquifer, which are relatively static and beyond human control". Despite our study agreeing with this general concept, we consider human activities, such as the effects of large dam operations influencing water table could affect vulnerability to pollution.
Locally, Laino (2005) found distinct values in neighboring Capiibary River watershed. After comparison of classes, 36% showed a "low" vulnerability and 64% a "medium low", "medium high" and "high" categories. The categorization used by Laino was different from the used for the present study, thus comparing both studies was only possible at this level. This situation leads to suggest a standardization of results for easier comparison among studies.
Our experience in application of both models, is in accordance to remarks by Gogu and Dassargues (2000) considering the concept of groundwater vulnerability as a useful tool for environmental planning and decision-making, we also found that simple models provide similar results to the complex ones. To our experience, a simpler model (such as GOD) is more likely to meet data input available currently for Paraguay, however loosing in finesse of the final result. Since DRASTIC and GOD are a first step towards assessing groundwater vulnerability and considering that literature review suggests reconfirming data with specific contaminants and risks, a further validation of the model at the local level is suggested for future research, including analysis of groundwater quality and monitoring.
Conclusions
Aquifer vulnerability to pollution was found to be intermediate-high similarly using both DRASTIC and GOD models, more detailed results were obtained when using DRASTIC which was also in demand of data which was not readily available for the study area or at the appropriate scale. Higher vulnerability values were found towards the lower parts of the study area with both models showing similar descriptors and values in the respective scales. A "medium to high" vulnerability shows that concerns about pollution of the aquifer in the midterm should be considered to instrument possible programs dedicated to the minimization of contaminants in agriculture, but also, since the highest vulnerability areas are located in the lower parts of the watersheds, where urban areas are settled, our results suggest the need to identify pollution sources in urban areas as a possibly major threat to the shallow aquifer. It was also unexpected that climate change scenarios didn't show changes in vulnerability classes. This highlights the importance of groundwater protection, study and conservation as a mitigation strategy to climate change and justifies the need to better understand management practices and their impact in groundwater.
We propose the use of the National Color Code as a frame of reference for future DRASTIC applications allowing a simpler comparison of results. It should be noted that vulnerability assessment implies uncertainties associated with the calculations and limitations of the data used (National Research Council, 1993; Kumar et al., 2015), thus, this uncertainties are acknowledged for this study as well, and recommend further work and more data to progress towards better approximations.

