


Servicios Personalizados
Revista
Articulo
 Inglés (pdf)
 Artículo en XML
 Referencias del artículo
 Enviar artículo por email
Indicadores
-
 Citado por SciELO
 -
 Accesos
Links relacionados
-
 Similares en
SciELO
Similares en
SciELO
Compartir

 Permalink
Tecnología y ciencias del agua
versión On-line ISSN 2007-2422
Tecnol. cienc. agua vol.6 no.5 Jiutepec sep./oct. 2015
Artículos técnicos
Hydrological Modeling of the Tampaon River in the Context of Climate Change
Modelación hidrológica del río Tampaón en el contexto del cambio climático
Juan Alberto Velázquez*
El Colegio de San Luis A.C., México
* Autor de correspondencia
Magali Troin
Université du Québec à Montréal, Canadá
Daniel Caya
Consortium Ouranos, Québec, Canadá
Institutional Addresses
Juan Alberto Velázquez Ph.D.
Catedrático Conacyt- El Colegio de San Luis A.C.
Parque de Macul 155
78299 San Luis Potosí, México
Tel.: (444) 8110101 x 5301
jvelazquez@colsan.edu.mx
Magali Troin Ph.D.
Université du Québec à Montréal
Centre ESCER
CP 8888, Succ. «Centre-Ville»
Montréal (Québec) Canada H3C 3P8
Phone: (514) 2826 464 x 347
troin.magali@ouranos.ca
Daniel Caya Ph.D.
Consortium Ouranos
550 Sherbrooke West, West Tower, 19th floor
Montréal (Québec), Canada H3A 1B9
Phone: (514) 2826 464 x340
caya.daniel@ouranos.ca
Abstract
This work compares the hydrological modeling of the Tampaon River Basin (in east-central Mexico) with two hydrological models (SWAT and GR4J) and then evaluates the impact of climate change on the water balance of the basin. The calibration and validation of the models (over 14-year periods) show that both performed satisfactorily when simulating daily flows. The results indicate that SWAT more precisely reproduces observed mean monthly streamflow while GR4J overestimates it during the dry season and underestimates it during the rainy season. The analysis of the impact of climate change was performed by using climate ensemble simulations derived from the Canadian Global Climate Model (CGCM3) downscaled by the Canadian Regional Climate Model (CRCM). The climate simulations (after bias correction) were used as input data for both hydrological models for two periods: a reference period (1971 – 2000) and a future period (2041-2070). The results indicate a significant decrease in mean monthly streamflow in the Tampaon River Basin for the future period (-36 to -55%), as well as a decrease in maximum monthly streamflow (-34 to -60%) and minimum monthly streamflow (-36 to -49%). The results from this study provide an overall perspective of the potential impact of climate change on the hydrological response of the Tampaon River Basin.
Keywords: Canadian Regional Climate Model, SWAT, GR4J, climate change impacts.
Resumen
Este trabajo presenta, en un primer paso, un estudio de comparación de la modelación hidrológica de la cuenca del río Tampaón (localizada en el centro-este de México) con los modelos hidrológicos SWAT y GR4J, y en un segundo paso, la evaluación del impacto del cambio climático en el balance hídrico de la cuenca. La calibración y validación de los modelos (en periodos de 14 años) mostró un desempeño satisfactorio de ambos en la simulación de caudales diarios. Los resultados mostraron que SWAT reproduce de manera más precisa el caudal medio mensual observado, mientras que GR4J lo sobrestima en la temporada seca y lo subestima en la húmeda. El análisis del impacto del cambio climático se realizó a partir de simulaciones provenientes del Modelo Climático Mundial Canadiense (CGCM3) regionalizado con el Modelo Regional Canadiense (CRCM). Las simulaciones climáticas (una vez corregido el sesgo) se usaron como datos de entrada a los modelos hidrológicos para dos periodos: uno referente (1971-2000) y otro futuro (2041-2070). Los resultados estiman una disminución importante del caudal medio mensual en la cuenca del río Tampaón para el periodo futuro (entre -36% y -55%). Además, se valora una disminución del caudal máximo mensual (entre -34% y -60%) y mínimo mensual (entre -36% y -49%). Los resultados de este estudio aportan una visión general del potencial impacto del cambio climático en la respuesta hidrológica de la cuenca del río Tampaón.
Palabras clave: modelo climático regional canadiense, SWAT, GR4J, impacto del cambio climático.
Introduction
Assessing the impacts of climate change on water resources is one of the major challenges of the 21st century. The expected changes in temperature and precipitation will have an impact on the hydrological cycle and, therefore, on water availability for human uses and economic activities. Mexico is particularly vulnerable to climate change, since many Mexican regions are sensitive to extreme climate events (Arreguín-Cortés & López-Pérez, 2013). In addition, water demand for agricultural, urban, and industrial sectors in Mexico has grown much more quickly because of the rapid expansion of these sectors in recent decades (Mundo & Martínez-Austria, 1993), and climate change will make responding to this increasing demand for water more difficult (Magaña & Conde, 2000).
Climate change projections for Central America (Mexico included) suggest increases in temperature, and increases or decreases in precipitation that will have an impact in future streamflow and water availability in the region (IPCC, 2014). The projected change of temperature depends on the considered emission scenario and geographical location. For instance, Martínez-Austria (2007) presented an analysis of projected temperature in Mexico based on GCM outputs: in scenario A2 (high), the projected temperature increase is expected to be between 4°C and 6°C, while in scenario B2 (medium) it will be between 2°C and 4°C. Martínez-Austria (2007) also discussed the results obtained by Morales, Magaña, Barrera and Pérez (2001); this latter study identified regions with the highest and the lowest projected increment of summer temperature (i.e., Northwestern Mexico and the Chiapas-Tabasco Zone, and the Yucatan Peninsula, respectively).
Despite Mexico's vulnerability to the potential impacts of climate change, few studies have evaluated the impact of climate change on the country's water resources. For instance, Mendoza, Villanueva and Adem (1997) divided the Mexican territory into twelve hydrological regions to evaluate the vulnerability of hydrologic regions to future climate change. The climate change scenarios were obtained from two Global Circulation Models (GCMs) and a hydrological model was applied to determine annual surface runoff, water volume and storage under future climate conditions (year 2050). They showed that the expected climate change may have dramatic impacts on the pattern and magnitude of runoff, on soil moisture and evaporation, and on the aridity level of some of Mexico's hydrological zones. Maderey, Jiménez and Carrillo (2013) estimated the amount of available water over three large basins in Mexico (i.e., Lerma-Chapala Basin, the Balsas River Basin and the Panuco River Basin). Climate data were obtained from two GCMs and one climate thermodynamic model, and the change in water availability was estimated with a water balance model for the 2025-2050 period. Their results showed that the three climate models predict a decrease in available water volumes for all basins.
Rivas-Acosta, Güitrón-De-Los-Reyes and Ballinas-González (2010) assessed the climate change impact on runoff for three Mexican catchments with contrasted climatic conditions: The Conchos River Basin (North Mexico), the Lerma-Chapala River Basin (Central Mexico) and the Grijalva River Basin (South Mexico). Rivas-Acosta et al. (2010) considered outputs from 23 weighted GCMs under two IPCC emission scenarios (A1B and A2). The runoff was estimated with a water balance model and a vulnerability index was computed. Results show that future (2030, 2050, 2100) mean annual runoff is expected to decrease over the three catchments. Tapia, Minjarez and Espinoza (2014) evaluated climate change's impacts on the water balance of the Yaqui River Basin by using climate data from one GCM under two IPCC scenarios (A1B and A2) for the 2010-2099 period. Various runoff behaviors were obtained, indicating the possibility of frequent droughts, alternating with years of substantially high runoff.
The above studies are based on a low spatial resolution of climate models (i.e. GCMs) and the assessments of climate change's impact on the catchment's hydrology are estimated using a water balance model only. Rainfall-runoff models have also been used in the evaluation of the climate change impact on water resources in Mexican catchments. For instance, Robles-Morua, Che, Mayer, and Vivoni (2015) used a semi-distributed hydrological model and a reservoir optimization algorithm to evaluate the hydrological impact of climate change in the semi-arid Sonora River Basin (North-West Mexico) under the A2 IPPC emission scenario. Results showed significantly higher precipitation in future period (2031-2040) relative to the historical period (1990-2000) that would cause an increase in reservoir inflows.
In the present study, the projected change in streamflow based on scenarios derived from two rainfall-runoff hydrological models is explored for a Central Mexican catchment. This modeling approach, in which a hydrological catchment model is fed with downscaled climate scenarios from GCMs, is particularly useful for a wide range of impact studies, including water resource planning, development and management, flood prediction, droughts, water quality and hydro-ecology.
Hydrological models have different degrees of complexity and conceptualisation of physical processes. They can be classified, considering their spatial distribution, as lumped or distributed models. In a lumped model, the catchment is regarded as a unit. The variables and parameters thus represent average values for the entire catchment. On the other hand, a distributed model takes spatial variations into account (e.g., topography, vegetation and soils) in all variables and parameters. As previously mentioned, hydrological models also differ in their representation of physical processes: a physically-based model describes the natural system using mathematical formulations of physical processes while a conceptual model is constructed based on physical processes, in which physically-based equations are used along with semi-empirical equations (Refsgaard, 1996). Recent research in hydrologic modelling tried to take a more physically-based approach to understand hydrologic systems' behaviour to make better future streamflow predictions and to face major challenges in water resource management.
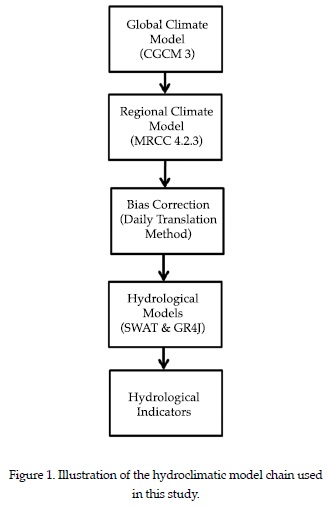
This study aims to evaluate the impact of climate change on the hydrology of the Tampaón River Basin in Mexico. In the first step, two hydrological models are implemented over the basin, and their performances in simulating streamflow are compared. The selected hydrological models have different structural approaches: SWAT is a physicallybased semi-distributed model (Arnold, Srinivasan, Muttiah, & Williams, 1998) and GR4J is a conceptual lumped model (Perrin, 2000). Next, climate change impact assessments on the catchment's hydrology are evaluated using the hydroclimatic model chain illustrated in Figure 1. This model chain consists of GCM outputs dynamically downscaled by a Regional Climate Model (RCM) to feed both hydrological models. Since RCM outputs usually present considerable biases in climate variables, precluding their direct use in hydrological models (Ho, Stephenson, Collins, Ferro, & Brown, 2012), an adjustment of the RCM-simulated precipitation and temperature is made using a bias correction procedure; this allows climate projections to be meaningfully translated to the hydrological scale (Troin, Velázquez, Caya, & Brissette, 2015). The hydrological simulations are evaluated under current (1971-2000) and future (2041-2070) climates by analyzing hydrological indicators for mean, high and low flows.
The manuscript is organized as follows: first, the experimental design is presented, including the study area and climate model simulations used in this study. Second, a description of the bias correction procedure and the hydrological models is given. Third, relevant results of the catchment-scale hydrological modeling as well as an evaluation of the impact of hydrological climate change in the Tampaón River Basin are analyzed and discussed. Finally, concluding remarks close the manuscript.
Experimental design
Study Catchment
The Tampaón River Basin is located in the East-Central region of Mexico, lying mostly in the State of San Luis Potosí (23 373 km2; IMTA, 2014). It also covers the northern area of the States of Guanajuato and Querétaro, and a region of the south of the State of Tamaulipas. The Tampaón River Basin is a sub-catchment of the Panuco River Basin (hydrologic zone 26; Sedue, 1986) which flows into the Gulf of Mexico. Its topographic relief has elevations ranging from 18 m to 3 500 m with maximal elevation on the mountainous western borders (Figure 2).

The farthest headwater of the Tampaón River Basin is the Santa Maria River, which originates in the state of Guanajuato, flowing from west to east through the Sierra Madre Oriental chain mountain. The junction of the Santa Maria River with the Verde River makes the start of the Tampaón River. From here, the Tampaón River flows to the northeast to join the Gallinas River and the Valles River. The Valles River provides the largest volume of streamflow to the Tampaón River. There are three climatic regions in the Tampaón River Basin as a result of topographic variation in the Sierra Madre Oriental mountain chain (Sedue, 1986): the climate is warm and humid in the east, semi-warm and semi-humid in the central zone, and dry and temperate in the west.
Observational Datasets
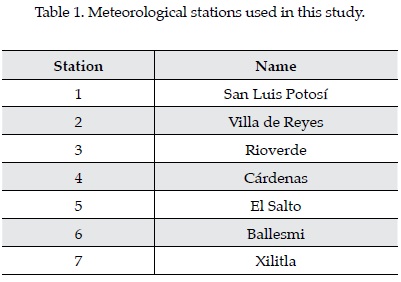
The daily time series of precipitation (P) and minimum and maximum temperatures (Tmin and Tmax) were taken from the climatologic data base CLICOM (2014), built by the SMN (Servicio Meteorológico Nacional de México). These data come from seven stations over the 1971-2000 period (Figure 2, Table 1). The rainy season extends from May to October and the dry season from November to April (Figure 3). The catchment area's mean annual rainfall is about 1080 mm. The annual average daily temperature ranges from 13 to 30 ºC with an annual mean of 21.5 ºC (Figure 4). The coldest and warmest months are January and May, respectively. The three previously described climatic regions of the Tampaón River Basin are well depicted by the group of observational data.


The discharge data comes from the gauging station El Pujal (located downstream of the Valles River) for the 1971-2000 period; this data was obtained from the National Database of Surface Water (i.e., Bandas, 2014). Figure 5 shows the observed mean monthly discharges at the gauging station. Two peak flowsoccur in July and September. The decreased discharge in August is due to the midsummer drought. Low flow values occur fom January to May.

The Climate Model Simulations
The GCM ensemble simulations used in this work are the five members of the Canadian Global Climate Model (CGCM3, Scinocca, Mc-farlane, Lazare, Li, & Plummer, 2008) under the IPCC SRES-A2 greenhouse gas emission scenario. Each member of the ensemble had been estimated by repeating a climate change experiment using the GCM several times when only the initial conditions were changed by small perturbations (Braun, Caya, Frigon, & Slivitzky, 2012). Although GCMs are the primary source of future climate projections, the spatial resolution of those model outputs is still too coarse to be used directly in hydrological impact studies. Therefore, the CGCM3 model was dynamically downscaled by the Canadian Regional Climate Model, version 4.2.3 (CRCM; De Elía & Côté, 2010). Daily precipitation, maximum and minimum temperature series were derived from the CRCM simulations for the reference (1971-2000) and future (2041-2070) periods.
The atmospheric component of CGCM3 is characterized by a spectral model with T47 horizontal resolution (3.75° x 3.75°) and 31 vertical layers (Scinocca et al., 2008). The Canadian Regional Climate Model derived as an evolution of its previous versions (Caya & Laprise, 1999; Laprise, Caya, Frigon, & Paquin, 2003; Plummer et al., 2006), which covers the large North American domain (AMNO; 200 x 192 grid points) with a horizontal grid-point spacing of 45-km (true at 60° N). The CRCM has largely been used to evaluate the impact of climate change on North American's catchments (e.g., Muerth et al., 2013; Velázquez et al., 2013; Troin et al., 2015), and this is the first time that CRCM has been used for an impact study on a Mexican catchment.
Methods
Bias Correction Procedure
Climate model simulations are affected by biases (i.e., differences between the climate model simulations and observations) that, if not corrected, can lead to somewhat unrealistic streamflow reproduction. Therefore, it is necessary to perform bias correction on the outputs of climate model simulations before using them in hydrological models for impact assessment (Teutschbein, Wetterhall, & Seibert, 2011).
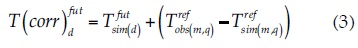
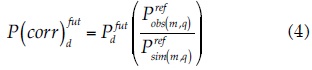
The bias correction method used to adjust and downscale CRCM-simulated precipitation and temperature to the station scale in the catchment is the Daily Translation (DT) method (Mpelasoka & Chew, 2009). In DT, different correction factors (differences in percentiles between observed and climate model simulated data during the reference period) are applied to the frequency distribution of projected cli-mate model data for the future period. The DT method is applied on a monthly basis, and fifty percentiles are calculated for each month. The corrected temperature and precipitation in the reference (ref) period are computed using the following equations:


where T (corr) and P (corr) are the bias corrected variables, and the subscripts correspond to percentile (q), daily (d) and monthly (m) time steps, raw climate simulations (sim) and observations (obs). For the future period (fut), the corrected precipitation and temperature are obtained using:
Description of the Hydrological Models
Two hydrological models were selected for this study: SWAT and GR4J. The two models differ in terms of parameter number, structure and physical meaning in their simulations of rainfall-runoff processes. Although this study provides an opportunity for model comparison in a Mexican catchment, both models are also applied to the Tampaón River Basin to assess the hydrological model's uncertainty in climate change impact studies.
The Soil Water Assessment Tool (SWAT) model was developed at the United States Department of Agriculture (USDA) by Arnold et al. (1998). SWAT is a physically-based semidistributed model that operates the daily time step (Neitsch, Arnold, Kiniry, Williams & King, 2002). SWAT takes into account the spatial variability of the topography, land use, and soil type in order to represent the catchment in multiple Hydrologic Response Units (HRUs). The input variables required to run SWAT are daily precipitation and daily maximum and minimum air temperatures. The watershed hydrology in SWAT is simulated in two steps. The first step is the land phase of the hydrologic cycle, which calculates the water balance of each HRU to provide the amount of water available for each sub-basin's main channel at a given time step. The second step is channel routing, which determines water's progress through the river network towards the basin outlet (Neitsch et al., 2002). A detailed description of model components is presented in Neitsch, Arnold, Kiniry, and Williams (2005).
The GR4J model (which stands for modèle du Génie Rural à 4 paramètres Journalier) is a daily lumped four-parameter rainfall-runoff model developed by Perrin (2000). The input variables are daily precipitation and potential evapotranspiration (PE). For this study, the PE was computed using the formulation (exploiting extraterrestrial radiation and mean daily temperature) proposed by Oudin et al. (2005), which has been shown to be as effective for rainfall-runoff modelling objectives as more complex evapotranspiration formulations. In GR4J the hydrology is simulated as follows: First, the model subtracts PE from precipitation to calculate net rainfall. Then, through interception, a portion of the precipitation goes into the production store, where the actual evaporation is calculated and percolation occurs. Another portion of precipitation goes directly to flow routing. The routing part of the structure consists of two flow components routed by two unit hydrographs and a non-linear store. A detailed description of the model structure is presented in Perrin, Michel and Andreassian (2003).
The hydrological models' performance is evaluated using the Nash-Sutcliffe (NS) coefficient (Nash & Sutcliffe, 1970):

where Qobs,i and Qsim,i are the observed and simulated streamflows at time step i, and N is the total number of observations. An efficiency of 1 (NS = 1) corresponds to a perfect match of modeled discharge to the observed data.
The second performance criterion is the Mean Square Error (MSE) which is computed as:
An MSE value of zero corresponds to a perfect match between modeled discharge and observed data. The MSE is computed by squaring forecast errors, so it is very sensitive to large errors and outliers (e.g., Wilks, 2006).
Results and Discussion
Performance of the Hydrological Models
Table 2 shows the Nash-Sutcliffe (NS) coefficient for the calibration (1971-1985) and the validation (1986-2000) periods for the two hydrological models. Both models present high NS-values, ranging from 0.87 to 0.91 in the calibration period and from 0.75 to 0.85 in the validation period. SWAT performs slightly better than GR4J over the calibration and validation periods.
Figure 6 shows the scatterplot of observed versus simulated discharges for SWAT and GR4J over the calibration and validation periods. In the scatterplot, the more the two data sets agree, the more the scatters tend to concentrate in the vicinity of the 1:1 line. From Figure 6, it can be seen that GR4J better simulates the daily low flows, while the daily high flows are better predicted by SWAT. As this performance criterion penalizes errors in the highest streamflow, SWAT presents the lowest values of MSE (0.10 and 0.14) while GR4J presents the highest values of MSE (0.14 and 0.23, see Table 2). Figure 6 also shows that SWAT tends to slightly overestimate daily streamflow while GR4J slightly underestimates daily streamflow.
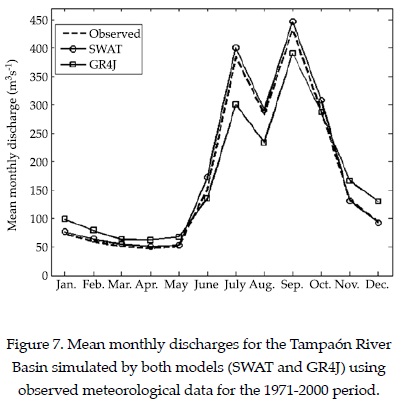
Figure 7 shows the mean monthly discharges as simulated by both hydrological models driven by observed meteorological data over the 1971-2000 period. The most accurate simulation of the mean monthly discharges is obtained using SWAT. GR4J overestimates the mean monthly discharges from November to May and underestimates the mean monthly discharges from June to September. However, both models successfully capture peak flows in July and September, and during the midsummer drought.
The performance analysis shows that models with different conceptualisation schemes have different strengths in simulating the catchment's streamflow. The simulation of low flows is challenging since water exchange occurs through the riverbed and the river may be fed by groundwater or may leak to feed the aquifer during the low flow period (Pushpalatha, Perrin, Le Moine, Mathevet, & Andréassian, 2011). On the other hand, the accurate simulation of high flows provides further confidence in the estimation of extreme hydrologic events, which is critical to the evaluation of risk in impact studies.
Future Changes of Precipitation and Temperature
This section presents an analysis of projected climate changes over the Tampaón River Basin. The predicted changes in precipitation and temperature in the future climate are determined by analysing differences between future (20402071) and reference (1971-2000) climates derived from bias-corrected CRCM simulations.
Figure 8 shows the mean monthly bias corrected climate for the reference period and projections for the future period in the three climatic regions over the catchment. Based on the chosen emission scenario, the largest changes in mean monthly precipitation are estimated during the wet season (June to September). For instance, in the dry temperate zone of the basin (e.g., climatic region 1), mean monthly precipitation during the wet season will vary from 55 mm month-1 to 37 mm month-1 (Figure 8a). For the same period, in the semi-humid, semi-warm zone of the basin (e.g., climatic region 2), precipitation is likely to decrease from 94 mm month-1 to 63 mm month-1 (Figure 8b). The most important change in mean monthly precipitation is estimated in the warm, humid zone of the basin (e.g., climatic region 3) with a decrease in mean monthly precipitation from 323 mm month-1 to 215 mm month-1 during the wet season (Figure 8c). The projected changes in mean monthly temperature are estimated to be very similar for the three climatic regions, with an increase in annual mean temperature of 2.8 °C (Figure 8d to 8f). However, the change between the reference and future periods is larger for maximum temperature (3.6 °C; not shown) than for minimum temperature (2 °C; not shown) in all climatic regions.
Projected climate change signals from the bias-corrected CRCM simulations over the entire Tampaón River Basin are summarized in Figure 9. Future mean monthly temperatures are estimated to differ significantly from the present time values, with an increase in mean temperature between 1.8 and 3.3 °C. The lowest temperature rise is found in winter (DJF) and the largest temperature increase is estimated to occur in summer (JJA). The results also show that in the future climate precipitation is very likely to increase from October to February and to decrease the rest of the year.

Climate Change Impacts on Streamflow
Projected climate change's potential impacts on hydrology are explored for the Tampaón River Basin. Climate-induced streamflow changes are inferred by analysing the differences produced by SWAT and GR4J when driven by future (2041-2070) and reference (1971-2000) climates derived from bias-corrected CRCM simulations (Figure 10). Based on the considered emission scenario, a significant decrease in mean monthly streamflow is estimated over the Tampaón River Basin as a result of both the increase in temperature (which leads to an increase in potential evapotranspiration) and the decrease in precipitation. Both models predict reduced peak flows in July and September, but the models predict different magnitudes. A decrease of 309 (286) m3 s-1 is simulated by GR4J in July (September), and of 191 (194) m3 s-1 by SWAT for the same period. In general, GR4J predicts larger streamflow changes than SWAT all year round.

The impact of hydrological climate change is further evaluated using three hydrologic indicators:
• Mean monthly streamflow (Qm): the mean of all daily values over a given month.
• Mean monthly high flow (HF): the mean of the maximum streamflow values for a given month.
• Mean monthly low flow (LF): the mean of the minimum streamflow values for a given month.
Climate change's impact on hydrologic indicators (ΔIsim) is expressed as the difference between simulated hydrologic indicators from the reference  to the future period
  .
.

Figure 11 presents the relative differences (DI) in the investigated indicators (Qm, HF and LF) over the Tampaón River Basin. GR4J predicts a larger decrease than SWAT in all indicators. For instance, the relative change in Qm ranges from about -30% to -52% during the dry season (i.e. December to May) and ranges from about -48% to -65% during the wet season (i.e. June to September) for SWAT and GR4J, respectively (Figure 11a). Similarly, the relative change in HF ranges from about -29% to -58% during the dry season and from about -47% to -70% during the wet season for SWAT and GR4J, respectively (Figure 11c). Finally, the relative change in LF ranges from about -31% to -46% during the dry season and from about -48% to -55% during the wet season for SWAT and GR4J, respectively (Figure 11e). Overall, the median relative differences in the indicators vary from -36% to -55% for Qm (Figure 11b), from -34% to -60% for HF (Figure 11 d), and from -36% to -49% for LF (Figure 11f). These results agree with those of Mendoza et al. (1997), which claim that the Pánuco River Basin is at risk of becoming a dry zone in the future.
The projected decrease in streamflow over the Tampaón River Basin due to changes in both temperature and precipitation could have a significant impact on water availability for economic activities and human consumption. Among the economic activities in the catchment that could be affected by water stress due to climate change, are the production of sugar, the production of citrus , livestock, industrial manufacturing and tourism (Sedue, 1986). In addition, the decrease in water availability could compromise the water supply of many cities in the region. For instance, San Luis Potosí, San Miguel de Allende and Celaya will draw water from the Santa Maria River (Peña, 2013; Conagua, 2012) and it is expected that Monterrey will be supplied by interbasin transfer from the Pánuco River Basin (SADM, 2012).
Conclusions
An analysis of the projected hydrological changes is presented for the Tampaón River Basin in East-Central Mexico. The selected hydrological models are differently conceptualized: SWAT is a physically-based semi-distribuited model and GR4J is a conceptual lumped model. The study's first step was to implement the hydrological models over the study catchment. Results show that SWAT produces the most accurate simulation of the observed monthly discharge. GR4J overestimates the mean monthly discharge from November to May and underestimates the mean monthly discharge from June to September.
The study's second step was to evaluate the impact of climate change on the Tampaón River Basin's streamflow. Both hydrological models estimate an important decrease in mean monthly streamflow as well as in high and low flow values for the 2041-2070 period compared with the baseline 1971-2000 period. In general, GR4J estimates larger streamflow changes than SWAT. This result highlights the need to consider the uncertainty associated with the hydrological models in hydrological climate change impact studies. This kind of uncertainty is related to the internal computation of hydrological processes, such as the estimation of the evapotranspiration, the soil hydrodynamic formulation and the snow model.
As SWAT has been successfully calibrated and validated over that catchment, the implementation of the model can be further extended to other regions to provide a regional analysis of the potential impact of climate change on water resources in Mexico.
The evaluation of climate change impacts on streamflow is generally made through a model chain that includes GCM outputs for a given emission scenario, often dynamically downscaled by a RCM and bias corrected with a statistical method before using them to a hydrological model. Each step of the model chain con-tributes to the total uncertainty in the estimation of future streamflows. The study of Graham, Hagemann, Jaun and Beniston (2007) found that the most important source of uncertainty comes from GCM forcing, which has a larger impact on the projected hydrological changes than other sources of uncertainty. Blöschl and Montanari (2010) pointed out that we can have reasonable confidence in predicting hydrological changes that are driven by air temperature, such as snowmelt, than those driven by precipitation, such as floods. Furthermore, Blöschl and Montanari (2010) argued that changing climatic conditions have different effects on both the weather and hydrology, depending on local features like topography, geomorphology and soils of the catchment. Therefore, future work should include additional sources of uncertainty, such as different GCMs outputs, emission and land use scenarios, in order to expand the analysis of the uncertainty in the hydrological impact studies (e.g., Velázquez & Troin, 2015).
Acknowledgments
This work was funded by the Natural Sciences and Engineering Research Council of Canada (NSERC) through partnerships with BC Hydro, Hydro-Québec, Rio Tinto Alcan, the Pacific Climate Impacts Consortium (PCIC), and the Ouranos Consortium. The CRCM simulations were generated and supplied by Ouranos.
References
Arnold, J. G., Srinivasan, R., Muttiah, R. S., & Williams, J. R. (1998). Large Area Hydrologic Modelling and Assessment-Part I: Model Development. Journal of the American Water Resources Association, 34, 73-89. [ Links ]
Arreguín-Cortés, F. I., & López-Pérez, M. (2013). Impacts of Climate Change on the Hydrological Cycle in Mexico. International Journal of Water Resources Development, 29(2), 172-183. [ Links ]
Bandas (2014). Banco Nacional de Datos de Aguas Superficiales [en línea]. Jiutepec, México: Instituto Mexicano de Tecnología del Agua [citado el 5 de septiembre de 2014]. Recuperado de https://www.imta.gob.mx/bandas.
Blöschl, G., & Montanari, A. (2010). Climate Change Impacts – Throwing the Dice? Hydrological Processes, 24, 374-381. [ Links ]
Braun, M., Caya, D., Frigon, A., & Slivitzky, M. (2012). Internal Variability of Canadian RCM's Hydrological Variables at the Basin Scale in Quebec and Labrador. Journal of Hydrometeorology, 13, 443-462. [ Links ]
Caya, D., & Laprise, R. (1999). A Semi-Implicit Semi-Lagrangian Regional Climate Model: The Canadian RCM. Monthly Weather Review, 127, 341-362. [ Links ]
CLICOM (2014). Base de Datos Climatológica Nacional [en línea]. Ensenada, México: Centro de Investigación Científica y de Educación Superior de Ensenada [citado el 25 de junio de 2014]. Recuperado de http://clicom-mex.cicese.mx. [ Links ]
Conagua (2012). Libro Blanco CONAGUA-08 Diseño, desarrollo de ingeniería y construcción de la presa de almacenamiento El Realito (123 pp.). México, DF: Comisión Nacional del Agua. [ Links ]
De Elía, R., & Côté, H. (2010). Climate and Climate Change Sensitivity to Model Configuration in the Canadian RCM over North America. Meteorologische Zeitschrift, 19(4), 325-339. [ Links ]
Graham, L. P., Hagemann, S., Jaun, S., & Beniston, M. (2007). On Interpreting Hydrological Change from Regional Climate Models. Climatic Change, 81, 97-122. [ Links ]
Ho, C. K., Stephenson, D. B., Collins, M., Ferro, C. A. T., & Brown, S. J. (2012). Calibration Strategies: A Source of Additional Uncertainty in Climate Change Projections. Bulletin of the American Meteorological Society, 93(1), 21-26. [ Links ]
IPCC (2014). Climate Change 2014: Impact, Adaptation and Vulnerability. Working Group II Contribution to the IPCC 5th Assessment Report. Final Draft Accepted 30 March 2014 [en línea]. Yokohama, Japan: Intergovernmental Panel on Climate Change [citado el 15 de octubre 2014]. Recuperado de http://ipcc-wg2.gov/AR5/. [ Links ]
Laprise, R., Caya, D., Frigon, A., & Paquin, D. (2003). Current and Perturbed Climate as Simulated by the Second-Generation Canadian Regional Climate Model (CRCM-II) over Northwestern North America. Climate Dynamics, 21, 405-21. [ Links ]
Maderey, L. E, Jiménez, A., & Carrillo, J. J. (2013). Global Climate Change and its Effect on Hydrological Resources of Mexico's Central Region. Scientific Annals of Alexandru Ioan Cuza, University of Iasi, 59(1), 59-78. [ Links ]
Magaña, V. O., & Conde, C. (2000). Climate and Freshwater Resources in Northern Mexico: Sonora, a Case Study. Environmental Monitoring and Assessment, 61(1), 167-185. [ Links ]
Martínez-Austria, P. F. (2007). Effects of Climate Change on Mexico's Water Ressources (76 pp.). Jiutepec, México: Instituto Mexicano de Tecnología del Agua. [ Links ]
Mendoza, V. M., Villanueva, E. E., & Adem, J. (1997). Vulnerability of Basins and Watersheds in Mexico to Global Change. Climate Research, 9, 139-145. [ Links ]
Morales, P. R., Magaña, V., Barrera, C. M., & Pérez, J. L. (2001). Efectos del calentamiento global en la disponibilidad de los recursos hidráulicos de México (151 pp.) México, DF: IMTA-CNA Proyecto HC 0112. [ Links ]
Mpelasoka, F. S., & Chiew, F. H. S. (2009). Influence of rainfall Scenario Construction Methods on Runoff Projections. Journal of Hydrometeorology, 10, 1168-1183. [ Links ]
Muerth, M. J., Gauvin-St-Denis, B., Ricard, S., Velázquez, J. A., Schmid, J., Minville, M., Caya, D., Chaumont, D., Ludwig, R., & Turcotte, R. (2013). On the Need for Bias Correction in Regional Climate Scenarios to Assess Climate Change Impacts on River Runoff. Hydrology and Earth System Sciences, 17, 1189-1204. [ Links ]
Mundo, M. D., & Martínez-Austria, P. (enero-abril, 1993). Cambio climático: posibles consecuencias y algunas sugerencias para disminuir su efecto en México. Ingeniería Hidráulica en México, 8(1), 14-28. [ Links ]
Nash, J. E., & Sutcliffe, J. V. (1970). River Flow Forecasting through Conceptual Models, Part 1 –A Discussion of Principles. Journal of Hydrology, 10(3), 282-290. [ Links ]
Neitsch, S. L., Arnold, J. G., Kiniry, J. R., & Williams, J. R. (2005). Soil and Water Assessment Tool, Theoretical Documentation (476 pp.). Texas: Blackland Research Center. [ Links ]
Neitsch, S. L., Arnold, J. G., Kiniry, J. R., Williams, J. R., & King, K. W. (2002). Soil and Water Assessment Tool Theoretical Documentation Version 2000 (458 pp.). Texas: Texas Water Resources Institutes. [ Links ]
Oudin, L., Hervieu, F., Michel, C., Perrin, C., Andreassian, V., Anctil, F., & Loumagne, C. (2005). Which Potential Evapotranspiration Input for a Lumped Rainfall-Runoff Model? Part 2 – Towards a Simple and Efficient Potential Evapotranspiration Model for Rainfall Runoff Modelling. Journal of Hydrology, 303(1), 290-306. [ Links ]
Peña, F. (2013). La sed urbana. La ciudad como construcción hidráulica (172 pp.). San Luis Potosí, México: El Colegio de San Luis, A.C. [ Links ]
Perrin, C. (2000). Vers une amélioration d'un modèle global pluie-débit au travers d'une approche comparative (530 pp.). PhD Thesis. Antony/Grenoble, France: Cemagref. [ Links ]
Perrin, C., Michel, C., & Andréassian, V. (2003). Improvement of a Parsimonious Model for Streamflow Simulation. Journal of Hydrology, 279(1-4), 275-289. [ Links ]
Plummer, D. A., Caya, D., Frigon, A., Côté, H., Giguère, M., Paquin, D., Biner, S., Harvey, R., & De Elía, R. (2006). Climate and Climate Change over North America as Simulated by the Canadian RCM. Journal of Climate, 19(13), 3112-3132. [ Links ]
Pushpalatha, R., Perrin, C., Le Moine, N., Mathevet, T., & Andréassian, V. (2011). A Downward Structural Sensitivity Analysis of Hydrological Models to Improve Low-Flow Simulation. Journal of Hydrology, 411(1-2), 66-76. [ Links ]
Refsgaard, J. C. (1996). Terminology, Modelling Protocol and Classification of Hydrological Model Code (chapter 2) (pp. 17-39). In M. B. Abbott & J. C. Refsgaard (Eds). Distributed Hydrological Modelling. Dordrecht, The Netherlands: Water Science and Technology Library, 22, Kluwer Academic Publishers. [ Links ]
Rivas-Acosta, I., Güitrón-De-Los-Reyes, A., & Ballinas-González, H. A. (2010). Vulnerabilidad hídrica global: aguas superficiales (capítulo 4) (pp. 81-113). In P. F. Martínez-Austria, & C. Patiño-Gómez (Eds.). Atlas de vulnerabilidad hídrica: efectos del cambio climático en los recursos hídricos de México. Jiutepec, México: Instituto Mexicano de Tecnología del Agua. [ Links ]
Robles-Morua, A., Che, D., Mayer, A. S., & Vivoni, E. R. (2015). Hydrological Assessment of Proposed Reservoirs in the Sonora River Basin, Mexico, under Historical and Future Climate Scenarios. Hydrological Sciences Journal, 60(1), 50-66. [ Links ]
SADM (2012). Manifestación de impacto ambiental modalidad regional para el proyecto Monterrey VI [en línea]. Monterrey, México: Servicio de Agua y Drenaje de Monterrey, I.P.D. Citado el 15 de julio de 2014. Recuperado de http://sinat.semarnat.gob.mx/dgiraDocs/documentos/nl/estudios/2012/19NL2012H0018.pdf. [ Links ]
Scinocca, J. F., Mcfarlane, N. A., Lazare, M., Li, J., & Plummer, D. (2008). The CCCma third generation AGCM and its extension into the middle atmosphere. Atmospheric Chemistry and Physics, 8, 7055-7074. [ Links ]
Sedue (1986). Estudio de calidad y clasificación del río Tampaón, San Luis Potosí y Querétaro (223 pp.). México, DF: Secretaría de Desarrollo Urbano y Ecología. [ Links ]
Tapia, E. M., Minjarez, I., & Espinoza, I. (2014). Use of Stella Software for the Modelling of Climate Change Impacts on Water Balance for the Yaqui Basin River, Sonora, Mexico. European Scientific Journal Edition, 10, 1857- 7431. [ Links ]
Teutschbein, C., Wetterhall, F., & Seibert, J. (2011). Evaluation of Different Downscaling Techniques for Hydrological Climate-Change Impact Studies at the Catchment Scale. Climate Dynamics, 37(9-10), 2087-2105. [ Links ]
Troin, M., Velázquez, J. A., Caya, D., & Brissette, F. (2015). Comparing Statistical Post-Processing of Regional and Global Climate Scenarios for Hydrological Impacts Assessment: A Case Study of Two Canadian Catchments. Journal of Hydrology, 520, 268-288. [ Links ]
Velázquez, J. A., Schmid, J., Ricard, S., Muerth, M. J., Gauvin St-Denis, B., Minville, M., Chaumont, D., Caya, D., Ludwig, R., & Turcotte, R. (2013). An Ensemble Approach to Assess Hydrological Models' Contribution to Uncertainties in the Analysis of Climate Change Impact on Water Resources. Hydrology and Earth System Sciences, 17, 565-578. [ Links ]
Velázquez, J. A., & Troin, M. (2015, in preparation). Evaluating the uncertainty of the impacts of climate change on the hydrology of two Mexican catchments. [ Links ]
Wilks, D. S. (2006). Statistical Methods in the Atmospheric Sciences (627 pp.) (2nd edición). Burlington, USA: Academic Press. [ Links ]

