


Services on Demand
Journal
Article
 English (pdf)
 Article in xml format
 Article references
 Send this article by e-mail
Indicators
-
 Cited by SciELO
 -
 Access statistics
Related links
-
 Similars in
SciELO
Similars in
SciELO
Share

 Permalink
Tecnología y ciencias del agua
On-line version ISSN 2007-2422
Tecnol. cienc. agua vol.5 n.1 Jiutepec Jan./Feb. 2014
Artículos técnicos
Spatial and temporal hydro-climatic variability in Durango, Mexico
Variabilidad hidroclimática espacial y temporal en Durango, México
José Návar*
Centro Interdisciplinario de Investigación para el Desarrollo Integral Regional del Instituto Politécnico Nacional, Durango, México.
*Autor de correspondencia.
Author, institutional address
José Návar, Ph.D.
Professor of Natural Resource Management
Centro Interdisciplinario de Investigación para el Desarrollo Integral Regional del Instituto Politécnico Nacional (CIIDIR–IPN), Unidad Durango
Sigma núm. 119, Fracc. 20 de Noviembre II
34220 Durango, Dgo., Mexico
Phone & fax: +52 (618) 8142 091
jnavar@ipn.mx
josedejesusnavar@yahoo.com.mx
Recibido: 27/03/12
Aceptado: 22/04/13
Abstract
This report presents information on the hydro-climate temporal and spatial variability for the State of Durango, Mexico. Annual rainfall data fitted the Gamma probabilistic density functions. The Gumbel-Fisher-Tipett density function fitted maximum daily precipitation. The log-Pearson Type III density function projected maximum annual discharge and daily maximum peakflows. Evapotranspiration was estimated by the Thornthwaite methodology. More than 80 climatic stations with data lasting longer than 30 years were used to fit probability density parameters. Geographical prediction equations; e.g. mean annual rainfall = α + β1 (Latitude) +β2 (Longitude) + β3 (Altitude) estimated the spatial variability of precipitation, temperature and evapotranspiration. Reconstructed and instrumental long-term (1860-2004) time series (precipitation and streamflow) data was temporally analyzed using ARIMA and linear and nonlinear regression techniques. Results showed mean annual temperature and evapotranspiration are spatially variable, diminishing with an increment in latitude and altitude. Mean annual precipitation on the other side increases with latitude and altitude but reduces with longitude. This trend was reversed for the Pacific Ocean physiographic region. Hydro-climatic data showed a lack of linear monotonic patterns indicating the time series are stationary in the first momentum. Oscillations of several time-scales: seasonal, inter-annual, 3-7 years; and 9-12-year were consistently noted on the modeled reconstructed and instrumental time series, spectral density analysis and correlograms for annual precipitation and streamflow data. Large-scale synoptic climate events such as the seasonal monsoon, the inter-annual variability, the El Niño Southern and the Pacific Decadal Oscillations appeared to explain temporal oscillations. Spatial variability was observed in hydro-climatic maps constructed using GIS techniques. This spatial and temporal information can be used in the decision making of water management resources at the local and State spatial scales; and in studies of productivity, forest wildfires, and floods of the State of Durango, Mexico.
Keywords: water resources, monsoonal effect, El Niño-Southern Oscillation, Pacific Decadal Oscillation, climatic variability, increased water use, raster and vectorial maps.
Resumen
Este reporte presenta información sobre la variabilidad temporal hidroclimática y espacial para el estado de Durango, México. Datos de precipitación anual se ajustaron a las funciones de densidad de probabilidad gamma. La función de densidad de Gumbel- Fisher-Tipett proyectó la precipitación diaria máxima. La función de densidad log-Pearson Tipo III simuló la descarga anual máxima y los caudales máximos diarios. La evapotranspiración se estimó mediante la metodología de Thornthwaite. Más de 80 estaciones climatológicas con datos de más de 30 años se utilizaron para ajustar los parámetros de las funciones de densidad probabilística. Ecuaciones geográficas, por ejemplo, precipitación media anual = α + 1 (latitud) + β2 (longitud) + β3 (altitud) estimaron la variabilidad espacial de la precipitación, temperatura y evapotranspiración. Datos de series de tiempo reconstruidos con técnicas dendrocronológicas a largo plazo (1860-2004) de precipitaciones y caudales se analizaron mediante técnicas de regresión lineales y no lineales, y por medio de modelos ARIMA. Los resultados mostraron que la temperatura y la evapotranspiración promedio anual son variables que disminuyen con un incremento en la latitud y altitud. La precipitación media anual, por otro lado, aumenta con la latitud y la altitud, pero se reduce con la longitud. Esta tendencia se invirtió en la región fisiográfica del océano Pacífico. Los datos hidroclimáticos mostraron una falta de patrones monótonos lineales, lo que indica que las series de tiempo son estacionarias en el primer momento. Oscilaciones de varias escalas de tiempo: estacionales, interanuales, 3-7 años, y de 9 a 12 años se observaron consistentemente en las series de tiempo reconstruidas e instrumentales, el análisis de densidad espectral y los correlogramas para los datos de la precipitación anual y del caudal. Eventos climáticos sinópticos de gran escala, tales como los monzones estacionales, la variabilidad interanual, El Niño–Oscilación del Sur y La Oscilación Decadal del Pacífico parecían explicar las variaciones temporales. Se observó variabilidad hidroclimática espacial en mapas construidos utilizando técnicas SIG. Esta información espacial y temporal puede ser utilizada en la toma de decisiones en la gestión de los recursos del agua a las escalas espaciales locales y estatales, y en los estudios de productividad, los incendios forestales y las inundaciones del estado de Durango, México.
Palabras clave: recursos hídricos, el efecto del monzón, El Niño-Oscilación del Sur, Oscilación Decadal del Pacífico, variabilidad climática, aumento de consumo de agua, mapas tipo ráster y vectoriales.
Introduction
The diminishing of water resources by an increasing population, agriculture and industry; the impairment by pollution; and the erratic but consistent shortages by drought spells are issues society is currently and will be certainly facing during the next 50 years (Shiklomanov and Rodda, 2003; Postel and Wolf, 2001; Vorosmarty et al., 2000; Návar-Cháidez, 2011; Návar, 2012). Other current problems are due to: mismanagement, expansion of urban areas, economic development and poor decisions on water issues (CSIS, 2005). Therefore, in most of the arid and semi arid world or in places with a well defined wet-dry season there is currently a deficit between supply and demand that is critical for development.
In general, Mexico's northern regions and in particular the State of Durango lies within the boreal hemisphere belt of arid and semi arid lands. Rivers of the state are currently running dry in several stretches due to the prolonged drought spell of the 2010's, in addition to river flow allocations to irrigated agriculture, industry, and public sectors. Groundwater is being heavily depleted resulting from increasing water demands and unsustainable development. At the present, in the region of Durango four aquifers are classified as over-drained (FAO, 2005). Moreover, drought spells of several temporal frequencies are further increasing water scarcity in the region (Návar, 2012); e.g. the present inter-annual drought episode that is striking northern Mexico is one of the most acute ever recorded over the last 90 years (CNA, 2011).
In spite of the long-term availability of fresh renewable per-capita water resources in the State of Durango, Mexico, they are highly variable in space and time. The state has a range of discharge values between 13,000 to 15,000 M m3 (11 800 M m3 as surface flow and between 1 000 and 3 000 M m3 as aquifer discharge) per 1.5 M inhabitants, which translates to close to 10 000 m3 per inhabitant per year (Návar, 2008). This figure is well above the Mexican present mean, which is close to 4 500-5 000 m3 per inhabitant per year. However, the eastern portion of the State is arid and semi-arid with per-capita water resources well below the national average, with a figure that compares with that of the poorest Middle East countries. Drought spells of different magnitudes and durations reduce per-capita availability by more than one order of magnitude. The upper ridges of the Sierra Madre Occidental mountain range, on the other hand, have the largest per-capita water availability.
In arid, semi-arid, sub-tropical, and tropical lands with a well defined dry season, Postel (2000) and CSIS (2005) stressed the need for the implementation of sustainable management practices of water resources to cope with spatial and temporal chronic water scarcity. Despite of these recommendations, there is a consistent lack of information publically available for the development and implementation of hydrologic projects. Since spatial and temporal information on water resources are required to better understand potential inherent sources of variability, geographic information system, GIS, coupled with statistical analysis of hydro-climatic variables are necessary for the display, management and forecasting of hydro-climatic data. This information is useful to take the appropriate measures during the presence of drought spells in places with consistent water shortages.
In this paper, hydro-climatic information was statistically analyzed and compiled into a GIS system for the sustainable management of water resources of the State of Durango, Mexico with the aim to manage water resources for the well being of present and future generations. The aim of this research was: a) to geographically analyze hydro-climate variables by fitting equations between precipitation, temperature, and evpotranspiration and coordinates (latitude and longitude) as well as altitude above sea level; b) to fit several density distribution functions, c) to statistically analyze whether hydro-climate (precipitation and river discharge) data shows consistent temporal trends and oscillations that could be related to climate change and/or variability; and d) to discuss sources of inherent hydro-climatic pulses and oscillations. The intrinsic null hypothesis was that hydro-climate variables do not present spatial or temporal variability in the state of Durango, Mexico. The spatial variability was tested by developing geographical equations to predict hydro-climate variables. The temporal variability was evaluated by fitting autoregressive integrated moving average, ARIMA, models as well as linear regression equations to statistically analyze by monotonic trends in the first momentum.
Materials and methods
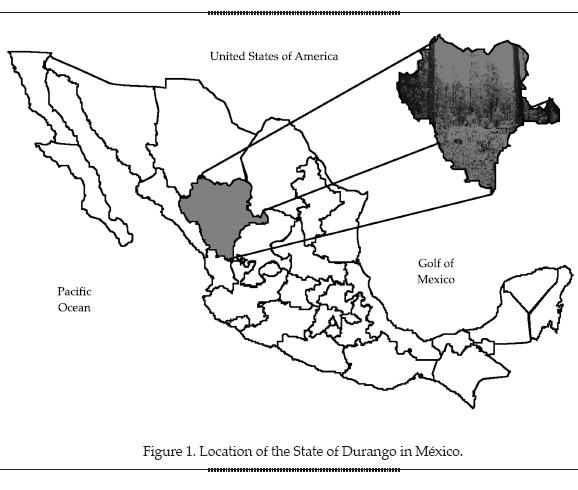
Location of the study area
The State of Durango is located in Mexico's north-central portion covering an area of approximately 12.3 M ha (figure 1). It spans 22º 35' NL and 104º 50' WL; 24º 44' NL and 22º 58' WL; 26º 83' NL and 104º 27' WL, and 23º 52' NL and 107º 21' WL. It neighbors the States of Chihuahua and Coahuila to the north and east; Coahuila and Zacatecas to the east, Zacatecas and Nayarit to the south and Sinaloa and Nayarit to the west. Four main physiographic regions characterize the State; a) the western Plains of the Pacific Ocean, b) the Sierra Madre Occidental mountain range, c) the central valleys of Durango and Chihuahua, and d) the Chihuahuan Desert.
Methods
Instrumental climatic data for over 80 stations was available for the period of 1940-2004. Of these, 65 climatic stations are placed within the State of Durango and the rest within the State of Sinaloa, Mexico. In addition, daily discharge data was available for over 30 gauging stations placed most of them within the State and several of them just immediately outside the State of Durango.
Annual rainfall depth
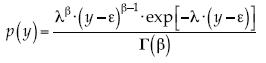
Annual rainfall data fited the gamma density function with the aim to estimate annual precipitation depth with probabilities of 20, 50 and 80%. The probabilistic density function that describes the gamma equation is given by the following model (Haan, 2002):
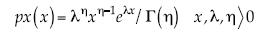
Where x is the random variable of interest; e is the exponential mathematical function, λ; η are the shape and scale parameters of the pdf; Γ(η) is the gamma function and it has the following properties:
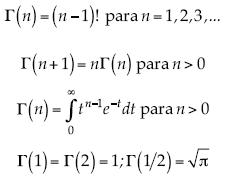
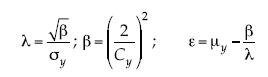
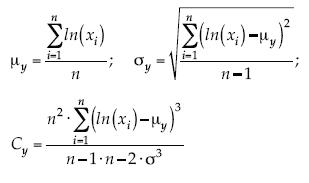
In order to fit this probabilistic density function it is necessary to estimate the shape and scale parameter values. They are quite frequently evaluated using the maximum likelihood solution technique of Greenwood and Durand (1975) coupled with a correction factor with the use of the following equations:
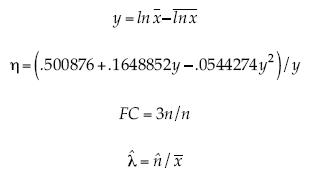
Where ln is the natural logarithm, x is the random variable of interest, e.g. monthly precipitation; λ and η are the shape and scale parameters of the pdf; FC = correction factor.
Rainfall depth-duration-frequency curves
The Gumbel-Fisher-Tippet density function calculated rainfall depth for a 24-hour duration for the frequencies of 1, 2, 5, 10, 15, 25, 50 y 100 years. The pdf of the Extreme Value Type I is given by the next model (Haan, 2002):
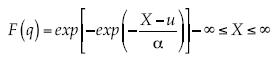
Where u and α are parameters of the pdf; x is the random variable of interest, e.g., maximum annual rainfall for a 24-hour duration; exp is the exponential mathematical function. The parameters of this pdf are estimated as follows:
 ; where Sx is the Standard deviation of the random variable.
u = mx – 0.5772α; where mx is the mean of the random variable.
The average annual number of days with measurable precipitation was also calculated for each of approximately 80 climatic stations.
Potential evapotranspiration
Annual potential evapotranspiration was preliminarily estimated using the Thornthwaite methodology. The empirical model developed by Thornthwaite to estimate potential evaporanspiration is given by the following equation, as follows (Dunne and Leopold, 1978):
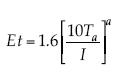
Where Et = potential evapotranspiration (cm); Ta = mean air temperature (°C); I = annual heat index =  , and a = 0.49 + 0.0179 I - 0.0000771 I2 + 0.000000675 I3.
Base flow and direct flow
Daily base flow and direct flow were separated using the RORA software (Rutledge, 1998) for 33 gauging stations. Daily discharge data recorded in all gauging stations are reported in the BANDAS program.
Maximum hydrologic values
Daily peak flows were also estimated for several probabilities of occurrence using the Log Pearson Type III density function. The Log Pearson Type III pdf has been widely recommended for these purposes (USGS, 2002). The pdf for this model is given by the next equation, as follows:
The equations that solve for the parameters of the Log Pearson pdf by the moments methodology are the following:
Where:
This set of equations is solved simultaneously with the aid of computer programs.
Reconstructed annual precipitation and discharge data
Annual precipitation and discharge data were related to the annual radial increment of trees used typically in dendrochronological analysis. The dendrochronologies of Banderas, Las Bayas and El Gato reported by González-Elizondo et al. (2005) were used to relate the radial increment of trees to annual precipitation and discharge. Hence, regression equations reconstructed climate and discharge parameters beyond instrumental records using the past radial increment of trees (Stahle et al., 1999). In general hydrologic data was reconstructed back to 1860. That is, the reconstructed and instrumental time series dates from 1860 to 2004.
Testing for monotonic trends
In this report, for the variables annual precipitation and discharge, it is assumed that linear monotonic patterns coupled with oscillations are indications of climate change and variability, respectively. That is, should annual precipitation or discharge be controlled by climate change, the time series data must not be stationary in the first momentum. Hence, a simple linear regression equation (e.g., P = a ± Bt) tests for the time series stationarity by setting the null hypothesis that B = 0. Second degree polynomial equations, e.g., quadratic patterns may be better indicators of climate variability. The argument against the null hypothesis could be that any linear or quadratic pattern is part of longer time scale climate variability. However, at this time for instrumental and reconstructed records there is no other statistical technique available for isolating the effects of climate change and climate variability on hydro-climatic variables. ARIMA models with linear and quadratic tendencies fitted the smoothed and raw data series, respectively. In order to look more closely to long term tendencies, first and second degree polynomial equations were fitted to the raw reconstructed and instrumental data (1860-2000). In addition, spectral density analysis and partial auto-correlogram functions improved our understanding on cycles and patterns of precipitation and discharge to be associated to climate variability, climate change for the management of natural resources.
Geographical information system
Hydrologic maps were developed using annual and monthly rainfall, temperature, evapotranspiration, rainfall depth for 24-hour duration for several frequencies by predicting the spatial distribution of these values using the latitude and longitude coordinates and altitude as independent variables. A set of prediction equations are preliminarily reported in this paper as the main input in future updating maps to spatially display this information.
Results
Geographical models
The spatial hydro-climatic variability was observed in GIS maps. Examples of the geographic models developed to predict hydro-climatic variables are reported in Table 1. Prediction equations were divided in two sets since the Sierra Madre Occidental mountain range divides the state in two major climatic provinces; the Pacific Ocean and the Central Valleys including the Chihuahuan Desert, each one with a unique set of climatic gradients.
Geographic maps at the state scale showed large variability, which was partially reduced by climatically dividing the state into two physiographic regions, where the upper ridges of the Sierra Madre Occidental mountain range are both the continental and the hydro-climatic divide. For the interior physiographic region, Et and temperature diminish with latitude and altitude but increase with longitude. The thermal gradient is 1.1 °C per each 1 000 meters, diminishing from the Chihuahuan Desert to the upper ridges of the SMW mountain range. All precipitation variables increase with latitude and altitude but diminish with longitude. That is, the interior northwestern upland watersheds are wetter in the upper ridges of the SMW mountain ranges.
For the Pacific Ocean physiographic region, Et and temperature diminish with longitude and altitude but increases with latitude. The average thermal gradient is 6 °C per each 1000 m; diminishing from the Pacific Ocean coasts to the upper ridges of the Sierra Madre Occidental mountain ranges by close to 12 °C. All precipitation variables increase with longitude and altitude but diminish with latitude. That is, the wettest range is located in upland, upper ridges of the southeastern watersheds of the State of Durango.
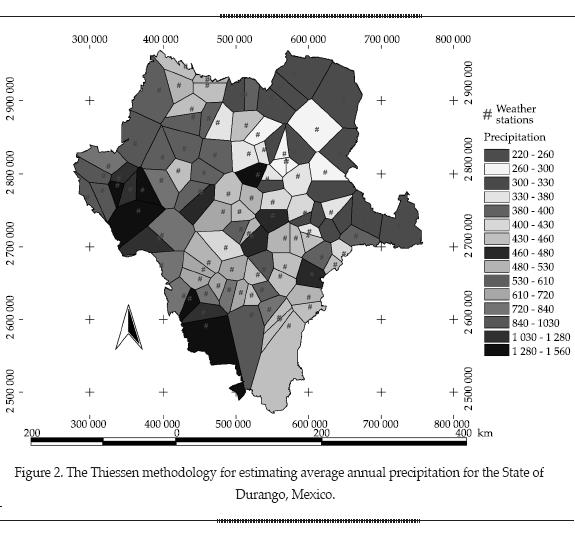
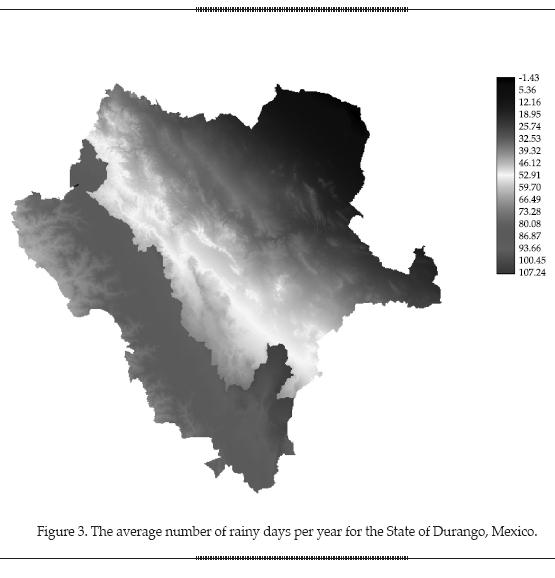
Mean annual precipitation is 645, 583, and 575 mm when evaluated by the arithmetic, Thiessen polygons (figure 2) and the isohyets methodologies, respectively. Summer monsoonal precipitation is typical in the region since more than 65% of the annual rainfall is restricted to the period of July to September. The number of days with measurable precipitation is on the average 64 (± 4) but it increases to 94 (± 12) in the SMW mountain range and diminishes to 46 (± 9) in the Chihuahuan Desert (figure 3). The average number of rainy days for the state of Durango, Mexico is depicted in figure 3.
Raw annual precipitation, smoothed moving average data and fitted ARIMA models are depicted in figures 4, 5 and 6. Although annual precipitation is monotonically diminishing in the Plains of the Pacific ocean, the Sierra Madre Occidental mountain range and the Central Valleys of Durango, with the exception of the Chihuahuan Desert (figures 4, 5, and 6), the first degree polynomial equations do not have statistical significance. That is, the time series are stationary in their first momentum. Second degree polynomial equations better fitted annual precipitation for the climatic stations Fco. I. Madero, Guanaceví, Rosario, and Potrerillos. The tendencies are to reduce (Fco. I. Madero, Rosario, and Potrerillos) and to increase (Guanaceví) showing the lack of consistent climate change effects on annual precipitation and appearing non-significant monotonic changes are most likely due to longer time scale climatic variability. That is, climate variability appears to be the rule when explaining the quadratic trends since they are contrasting for these climatic stations.
The ARIMA models consistently had one single auto-regressive parameter for reconstructed and instrumental annual precipitation for most climatic stations with the exception of those placed in or close to the Chihuahuan Desert (Cuencamé, San Juan de Gudalupe, Simón Bolívar, Francisco I. Madero, Guanaceví, Tepehuanes) that required two autoregressive parameters to explain over 50% of the total annual precipitation variability.
Annual precipitation is hence more variable in the Chihuahuan Desert and the Central Valleys of Durango and Chihuahua and least variable in the Sierra Madre Occidental mountain range and the Pacific Ocean physiographic regions.
ARIMA models with a single auto-regressive parameter are sufficient to predict the smoothed annual time series. Forecasts project cycles in a different time domain but spectral density analysis indicate the time series show peaks in the frequency bands of 2-yr; 3-6-yr; and 9-11yr cycles, respectively (figure 7). These cycles are consistent across physiographic regions indicating the similitude of large synoptic events controlling regional climate variability across physiographic regions.
The climatic stations Francisco I. Madero and Guanaceví (East Leeside) and Potrerillos, and Rosario (West ward side) present statistical significance on the fitted second degree polynomial equations. However, none of the climatic stations analyzed present statistical significance on the first degree polinomial equation. That is, oscillations larger than 70 years appear to explain the quadratic equations with statistical significance. In USA, Knight et al. (2006) linked this long-term variability to the Atlantic Multidecadal Oscillation. The potential climate change monotonic effect on annual precipitation is missing from this analysis, since the first momentum of the time series changes in a quadratic fashion.
The ARIMA models for the reconstructed time series and the instrumental recorded annual precipitations depict four major drought episodes can be noted during the last century; a) in the 1900's, b) in the 1920's, c) in the 1950's, and d) in the 1990's; with an intermediate dry spell of a shorter duration in the 1980's.
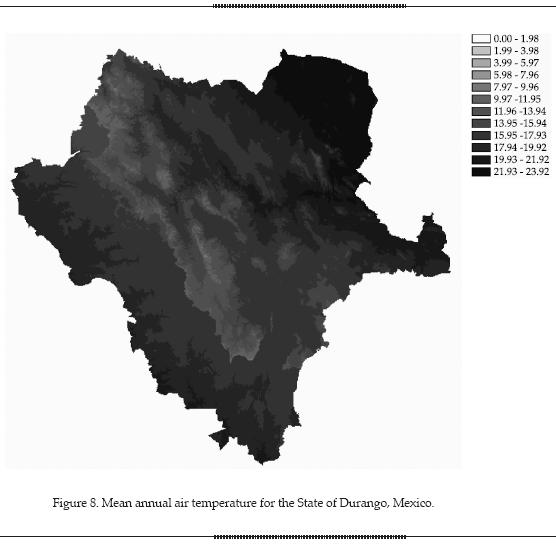
Arithmetic air temperature has a mean (± confidence intervals) value of 17.3 °C (± 0.9 °C). It increases to 19 °C in the Chihuahuan Desert and the Pacific Ocean physiographic regions but diminishes to 13.2 °C in the Sierra Madre Occidental mountain range (figure 8).
The thermal gradient approximates to 0.11 °C and to 0.60 °C per every 100 m in altitude above sea level in the Pacific Ocean and the Chihuahuan Desert to the upper ridges of the Sierra Madre Occidental mountain range, respectively. The difference in both gradients is explained by the local effect of the Pacific Ocean on temperature of the western lowlands of the Sierra Madre Occidental mountain range.
The temporal variations for mean annual temperature for three physiographic regions of the state of Durango, Mexico are reported in figure 9.
The mean annual temperatures are not transiently changing for the SMW province (maximum with p = 0.43, mean with p = 0.11, minimum with p = 0.83). That is, the monotonic tendencies are absent showing mean annual temperature time series are stationary as well in this physiographic region. That is, the effect of climate change on mean annual temperature is missing. For the Pacific Ocean province, mean annual temperature is decreasing with statistical significance (p = 0.0001) although this observation requires additional evidence before it can be further discussed as one climatic station was relocated back in the 1990's. For the Chihuahuan Desert, mean annual maximum temperature is statistically increasing (p = 0.009), mean annual temperature is also increasing (p = 0.001) but the mean minimum is not significantly changing (p = 0.99).
River discharge
The annual discharge has mean and confidence interval values of 583 Mm3 and 220 Mm3, respectively according to river flow data for 25 gauging stations placed in the State. The long-term variation is close to 50% of the annual mean discharge stressing the effect of droughts and the presence of hurricanes or cyclones. It is clear that rivers draining into the Pacific Ocean produce the largest and rivers draining into the interior Chihuahuan Desert produce the smallest annual discharges (table 2).
Gauging stations placed in rivers draining into the Pacific Ocean produce the largest and gauging stations placed on rivers discharging into the interior basins on the Chihuahuan Desert produce the smallest daily peak flows for most probabilities (table 3).
Hydrograph separation analysis using daily discharge data indicate base flow and direct flow account on the average for 36 and 64%, respectively, for 17 gauging stations (table 4). Low base flow figures are the result of shallow perturbed soils and erratic and intense rainfall events. Durango is a State with the largest and smallest rains since more than 65% of the annual rainfall is composed of small-depth rains that do not produce significant runoff and the remaining 35% is composed of rains that produce both aquifer recharge and surface runoff.
Discharge data is not monotonically diminishing over time for most gauging stations of the State of Durango (figures 10 and 11). The time series are stationary in the first momentum missing the effect of climate change on stream flow-producing variables. In fact, the tendency of annual discharge is highly erratic due to the presence-absence of runoff-promoting rains such as cyclones, hurricanes, tropical depressions and high un-seasonal precipitation events in the area that masks any potential climate-change control over this variable. Several human-induced practices that control river discharge such as the construction of dams & reservoirs; land use changes and overgrazing practices; increasing withdrawal of water resources from aquifers and rivers, and other sources of inherent climate variability are variables operating over time as well.
Fitted ARIMA models explain a little over 50% of the smoothed (t = 3 yr) annual discharge data and these stochastic models include consistently two auto-regressive parameters for most gauging stations showing annual discharge is more variable than annual precipitation for the state of Durango, Mexico. The first auto-regressive (Lag 1) parameter is positive demonstrating the potential two-year effect of annual variability of high rains and drought spells on annual discharge in the area. However, the second (Lag 2) is negative showing that annual discharge restores to its previous conditions after the presence of interannual drought spells or inter-annual high discharge rates.
Annual discharge cycles of 2-3-year; 4-6-year, and 9-10-year are also noted on the time series (1860-2004), correlograms, spectral density analysis and ARIMA models. Similar cycles were described earlier for annual precipitation.
Discussion
Mexican climate spans from the dry conditions of the northwestern Sonoran Desert where annual average rainfall is less than 100 mm to the wet tropical climates that characterize the forest regions of southern Mexico, where average annual rainfall can reach over 2000 mm (Livermann, 1999). The State of Durango lies right in the center of this hydro-climatic gradient. This strong rainfall gradient originates in latitudinal belts of atmospheric circulation, which shift seasonally. The westerlies bring precipitation to northern Mexico in winter (Cavazos and Hastenrath, 1990). The subtropical highs associated with stable conditions and the inter-tropical convergence zone and trade winds deliver summer rainfall to the central and southern regions of the country. Other key influences on precipitation are the fall hurricanes on both the Caribbean and Pacific coasts, the summer monsoons in the north, and the summer high pressure that disrupts the flow of moist air and creates a period of dry conditions known as midsummer drought. The mountains and varied topography of Mexico dominates other climatic influences.
Most of the State of Durango, Mexico with the exception of the eastern-most tip lies within the region called the monsoon region, which stretches along the Sierra Madre Occidental in north western Mexico and follows the continental divide through eastern Arizona, most of New Mexico and extends into southern Colorado in the United States (Comrie and Glenn, 1998). This area is characterized by the strong mid to late summer precipitation maximum with considerable less precipitation during the rest of the year. The narrow southern boundary of the monsoon region most likely blends into the inter-tropical convergence zone, ITCZ, related rainfall of central and southern Mexico. Storms causing precipitation during the winter come from the west and progress north to south while summer precipitation tends to progress south to north as a true monsoon system (Dettinger et al., 1998; Higgins et al., 1999). However, the area controlled by the monsoon is highly erratic and partially responsible for the seasonal and potentially the inter-annual oscillations in precipitation and discharge in watersheds of the State of Durango, Mexico.
Several climatic trends and oscillations contributing to the monsoonal variability are: the El Niño- Southern Oscillation, ENSO, the Pacific Decadal Oscillation, PDO, the North Atlantic Oscillation, NAO, and the Little Ice Age. Reconstructed precipitation for Durango, Mexico using dendrochronological analysis (1380-2000) showed the tropical rainfall index (TRI) correlates well with instrumental and reconstructed winter precipitation (r = 0.49 and 0.55, respectively), reflecting the strong ENSO modulation of cool season climate over northern Mexico (Cleaveland et al., 2003). ENSO and PDO indices were statistically associated with long term hydro-climatic variability over The Sierra Madre Occidental mountain range (Návar, 2012). Due to the lack of long term information, the NAO and Little Ice Ages have not been tele-connected with hydro-climate variability in the region. Long term studies stress that climate is more variable over northern Mexico due to all the sources and interactions of variability described above. Hence, northern and southern Mexico often show opposite climate signals. Lake sediment analysis from central Mexico showed that Late Pleistocene-Holocene wet climate conditions prevailed about 6 000 yr BP, with large oscillations between 6 000 and 5000 yr BP and a period of marked aridity in Central Mexico about 1 000 yr BP (Metcalfe et al., 2000).
The El Niño/Southern Oscillation, the PDO, the NAO, and the Little Ice Ages have been previously tele-connected with the monsoon variability (Cavazos and Hastenrath, 1990). However, to physically elucidate in more detail the potential controlling mechanisms of the monsoonal variability, the role of the Hadley circulation and the function of the inter-tropical convergence zone in the shape and strength of the subtropical circulation over the region, among others must be further studied (Comrie and Glenn, 1998). Cavazos and Hastenrath (1990), and Woodhouse (1997) discussed also how the subtropical anticyclones and associated upper-level ridges centered over the region and adjacent Atlantic and Pacific oceans exert a dominant influence year-round, modulated by the role of the mid-latitude westerly circulation in winter and the North American monsoon in summer.
The monotonic climate change effect is missing because of the stationarity of the time series, although modeling the effect of climate change on river flow and precipitation by the IPCC (2007) forecasts northern Mexico is supposedly to reduce discharge and precipitation by 0-25% with global warming. Villers-Ruiz and Trejo-Vázquez (1997) also modeled the expansion of dry climates and consequently discharge on most Mexican ecosystems by climate change. Mulholland et al. (1997) and the IPCC (2007), using general circulation models, predicted northern Mexico, in particular the lower Rio Bravo/Rio Grande belt, would receive 10% less rainfall with increasing temperatures by global warming. Further information in the near future would shed light on the potential effect of climate change on hydro-climate variability in the studied region.
Other causes of discharge variability are the spatio-temporal abstraction of water resources directly from rivers and aquifers for irrigation of an expanding agriculture, population, and industry of the State of Durango. The mismanagement of natural resources, in specific plant and soil resources leading to soil compaction and reduction of plant cover appears to play also a role in diminishing discharge over time since several springs are seeing reduced baseflows in the region.
Conclusions
Hydro-climate is highly variable in the State of Durango, Mexico since most of the State is found within the region of monsoonal activity. This climate is characterized by erratic oscillations that have been associated with seasonal, inter-annual, ENSO, and PDO variability and potentially by NAO and Little Ice Ages as well. The role of the Hadley circulation, the intertropical convergence zone, the migration of the subtropical anticyclones and associated upper-level ridges, modulated by the role of the mid-latitude westerly circulation appear to exert a strong influence on hydro-climate variability in winter and the North American monsoon in summer. To preliminarily cope with this large variability, the sustainable management of water resources is an alternate practice that can meet economic growth, social stability and environmental compatibility and must be implemented to comply with the well being of present and future generations. Other projects aiming to increase water availability in the region are welcomed.
Acknowledgments
The author of this report wishes to thank the SIP fund for providing a grant through project 2011. GIS maps were drawn by Dr. Armando Cortes. The author is a COFAA scholar.
References
CAVAZOS, T. and HASTENRATH, S. Convection and rainfall over Mexico and their modulation by the Southern Oscillation. J. Climatol. Vol. 10, 1990, pp. 377-386. [ Links ]
CLEAVELAND, M.K., STAHLE, D.W., THERRELL, M.D., VILLANUEVA-DÍAZ, J., and BURNS, B.T. Treering reconstructed winter precipitation and tropical teleconnections in Durango, Mexico. Climate Change. Vol. 59, 2003, pp. 369-388. [ Links ]
COMRIE, A.C. and GLENN, E.C. Principal components-based regionalization of precipitation regimes across the southwest United States and northern Mexico, with application to monsoon precipitation. Climate Research. Vol. 10, 1998, pp. 201-215. [ Links ]
CSIS. Center for International and Strategic Studies. Addressing our Global Water Future. New Mexico, USA: Sandia National Laboratories, 2005. [ Links ]
DETTINGER, M.D., CAYAN, D.R., DIAZ, H.F., and MEKO, D.M. North-south precipitation patterns in western North America on interannual-to-decadal timescales. Journal of Climate. Vol. 11, 1998, pp. 3095-3111. [ Links ]
FAO. Aquifers under threat. Rome: Food and Agriculture Organization, 2005. [ Links ]
GREENWOOD, J.A. and DURAND, D. Aids for fitting the gamma distribution by maximum likelihood. Technometrics. Vol. 2, No, 1, 1975, pp. 55-65. [ Links ]
GONZÁLEZ-ELIZONDO, M., JURADO, E., NÁVAR, J., GONZÁLEZ-ELIZONDO, S., VILLANUEVA, J., AGUIRRE, O.A., and JIMÉNEZ, P.J. Tree rings and climate association for five chronologies of Douglas fir from Durango and Zacatecas, México. Forest Ecology and Management. Vol. 213, 2005, pp. 39-53. [ Links ]
HAAN, C.T. Stochastic Models in Hydrology. Second edition. Iowa: Iowa State University Press, 2002, 450 pp. [ Links ]
HIGGINS, R.W., CHEN, Y., and DOUGLAS, A.V. Interannual variability of the North American warm season precipitation regime. Journal of Climate. Vol. 12, 1999, pp. 653-680. [ Links ]
IPCC. Intergovernmental Panel on Climate Change. Impacts, adaptation, and vulnerability. Summary for Policy Makers. Cambridge, UK: Cambridge University Press, 2007, 17 pp. [ Links ]
KNIGHT, J.R., FOLLAND, C.K., and SCAIFE, A.A. Climate impacts of the Atlantic Multidecadal Oscillation. Geophysical Research Letters. Vol. 33, LI7706, 2006, doi: 10.1029/2006GL026242. [ Links ]
LIVERMANN, D.M. Vulnerability and adaptation to drought in Mexico. Natural Resources Journal. Vol. 99, 1999, pp. 1-35. [ Links ]
METCALFE, S.E., O'HARA, S.L., CABALLERO, M., and DAVIES, S.L. Records of late Pleistocene-Holocene climate change in Mexico – a review. Quaternary Science Reviews. Vol. 19, 2000, pp. 699-721. [ Links ]
MULHOLLAND, P.J., BEST, G.R., COUTANT, C.C., HORNBERGER, G.M., MEYER, J.L., ROBINSON, P.J., STENBERG, J.R., TURNER, R.E., VERA-HERRERA, F., and R.G. WETZEL. Effects of climate change on freshwater ecosystems of the Southeastern United States and Gulf of Mexico. Hydrological Processes. Vol. 11, 1997, pp. 949-970. [ Links ]
NÁVAR, J. Atlas Hidrológico del Estado de Durango. Inédito. 2008, 220 pp. [ Links ]
NÁVAR-CHÁIDEZ, J.J. Water scarcity and degradation in the Rio San Juan watershed of northeastern Mexico. Frontera Norte. Vol. 23, No. 46, 2011, pp. 125-150. [ Links ]
NÁVAR, J. Modeling annual discharge for six Mexico's northern subtropical rivers. Ambiente & Agua. An Interdisciplinary Journal. Vol. 7, 2012, pp. 36-50, doi:10.4136/1980-993X. [ Links ]
POSTEL, L.S. Entering an era of water scarcity: the challenges ahead. Ecological Applications. Vol. 10, No. 4, 2000, pp. 941-948. [ Links ]
POSTEL, S. and WOLF, A.T. Dehydrating conflict. Foreign Policy. September/October, 2001, pp. 2-9. [ Links ]
RUTLEDGE, A.T. Computer programs for describing the recession of ground-water discharge and for estimating mean ground-water recharge and discharge from streamflow data - Update: U.S. Geological Survey Water-Resources Investigations Report. Vol. 98, No. 4148, 1998, 43 pp. [ Links ]
SHIKLOMANOV, I.A. and RODDA, J. World Water Resources at the Beginning of the 21st Century. Paris: UNESCO, 2003. [ Links ]
STAHLE, D.W., CLEAVELAND, M.K., THERRELL, M.D., and VILLANUEVA-DÍAZ, J. Tree ring reconstruction of winter and summer precipitation in Durango, Mexico, for the past 600 years. 10th Symp Global Change Studies, American Meteorological Society. Dallas, 1999, pp. 205-211. [ Links ]
USGS. 2002, http://pubs.usgs.gov/of/2007/1033/pdf/Appendix3_web.pdf
VILLERS-RUIZ, L. and TREJO-VÁZQUEZ, I. Assessment of the vulnerability of forest ecosystems to climate change in Mexico. Climate Research. Vol. 9, 1997, pp. 87-93. [ Links ]
VOROSMARTY, C.J., GREEN, P., SALISBURY, J., and LAMMERS, R.B. Global water resources: vulnerability from climate change and population growth. Science. Vol. 289, No. 5477, 2000, pp. 284-288. [ Links ]
WOODHOUSE, C.A. Winter climate and atmospheric circulation patterns in the Sonoran Desert Region. USA. Int J. Climatol. 17, 1997, pp. 859-873. [ Links ]

