


Servicios Personalizados
Revista
Articulo
 texto en
  Inglés (pdf)
 Artículo en XML
 Referencias del artículo
 Enviar artículo por email
Indicadores
-
 Citado por SciELO
 -
 Accesos
Links relacionados
-
 Similares en
SciELO
Similares en
SciELO
Compartir

 Permalink
Revista mexicana de ciencias forestales
versión impresa ISSN 2007-1132
Rev. mex. de cienc. forestales vol.14 no.76 México mar./abr. 2023 Epub 19-Jun-2023
https://doi.org/10.29298/rmcf.v14i76.1298
Scientific article
Projective foliar cover and species richness of vascular plants in the State of Mexico
1
 http://orcid.org/0000-0002-6697-2238
2
http://orcid.org/0000-0002-0258-7816
1GRENASER. Colegio de Postgraduados, Campus Montecillo. México
2Geoinformática, Universidad Autónoma de Ciudad Juárez México
3Facultad de Ciencias, Universidad Autónoma del Estado de México, Campus El Cerrillo. México.
4Posgrado en Ciencias Forestales, Colegio de Postgraduados, Campus Montecillo. México.
5Posgrado en Hidrociencias, Colegio de Postgraduados campus Montecillo. México.
The relationship between vegetation productivity/production and vascular plant species richness is important in order to analyze the response of the vegetation to disturbances, which has been addressed by using different approaches and theoretical frameworks, although with insufficient results to explain the observed variability. Specht and collaborators propose non-linear relationships between projective foliar cover (PFC) and species richness (S) under equilibrium conditions and plant succession. In order to analyze the PFC-S relationships, sampling was carried out in different vegetation types in the eight forest regions defined by Probosque in the State of Mexico, in which 682 sampling plots of 1 000 m2 each were established. The relationships established between PFC with respect to S, in the case of maximum values of S, exhibited patterns that are consistent with the empirical approaches of Specht and collaborators, particularly, as a function of the stages of forest/forest succession. In addition, the ratios were established for shrublands and grasslands. The results of the analyses showed potential relationships between S and the PFC of the upper and lower stratum, in which their parameters are related to each other, simplifying the estimation process to a single parameter.
Key words Vegetal diversity; Specht’s equilibrium; potential models; parameter relationships; maximum richness; forest succession
La relación entre la productividad/producción de la vegetación y la riqueza de especies de plantas vasculares es importante para analizar la respuesta de la vegetación ante disturbios, la cual se ha abordado con diferentes enfoques y marcos teóricos, aunque con resultados insuficientes para explicar la variabilidad observada. Las relaciones propuestas por Specht y colaboradores establecen relaciones no lineales entre la cobertura proyectiva foliar (CPF) y la riqueza de especies (S) bajo condiciones de equilibrio y de sucesión vegetal. Para analizar las relaciones CPF-S se realizaron muestreos en diferentes tipos de vegetación en las ocho regiones forestales definidas por Probosque en el Estado de México, en las que se establecieron 682 parcelas de muestreo de 1 000 m2 cada una. La relación establecida entre la CPF con respecto a S, caso de valores máximos de S, evidenció patrones congruentes con los planteamientos empíricos de Specht y colaboradores, particularmente, en función de los estados de la sucesión de bosques/selvas. Adicionalmente, las relaciones para matorrales y pastizales están establecidas. Los resultados de los análisis mostraron relaciones potenciales entre S y la CPF del estrato superior e inferior, en las cuales sus parámetros están relacionados entre sí, lo que simplifica el proceso de estimación a un solo parámetro.
Palabras clave Diversidad vegetal; equilibrio de Specht; modelos potenciales; relación entre parámetros; riqueza máxima; sucesión forestal
Introduction
Species richness has been related to vegetation productivity and production through different approaches and theoretical frameworks in order to explain the underlying processes and their driving factors (LaRue et al., 2019; Sheil and Bongers, 2020; Wang et al., 2020); however, these associations have proven insufficient to account for the observed variability (Wang et al., 2019).
Regarding the functioning of ecosystems, an increase in the productivity or production of vegetation has been cited as concurrent with the diversity of plant species (Liang et al., 2016). In this respect, using resource competition models, Tilman (1982, 1999) and Tilman et al. (1997) proposed that (biomass) production increases in direct proportion to the number of species competing for a single resource. Thus, the variation in biomass production is high, and its variance decreases as the number of species increases. The same pattern may be observed in the case of competition for two resources (e.g., water and nutrients), therefore, a higher number of species results in full use of the resources and a saturation pattern.
In an experiment on the relationship between productivity/production and species richness in grassland, Tilman et al. (1996) proved that the projective foliar cover increases with the number of species, which is indicative of a specific functional relationship beyond the one existing between biomass and species richness.
Vilá et al. (2005) analyzed experimental evidence in forest systems and proposed that there is a connection between the number of taxa and the productivity/production of forests before canopy closure (early stages of succession or in forests with stress limitations), which changes when (and if) the forest declines. At the beginning of the succession, the shrub cover increased with the increasing tree species richness, which meant that they did not interfere with the tree production.
Wang et al. (2020) analyzed the relationship between productivity/production and species richness and determined concave, asymptotic, positive, negative, and irregular patterns with a positive effect on productivity. Ónodi et al. (2021) registered different relationships before and after a fire, thereby proving that the influence of disturbances on plant succession conditions the stability of ecosystems.
The aerial vegetation canopy cover has a positive effect on species diversity; the intensity of disturbance has a negative effect on the aerial cover and a variable impact on the species richness (Sanaei et al., 2018). The aerial canopy cover, measured as the availability of radiation illumination, is positively and strongly correlated with species richness (Dormann et al., 2020).
The objective of this work was to analyze the relationship between the plant productivity/production and the species richness for the establishment of the necessary conditions for the increase of the aerial biomass and projective foliar cover, as well as the relationship between the projective foliar cover and the number of species for the different types of vegetation of the State of Mexico, based on extensive sampling of its various plant communities.
Materials and Methods
Sampling campaign in the State of Mexico
In 2014, a field campaign was implemented to carry out an inventory of carbon storage and vascular plant richness in the different vegetation types of the State of Mexico. In order to optimize resources, a chronosequential sampling strategy was followed in which primary (undisturbed) vegetation was sampled first, followed by disturbed vegetation (secondary vegetation, in succession), and finally, by vegetation associated with permanent changes in land use mainly as a result of anthropogenic activities (Figure 1).
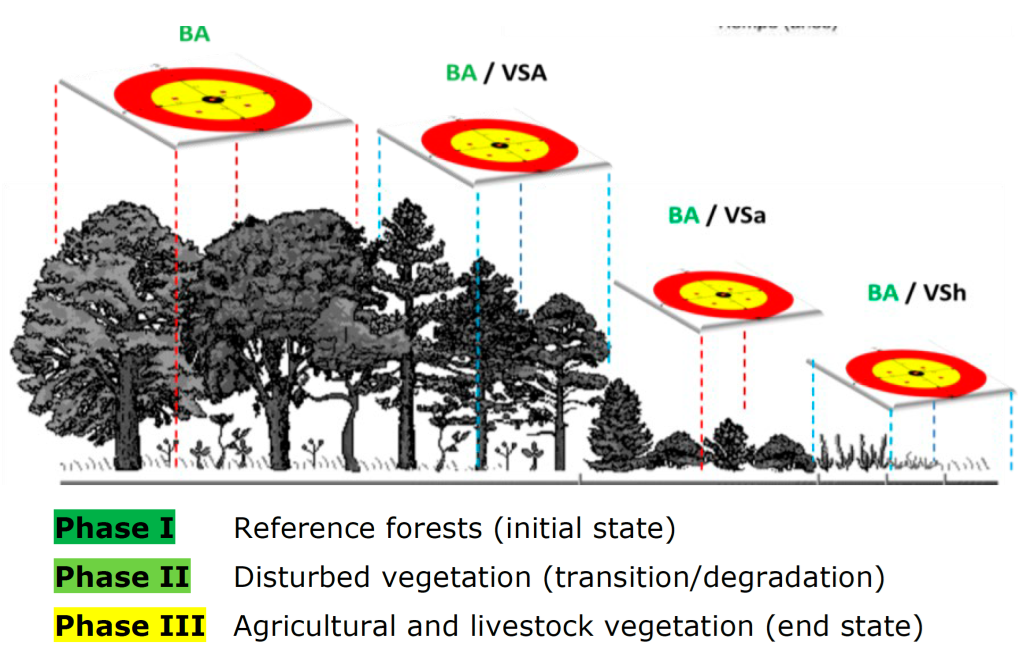
Source: Self made.
The red and yellow circles represent the sampling sites in a fir (Abies spp.) forest at different stages of succession. BA = Primary fir forest; BA/VSA = Fir forest with secondary arboreal vegetation; BA/VSa = Fir forest with secondary shrub vegetation; BA/VSh = Fir forest with secondary herbaceous vegetation.
Figure 1 Sampling phases based on the stratification of land use and vegetation homologated for the State of Mexico.
The types of vegetation and land use were classified according to the system of the Instituto Nacional de Estadística y Geografía, Inegi (National Institute of Statistics and Geography), included in the FAO FRA 2010 (Paz-Pellat et al., 2019), according to which secondary vegetation (SV) has three succession stages, depending on the dominance of the stratum: (A) tree, (a) shrub, or (h) herbaceous. The phases of plant succession make it possible to quantify the level of disturbance of the ecosystem as a measure of its stability.
Sampling distribution
A total of 682 sampling sites 1 000 m2 each were established randomly; Table 1 shows the number of these sites measured in each phase of the campaign. The sample size was estimated according to the protocol for calculating the number of sampling points used in Afforestation and Reforestation Clean Development Mechanism projects (A/R CMD project activity) of the United Nations Framework Convention on Climate Change (UNFCCC), using of the A/R CDM methodological tool (2014), developed by Winrock International (Pearson et al., 2005). The sites were distributed according to the regions into which the Protectora de Bosques del Estado de México, Probosque (Protector of Forests of the State of Mexico) divides that federal state. The use of the sampling phase allows the analysis of vegetation by dominance of the secondary succession stage.
Table 1 Number of plots sampled in each region and stage.
| Probosque region | Sampling phase | ||
|---|---|---|---|
| I | II | III | |
| 01 Toluca | 40 | 45 | 16 |
| 02 Zumpango | 22 | 28 | 12 |
| 03 Texcoco | 56 | 65 | 20 |
| 04 Tejupilco | 9 | 44 | 10 |
| 05 Atlacomulco | 42 | 50 | 23 |
| 06 Coatepec Harinas | 23 | 30 | 11 |
| 07 Valle de Bravo | 26 | 27 | 13 |
| 08 Jilotepec | 19 | 35 | 16 |
| Total | 237 | 324 | 121 |
Figure 2 shows the spatial location of the measured sites, both by region and by sampling phase. The spatial variability of the samples reflects that of the vegetation types registered in each region. The particular types of vegetation are not shown in Figure 2, since the analyses are presented in general terms.

Species record
All vascular plant species present at each sampling site were considered. A photographic record of the taxa was taken, and only those that were flowering or fruiting were collected by standard methods (Lot and Chiang, 1986). Taxonomic identification in the laboratory was carried out with the help of specialized literature (Lot and Chiang, 1986).
The floristic composition (species, genera, and families) of the sampled sites was analyzed. The APG IV angiosperm taxonomic classification system was used as a reference for the species catalog (2016). For the nomenclature of gymnosperms and pteridophytes, the TropicosTM world flora project of the Missouri Botanical Garden Herbarium was consulted (Missouri Botanical Garden, 2018), which contains the most recent updates of taxonomic information concerning this type of plants. Taxon records were made using field information and integrated into databases for analysis.
Projective foliar cover
The projective foliar cover (PFC) was evaluated with the method developed by Salas-Aguilar et al. (2017) for estimating the fraction of forest cover using digital photography: the images were taken with a Canon® Eos Rebel T5 camera set at the highest spatial resolution (17 915 904 pixels). The camera lens was set to an ISO of 200, and the aperture and exposure were used in automatic mode. In order to take the photograph, the lens was leveled upwards, at a 1.5 m height from the ground, at radii of 17.84, 11.28, and 5.65 m, respectively, and clockwise: north to south, northeast to southwest, east to west, and southeast to northwest (Figure 3).

Vegetation balance
Specht (1972) proposed a model of vegetation equilibrium with the atmosphere and water in the soil profile:
Where:
The value of the water stored in the soil (Smax) is estimated by dividing the root-zone water storage capacity value by the permanent wilting point. The precipitation P exceeding Smax is lost as subsurface drainage (D). The water balance (Equation 1) is performed at plot scale; its values correspond to monthly data, and its units are cm.
Specht (1972) proposed that the climax evergreen perennial vegetation utilizes the total available water through the balance of soil water and the atmospheric demand, modulated by the evaporative coefficient k, so that
Where:
The evaporative coefficient k integrates the effects of the vegetation’s aerial geometry (mostly foliar) and the plants’ resistance (mostly stomatal and leaf boundary layer) to water movement (Specht, 1972). A high k value implies a densely structured plant community (low resistance).
Coefficient k is approximated through an evolutionary adjustment within the plant community to a maximum value that is very close but never equal to zero. The assumption is that the climax community (in equilibrium between atmosphere, vegetation, and soil) fully utilizes the available soil moisture for plant growth (biomass accumulation); for this purpose, the roots must explore the soil to use all available water in any part of the soil profile.
In Specht’s work, the PFC of the plant community is divided into an upper stratum or US (projective canopy cover=PFC US ) and a lower stratum or LS (projective canopy cover=PFC LS ). For communities dominated by tree species, the difference in height between these strata is two meters (Specht and Morgan, 1981; Specht and Specht, 1993; Specht and Tyler, 2010). In the case of shrublands, grasslands, and agricultural lands, heights that reflect the partitioning of resources in the community are utilized to determine the distinction between the upper and the lower strata (Specht and Morgan, 1981).
The most important structural feature of an evergreen (and deciduous) perennial plant community is the distribution and orientation of the leaf area from the top to the bottom of the community, in relation to the direct and diffuse component of radiation. These structural attributes, together with the resistance to water flow, determine the value of k (Specht, 1972). Based on these considerations, Specht (1972; 2000) posited an empirical relationship between k (mm-1) and PFC:
Where:
PFC US = Projective foliar cover of the upper stratum
PFC LS = Projective foliar cover of the lower stratum
PFC T = Projective foliar cover of total foliage
n = Data number
R 2 = Coefficient of determination
Specht et al. (1991), and Specht and Specht (1993) developed relationships between the evaporative coefficient k (cm-1) and the species diversity in climax communities:
Where:
ln( ) = Logarithm function
S T = Species richness
S US = Species richness of the upper stratum
n = Data number
R 2 = Coefficient of determination
The relationship between species richness of the lower stratum (S LS ) is linear and inversely proportional to PFC US (Specht and Morgan, 1981; Specht et al., 2006). This pattern is observed in the post-fire succession of a plant community (Specht and Jones, 1971) (Figure 4), which shows that, as the forest tends to mature, the species diversity of the LS decreases and that of the US increases.
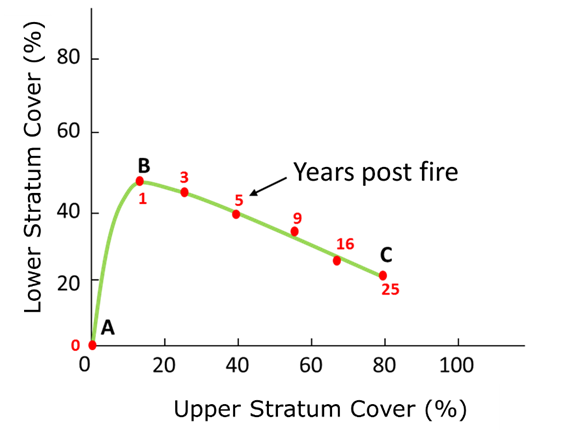
Source: Adapted from Specht and Jones (1971)
Figure 4 Schematization of the evolution of the projective foliar cover in a post-fire succession.
Regarding the number of species and the composition of the community, the succession trajectory shows an increase in species richness in the process towards a climax community. This is only one of the potential trajectories, given that species richness and composition have a virtually infinite number of combinations by which to achieve the equilibrium condition (climax). In general terms, Specht's model states that water in the soil profile, coupled with the atmosphere-vegetation interaction, is the main constraint for the development of plant communities.
The ratio of canopy cover between the upper and lower strata has also been observed in mature plant communities in the United States of America (Tausch et al., 1981; Tausch and Tueller, 1990).
Based on the linear relationship between k and PFC and the exponential relationship between the number of species and the evaporative coefficient k, we expect an exponential (non-linear) relationship between PFC and the number of taxa, which increases with disturbance in the vegetation and is reflected in the state of plant succession. This is particularly true in the case of climax communities.
Data processing
In order to analyze the relationship between the PFC and the S of vascular plants (variables of analysis) the following procedure was followed:
a) First, analyses of the projective foliar cover and species richness relationships were carried out for each individual region (Probosque regionalization).
b) For each general vegetation type and land use, the site with the highest number of species was identified by region, and the corresponding PFC was measured in the field was associated with it.
c) All sites in the Probosque regions were selected and grouped by vegetation type: forests/rainforest (with their succession stages), shrublands, grasslands, and agricultural lands.
Results
Figure 5 shows the results obtained for forests/rainforest and their succession stages. The relationship between S and the PFC of the upper stratum was fitted to a linear model:
Where:
S = Species richness
A = Empirical constant
B = Empirical constant
PFC US = Projective foliar cover of the upper stratum
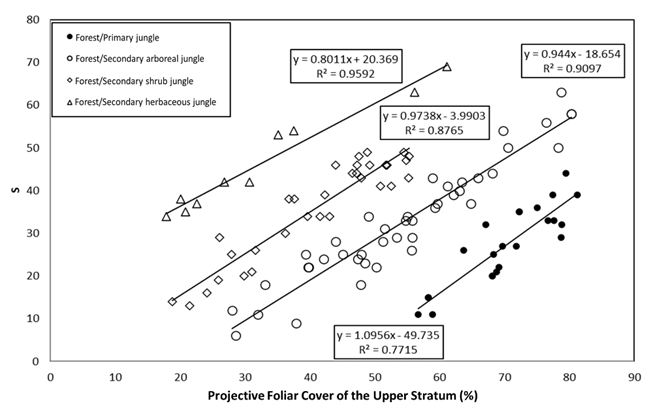
Figure 5 Linear relationships between PFC US and S for forests/rainforest and their succession stages.
The number of sample plots represented in the study is 108; however, eight extreme values in the upper part and four extreme values in the lower part are not shown herein, as they were outside the analyzed limits and had patterns with little experimental data.
Given that a nonlinear relationship between PFC US -k, relationships (3) and (4) were expected, Figure 6 shows the relationships established by potential models.
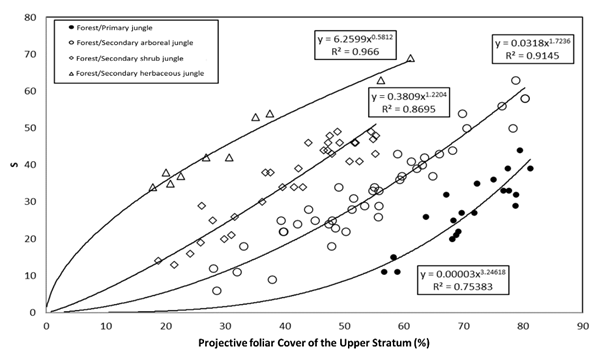
Figure 6 Potential relationships between PFC US and S for forests/jungles and their succession stages.
When analyzing the potential model S=A(PFC US ) B , it was observed that the parameters nl(A) and B are related to each other, as they intersect at a common point (0,1). Figure 7 shows the relationship between the parameters of the potential models fitted in Figure 6; the straight line passes through the point (0,1), since nl(A=1)=0 in the case of B=1. Thus, the relationship between the parameters of the potential models requires only one piece of information to establish the relationships between the different stages of forest/forest succession.

Figure 7 Relationship between the parameters of the potential models for forests/rainforest and their succession stages.
For non-forest/forest vegetation, the number of plots sampled was limited. Figure 8 shows the relationship between PFC LS and S in the case of shrublands.
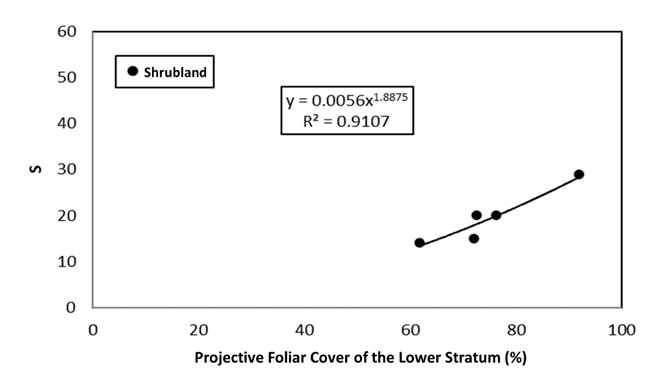
Figures 9 and 10 show the relationships between PFC LS and S for grasslands and agricultural lands, respectively.
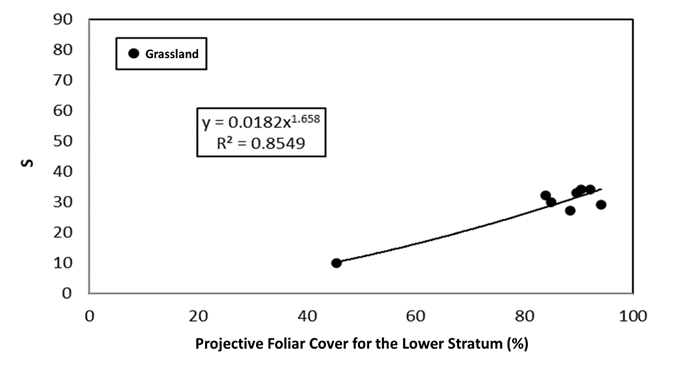

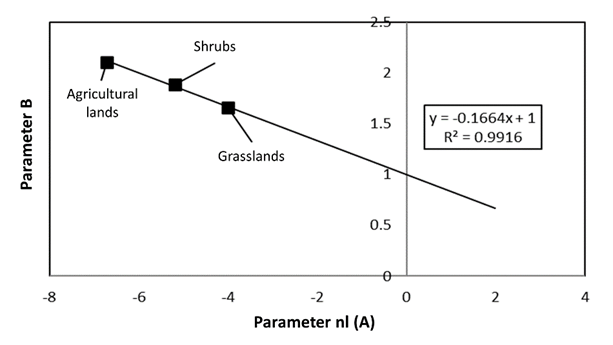
Figure 11 shows the relationship between the parameters of the potential models fitted for the relationship of S to PFC LS for shrubs, grasslands, and agricultural lands which, in a similar way to forests/rainforest, were fitted to a straight line passing through the point (0,1).
Discussion
The relationship between species richness and projective foliage cover for climax communities has been determined by Specht and Morgan (1981) through the use of undisturbed gradients. In the present study, this relationship exhibited patterns that are consistent with the empirical approaches of Specht and Specht (1993), particularly in terms of the forest/rainforest succession stages. It should be noted that studies on this subject are practically restricted to Mediterranean climate ecosystems; the literature includes certain works that make reference to temperate forests (Tausch et al., 1981; Tausch and Tueller, 1990) in sequences of plant succession. According to these reviews, the application of the PFC-S relationship to other types of environments, such as the temperate and subtropical forests of the State of Mexico, extends the previously defined developments and allows establishing general patterns of the relationship between PFC US (k) and the species richness (S), as demonstrated in the research documented here.
The relationship between aerial cover and species richness can be determined for undisturbed climax vegetation (Sánchez-Sánchez et al., 2021); however, its generalization to stages of succession or disruption is still a pending task.
The criterion of using the maximum number of species to characterize a vegetation type and land use establishes a more equilibrium-oriented condition, even in succession stages, as it considers vegetation whose cover ratio to species richness is optimal. A high variability of the experimental data is expected in relation to the fit of potential models, given that the criteria for defining succession stages are qualitative (dominance of strata), varying during the time of plant succession and being subject to a certain level of subjective characterization of the succession.
The dynamics of the evolution of the relationship between the cover and the number of species is the result of the balance between the upper and lower strata (Figure 4) of the vegetation canopy.
The PFC-S relationship reflects the water balance of ecosystems and the trajectories of forest succession, as well as of other vegetation types. Although no variables related to the water balance were measured, the results indirectly support its dynamics.
Conclusions
The models proposed in this work to explain the relationship between the projective foliar cover of the upper and lower vegetation strata in relation to the richness of vascular plant species are consistent with the relationships cited in the literature.
The relationships between the parameters of the potential models simplifies the estimations, as only one value is required for their parameterization, given the relationships between the parameters. The relationship between the two parameters is a consequence of the fact that various linearly transformed curves intersect at a common point.
Acknowledgments
The authors are grateful to Protectora de Bosques del Estado de México, (Probosque), as it provided the financial resources for the project “Technical Feasibility Study for the Payment of Carbon Credits in the State of Mexico”.
REFERENCES
Angiosperm Phylogeny Group IV. 2016. An update of the Angiosperm Phylogeny Group classification for the orders and families of flowering plants: APG IV. Botanical Journal of the Linnean Society 181(1):1-20. Doi: 10.1111/boj.12385. [ Links ]
Dormann, C. F., M. Bagnara, S. Boch, J. Hinderling, … and F. Hartig. 2020. Plant species richness increases with light availability, but not variability, in temperate forests understorey. BMC Ecology 20:43-51. Doi: 10.1186/s12898-020-00311-9. [ Links ]
LaRue, E. A., B. S. Hardiman, J. M. Elliott and S. Fei. 2019. Structural diversity as a predictor of ecosystem function. Environmental Research Letters 14:114011. Doi: 10.1088/1748-9326/ab49bb. [ Links ]
Liang, J. J., T. W. Crowther, N. Picard, S. Wiser, … and P. B. Reich. 2016. Positive biodiversity-productivity relationship predominant in global forests. Science 354(6309):aaf8957-1-aaf8957-12. Doi: 10.1126/science.aaf8957. [ Links ]
Lot, A. y F. Chiang (Comp.). 1986. Manual de herbario: Administración y manejo de colecciones, técnicas de recolección y preparación de ejemplares botánicos. Consejo Nacional de Flora de México A. C. Coyoacán, D. F., México. 142 p. [ Links ]
Missouri Botanical Garden. 2018. Herbario virtual del Jardín Botánico de Missouri. Tropicos v3.4.1. http://www.tropicos.org . (15 de julio de 2018). [ Links ]
Ónodi, G., G. Kröel-Dulay, Z. Botta-Dukát and M. Kertész. 2021. Disturbance reshapes the productivity-diversity relationship. Journal of Vegetation Science 32(3):32e13030. Doi: 10.1111/jvs.13030. [ Links ]
Paz-Pellat, F., V. M. Romero-Benítez, J. A. Argumedo-Espinoza, M. Bolaños-González, … y A. Velázquez-Rodríguez. 2019. Dinámica del uso del suelo y vegetación. In: Paz P., F., J. M. Hernández A., R. Sosa A. y A. S. Velázquez R. (Edits.). Estado del Ciclo del Carbono en México: Agenda Azul y Verde. Programa Mexicano del Carbono. Texcoco, Edo. Méx., México. pp. 529-572. [ Links ]
Pearson, T., S. Walker and S. Brown. 2005. Sourcebook for Land Use, Land-Use Change and Forestry Projects. BioCarbon Fund of World Bank, Winrock International. Arlington, VA, United States of America. 57 p. https://winrock.org/wp-content/uploads/2016/03/Winrock-BioCarbon_Fund_Sourcebook-compressed.pdf . (15 de enero de 2014). [ Links ]
Salas-Aguilar, V., C. Sánchez-Sánchez, F. Rojas-García, F. Paz-Pellat, J. R. Valdez-Lazalde and C. Pinedo-Álvarez. 2017. Estimation of vegetation cover using digital photography in a regional survey of central Mexico. Forests 8(10):392-410. Doi: 10.3390/f8100392. [ Links ]
Sanaei, A., A. Ali and M. A. Z. Chahouki. 2018. The positive relationships between plant coverage, species richness, and aboveground biomass are ubiquitous across plant growth forms in semi-steppe rangelands. Journal of Environmental Management 205:308-318. Doi: 10.1016/j.jenvman.2017.09.079. [ Links ]
Sánchez-Sánchez, C., F. Paz-Pellat, P. Hernández-de la Rosa, A. Velázquez-Rodríguez, … y J. R. Valdez-Lazalde. 2021. Riqueza de especies y tipos funcionales: su relación en bosques de oyamel del Monte Tláloc, Estado de México. Madera y Bosques 27(4):e2742427. Doi: 10.21829/myb.2021.2742427. [ Links ]
Sheil, D. and F. Bongers. 2020. Interpreting forest diversity-productivity relationships: volume values, disturbance histories and alternative inferences. Forest Ecosystems 7(6):1-12. Doi: 10.1186/s40663-020-0215-x. [ Links ]
Specht, R. L. 1972. Water use by perennial evergreen plant communities in Australia and Papua New Guinea. Australian Journal of Botany 20(3):273-299. Doi: 10.1071/BT9720273. [ Links ]
Specht, R. L. 2000. Savannah woodland vegetation in the South-East District of South Australia: the influence of evaporative agrodynamics on the foliage structure of the understorey invaded by introduced annuals. Austral Ecology, A Journal of ecology in the Southern Hemisphere 25(6):588-599. Doi: 10.1111/j.1442-9993.2000.tb00064.x. [ Links ]
Specht, R. L. and R. Jones. 1971. A comparison of the water use by heath vegetation at Frankestod, Victoria, and Dark Island Soak, South Australia. Australian Journal of Botany 19(3):311-326. Doi: 10.1071/BT9710311. [ Links ]
Specht, R. L. and D. G. Morgan. 1981. The balance between the foliage projective covers of overstorey and understorey strata in Australian vegetation. Australian Journal of Ecology 6(2):193-202. Doi: 10.1111/j.1442-9993.1981.tb01290.x. [ Links ]
Specht, R. L., H. T. Clifford, M. Arianoutsou, L. H. Bird, … and A. Specht. 1991. Structure, floristics and species richness of plant communities in Southeast Queensland. Proceedings of the Royal Society of Queensland 101:27-78. https://www.cabdirect.org/cabdirect/abstract/19920657198 . (3 de marzo de 2018). [ Links ]
Specht, A. and R. L. Specht. 1993. Species richness and canopy productivity of Australian plant communities. Biodiversity & Conservation 2:152-167. Doi: 10.1007/BF00056131. [ Links ]
Specht, R. L., G. N. Batianoff and R. D. Reeves. 2006. Vegetation structure and biodiversity along the eucalypt forest to rain forest continuum on the serpentinite soil catena in a subhumid area of Central Queensland, Australia. Austral Ecology, A Journal of ecology in the Southern Hemisphere 31(3):394-407. Doi: 10.1111/j.1442-9993.2006.01628.x. [ Links ]
Specht, R. L. and M. J. Tyler. 2010. The species richness of vascular plants and amphibia in major plant communities in temperate to tropical Australia: relationship with annual biomass production. International Journal of Ecology (2010):1-17. Doi: 10.1155/2010/635852. [ Links ]
Tausch, R. J. and P. T. Tueller. 1990. Foliage biomass and cover relationships between tree- and shrub-dominated communities in pinyon-juniper woodlands. The Great Basin Naturalist 50(2):121-134. https://www.jstor.org/stable/41712584 . (18 de abril de 2018). [ Links ]
Tausch, R. J., N. E. West and A. A. Nabi. 1981. Tree age and dominance patterns in Great Basin pinyon-juniper woodlands. Journal of Range Management 34(4):259-264. http://hdl.handle.net/10150/646276 . (7 de abril de 2018). [ Links ]
Tilman, D. 1982. Resource competition and community structure. Monography in Population Biology. Princeton University Press. Princeton, NJ, United States of America. 310 p. [ Links ]
Tilman, D. 1999. The ecological consequences of changes in biodiversity: a search for general principles. Ecology Ecological Society of America 80(5):1455-1474. Doi: 10.1890/0012-9658(1999)080[1455:TECOCI]2.0.CO;2. [ Links ]
Tilman, D., C. L. Lehman and K. T. Thomson. 1997. Plant diversity and ecosystem productivity: theoretical considerations. Proceedings of the National Academy of Sciences of the United States of America 94(5):1857-1861. Doi: 10.1073/pnas.94.5.1857. [ Links ]
Tilman, D., D. Wedin and J. Knops. 1996. Productivity and sustainability influenced by biodiversity in grassland ecosystems. Nature 379(6567):718-720. Doi: 10.1038/379718a0. [ Links ]
Vilá, M., P. Inchausti, J. Vayreda, O. Barrantes, … and T. Mata. 2005. Confounding factors in the observational productivity-diversity relationship in forests. In: Scherer-Lorenzen, M., C. Körner and E. D. Schulze (Eds.). Forest diversity and function: temperate and boreal systems. Ecological Studies, Vol. 176. Springer-Verlag. Heidelberg, BW, Germany. pp. 65-86. [ Links ]
Wang, Z., A. Chiarucci and J. F. Arratia. 2019. Integrative models explain the relationships between species richness and productivity in plant communities. Scientific Reports 9:13730. Doi: 10.1038/s41598-019-50016-3. [ Links ]
Wang, Z., J. Arratia, T. Yan, C. Zhang and A. Chiarucci. 2020. Diverse and integrative explanations for plant productivity-richness relationships. Preprints (2020):1-18. Doi: 10.20944/preprints202011.0290.v1. [ Links ]
Received: July 25, 2022; Accepted: February 27, 2023
 Este es un artículo publicado en acceso abierto bajo una licencia Creative Commons
