


Servicios Personalizados
Revista
Articulo
 texto en
  Inglés (pdf)
 Artículo en XML
 Referencias del artículo
 Enviar artículo por email
Indicadores
-
 Citado por SciELO
 -
 Accesos
Links relacionados
-
 Similares en
SciELO
Similares en
SciELO
Compartir

 Permalink
Revista mexicana de ciencias forestales
versión impresa ISSN 2007-1132
Rev. mex. de cienc. forestales vol.13 no.73 México sep./oct. 2022 Epub 10-Oct-2022
https://doi.org/10.29298/rmcf.v13i73.1188
Scientific article
Predictive models of resin production in Pinus pseudostrobus Lindl., in Michoacán State, Mexico
1
 http://orcid.org/0000-0001-9344-9875
1
http://orcid.org/0000-0001-9964-6407
1Campo Experimental Uruapan. INIFAP. México.
2Campo Experimental Chetumal. INIFAP. México.
3Campo Experimental Centro de Chiapas. INIFAP. México.
4Universidad Autónoma de Nuevo León. México.
Pinus pseudostrobus is a conifer widely used in the state of Michoacán for the extraction of resin; however, current resin extraction methods are empirical and without knowledge of the potential production. Based on mensuration variables and using the ordinary least squares (OLS) method and mixed effects models (MEM), a predictive model for estimating resin production was evaluated. The normal diameter, crown diameter and total height of 215 resin trees were measured; in addition, the resin production per face (2 186 faces) was quantified in an altitudinal range of 2 226 to 2 785 m. After debugging the database and constructing the combined variable (d2tH), a logarithmic linear model was adjusted under two statistical approaches ―OLS and MEM―, using the R® software. By including the altitude covariate in the MEM as a grouping variable, there is an average statistical gain of 17 % with respect to the OLS approach. No issues of non-compliance with the normality regression or homoscedasticity assumptions were observed. A model with global parameters is proposed to estimate the average resin yield for the region and three variants with random parameters, where the altitude of 2 500 m has the highest production. The estimated productivity and its relationship with the altitudinal ranges can be a guideline for the establishment of forest plantations for resin extraction purposes or the development of forest management plans for the species in the Indigenous Community of Nuevo San Juan Parangaricutiro, Michoacán.
Key words Forest management; mathematical model; Pinus pseudostrobus Lindl.; prediction; production; pine resin
Pinus pseudostrobus es una conífera ampliamente aprovechada en el estado de Michoacán para la extracción de resina; sin embargo, los métodos actuales de resinación son empíricos y sin conocimiento de la producción potencial. A partir de variables dasométricas y con el uso del método de mínimos cuadrados ordinarios (MCO) y modelos de efectos mixtos (MEM), se evaluó un modelo de predicción para estimar la producción de resina. A 215 árboles resineros, se les midió el diámetro normal, diámetro de copa y altura total, además se cuantificó la producción de resina por cara (2 186 caras) en un intervalo altitudinal de 2 226 a 2 785 m. Posterior a depurar la base de datos y a construir la variable combinada (d 2 At), se ajustó un modelo lineal de tipo logarítmico en el programa R ® bajo dos enfoques estadísticos: MCO y MEM. Al incluir la covariable de altitud en los MEM como variable de agrupación, se tiene una ganancia estadística promedio de 17 % con respecto a MCO. No hubo incumplimiento de los supuestos de regresión de normalidad y homocedasticidad. Se propone un modelo con parámetros globales para estimar el rendimiento de resina promedio y tres variantes con parámetros aleatorios, en las cuales la altitud de 2 500 m presenta la mayor producción. La productividad estimada y su relación con los intervalos altitudinales puede utilizarse para el establecimiento de plantaciones forestales resineras o en la elaboración de planes de gestión forestal para la especie en la Comunidad Indígena de Nuevo San Juan Parangaricutiro, Michoacán.
Palabras clave Manejo forestal; modelo matemático; Pinus pseudostrobus Lindl.; predicción; producción; resina de pino
Introduction
Worldwide, 1 300 000 t of pine resin is extracted and used mainly as resin, rosin, and turpentine in the market (Cunningham, 2009). Resin production is concentrated in three countries: China, Brazil and Indonesia (92 %), 8% of the total came from Argentina, Russia, India, Mexico, Portugal, Spain, Vietnam and Fiji (Cunningham, 2009; Conafor, 2013). In Mexico, resin is harvested in the states of Jalisco, Oaxaca, State of Mexico and Michoacán, the latter occupying first place with 22 408 t per year, equivalent to 82.7 % of national production (Semarnat, 2016).
In the country, after timber products, pine resin is the most secure and permanent source of income for the poorest rural population in areas with pine and pine-oak forests, particularly in the aforementioned entities (Ayala, 2011).
Pine resin extraction has been practiced in Mexico since pre-Hispanic times (Mas and Prado, 1981); however, its use for commercial purposes began in 1920. Normally, it is carried out according to the norm NOM-026-Semarnat-1996 and current regulations which include the General Law for Sustainable Forest Development and its Regulations (Semarnat, 2016).
The resination system utilized is the Traditional French method modified for Mexico and implemented in 1937 by official regulations; it was first applied in the state of Michoacán, in 1954 (Reyes-Ramos et al., 2019). This system is applicable for trees larger than 30 centimeters in diameter (d), determining the number of cuts (faces) that the tree can support, which are made when the trees reach an age of 20 years (Romahn, 1992).
Historically, resin production in Michoacán has had an outstanding participation with a value of between 70 000 t per year in the 1930s (Cofom, 2007), and 22 408 t in 2016 (Semarnat, 2016); in 2017, there was a rebound in production of just over 90 %. The state currently occupies the first place nationally, with a production of 24 141 t (Semarnat, 2017). The species with the highest resin production in the entity are: Pinus oocarpa Schiede ex Schltdl., P. leiophylla Schiede ex Schltdl. & Cham., P. lawsonii Roezl ex Gordon, P. teocote Schltdl. & Cham., P. herrerae Martínez, Pinus tenuifolia L., P. montezumae Lamb., P. ponderosa Douglas ex C. Lawson, P. pringlei Shaw and P. pseudostrobus Lindl(Instituto Nacional de Investigaciones Forestales, 1973).
Some industries and organizations have taken up the task of increasing pine resin production through productive reforestation in resin forests and non-timber commercial forestry plantations, as permitted by current regulations, as is the case of the Indigenous Community of Nuevo San Juan Parangaricutiro (Comunidad Indígena de Nuevo San Juan Parangaricutiro, CINSJP), where 70 % of the population is engaged in forestry activities, including sawmilling, transport and resin extraction. The area with commercial value for timber and resin owned by the CINSJP is 18 132 ha of forest; between 40 to 50 % is used for resin production, the extraction of which is focused on three species: Pinus leiophylla (Chihuahua pine), P. pseudostrobus (smooth-bark Mexican pine) and P. oocarpa (ocote) (Arias and Chávez, 2006). In addition, CINSJP has a resin distillation plant, with a capacity of 750 t year-1 (Aguilar, 2008).
In the last few years, quantitative information has been generated for some non-timber forest resources (NTFR). Among the published studies, some models for estimating the production of edible wild mushrooms (Tricholoma magnivelare (Peck) Redhead and Cantharellus formosus Corner) stand out in Tlaxcala (Zamora-Martínez et al., 2009; Velasco et al., 2010); of mescal agaves (Agave karwinskii Zucc. and A. potatorum Zucc.) in Oaxaca (Velasco et al., 2009b); of camedor palm (Chamaedorea oblongata Mart.) in Escárcega, Campeche (Zamora-Martínez et al., 2011); of lechuguilla (Agave lechuguilla Torr.) in San Luis Potosí (Velasco et al., 2009a); and of resin from P. pseudostrobus and P. leiophylla in Michoacán (Zamora-Martínez et al., 2013) and P. oocarpa in Chiapas (Reynoso-Santos et al., 2018; Cadena-Iñiguez et al., 2019).
To date, the use of pine resin has been carried out empirically, and there are no studies on the validation of predictive models that estimate the production potential of pine resin. Therefore, it is necessary to have a standardized method with quantitative techniques that will allow the producer to know the harvesting potential per unit area and the forestry technicians to evaluate the extraction process in a practical and reliable way. If there were a relationship between tree dendrometry (height, normal diameter and percentage of live crown) and resin yield, these parameters could be used to generate a mathematical model, as it requires less effort than direct resin flow measurements.
The study hypothesizes that certain dasometric characteristics of the tree are related to its resin yield potential, which allows more accurate estimates to be obtained. Therefore, the objective was to adjust a predictive model for resin production per tree, based on the variables normal diameter (d, cm), crown diameter (cd, m), and total height (tH, m) for P. pseudostrobus forests of the CINSJP, Michoacán, Mexico. The results are discussed in terms of identifying the best mathematical model that most accurately estimates resin yield in P. pseudostrobus stands.
Materials and Methods
The study was conducted in resin-producing areas within the natural forests of the CINSJP, Michoacán, which is located between 19°25′00″ N and 102°06' and 102°17’46’’ W. The altitudinal range where the research was carried out was 2 226-2 785 m; the relief is of the Sierra type, with extrusive igneous geology and Andosol type soil; the climate is humid temperate (Cw), with a rainfall of 1 500 mm, and the temperature is 15 °C (INEGI, 2010; Inegi, 2017).
Through field trips, resin-producing trees were selected in 12 sites in the following areas. The selected individuals were representative of the resination quarters of each locality, and were measured for d, cd and tH. The resin production was measured for each side (PredResina[g]) of 215 trees (2 186 resination faces), with a periodicity of 45 days, during the 2009-2010, 2010-2011, 2016-2017 and 2018-2019 periods. It is worth mentioning that the individuals evaluated in the different years were not the same and exhibited different stages of utilization.
Once the information was captured in an Excel® database, it was audited to discard the aberrant points in the sample, and the cd was grouped at each meter length (5, 6 and 18 m) to generate the classification variable by dimension or cup class (ClasCop), in order to reduce variability when included in a mixed-effects model adjustment. The basic statistics of the sample were then calculated, among which the values of kurtosis and skewness had to be in the interval between 3 and -3 in order to consider the information as normally distributed (Martínez et al., 2006).
Once the database was constructed and refined, a combined variable was included, which was constructed by squaring the d and multiplying it by the tH (d 2 tH). After that, the d 2 tH and PredResin variables were transformed to natural logarithm (nl[d 2 At] and nl[PredResina]). In a first adjustment, they were incorporated into a linear model (1) (Ayala et al., 1992) and two of its variants, (2) and (3), by means of ordinary least squares (OLS), using the lm procedure of the free-license software R® (R Core Team, 2016).
Where:
y = Resin production per side (g)
d = Normal diameter (cm)
tH = Total height (m)
nl = Natural logarithm
a, b and c = Parameters to be estimated
e = Error term
In a second adjustment approach and by not correcting the model for the effect of the mean, as proposed by Ayala et al. (1992), ClasCop's classification or grouping variables altitude and month of collection were included in a mixed effects model (MEM=
This modeling, under MEM including the grouping variables, assumes specific variance for each classification group and generalizes the fit for the utilized data (Santana and Mateos, 2014; R Core Team, 2016); at the same time, it also adjusts the values of the specific parameters for each specific level, therefore, the error, variance and value will be unique for each group (Pinheiro et al., 1994; Castedo et al., 2006). Zero variance and normal distribution were assumed in the modeling, however, a variance-covariance matrix was included for each level as proposed by Littell et al. (2006), applied by means of the EBLUP technique by Corral et al. (2019). The normality of the residuals was also verified graphically by means of a graphical test (SAS Institute Inc., 2014).
The Akaike (4) and Bayesian (5) information criteria (AIC and BIC, respectively) and the model’s likelihood value (logLik) were used as parametric criteria for selecting the best model, these evaluate the likelihood and parsimony of each expression, where the lowest value represents the most adequate model, in addition to the significance of all its parameters (p=0.05) (Bolker et al., 2009; Cayuela, 2014; Correa y Salazar, 2016; R Core Team, 2016).
Where
AIC and BIC = Akaike and Bayesian information criteria
logLik = Log-likelihood value of the model
k = Penalty value for excess parameters
n = Number of model parameters
log= Logarithm base ten
Results and Discussion
Based on 1 761 resin production records per face, the descriptive statistics of the final sample indicate that the range of the d was 37 to 109 cm, while that of the tH was 19 to 45 m and the average cd was 10 m. In addition, the three variables exhibited a mesokurtic and symmetric distribution of the information. However, the resin yield per face exhibited a leptokurtic distribution (Kurtosis=16.153) and a positive skewness (Skewness Coefficient=3.339) ―a situation that was corrected with the logarithmic transformation of this variable (Table 1).
Table 1 Descriptive statistics of the sample utilized to adjust the predictive models of resin of Pinus pseudostrobus Lindl., in the Indigenous Community of Nuevo San Juan Parangaricutiro, Michoacán.
| Statistics /Variables | Normal diameter (cm) | Total height (m) | Crown diameter (m) | Resin yield (g face-1) | nl Resin yield (g face-1) |
|---|---|---|---|---|---|
| Minimum | 37.00 | 19.00 | 4.65 | 250.00 | 5.52 |
| Maximum | 109.00 | 45.00 | 18.25 | 1 420.00 | 7.91 |
| Mean | 66.43 | 35.38 | 10.38 | 518.81 | 6.15 |
| Standard deviation | 13.849 | 5.481 | 2.837 | 293.245 | 0.415 |
| Sample variance | 191.803 | 30.042 | 8.047 | 85 992.900 | 0.172 |
| Kurtosis | -0.876 | -0.054 | -0.569 | 16.153 | 1.689 |
| Skewness Coefficient | 0.147 | -0.318 | 0.379 | 3.339 | 1.062 |
It was observed that, when the combined variable was included by itself (without the logarithmic transformation) in the OLS adjustment, the parameter b was not significant (p>0.05), and only the expression (1) showed adequate results. In the MEM approach, the value of the intercept (a) turned out to be zero and the parameter related to this variable was also not significant in all the combinations of inclusion of the classification variables in its parameters. Similarly, the values of AIC, BIC and logLik were higher than the OLS fitted model, indicating that there was no improvement in fit (Table 2).
Table 2 Models, estimated parameters and goodness-of-fit statistics for predictive models of resin production in logarithmic form (nl(PredResin)) of Pinus pseudostrobus Lindl., in the Indigenous Community of Nuevo San Juan Parangaricutiro, Michoacán.
| Model | Classification variable | Effect parameter | Parameter | Estimation | Ase | t Value | Pr > |t| | AIC | BIC | logLik |
|---|---|---|---|---|---|---|---|---|---|---|
| (1) | a | 3.4370000 | 8.71E-01 | 3.948 | <0.0001 | 1 290.54 | 1 310.90 | -641.27 | ||
| b | 0.2502000 | 8.01E-02 | 3.124 | 0.00183 | ||||||
| c | -0.0000016 | 5.11E-07 | -3.050 | 0.00234 | ||||||
| (3) | a | 5.9686200 | 2.63E-01 | 22.733 | <0.0001 | 1 297.83 | 1 313.09 | -645.91 | ||
| b | 0.0153000 | 2.20E-02 | 0.694 | 0.48800 | ||||||
| (1) | Altitude | b | a | 5.1963720 | 8.13E-01 | 6.393 | <0.0001 | 1 095.79 | 1 131.40 | -540.89 |
| b | -0.0000010 | 5.00E-07 | -1.314 | 0.18890 | ||||||
| c | 0.1060970 | 7.28E-02 | 1.457 | 0.14540 | ||||||
| (3) | a | a | 5.7304590 | 2.81E-01 | 20.380 | <0.0001 | 1 068.47 | 1 098.99 | -528.23 | |
| b | 0.0527240 | 2.00E-02 | 2.634 | 0.00860 | ||||||
| (1) | Crown class | b | a | 3.4303940 | 8.98E-01 | 3.822 | 0.00010 | 1 325.09 | 1 360.70 | -655.55 |
| b | -0.0000020 | 5.00E-07 | -2.859 | 0.00430 | ||||||
| c | 0.2499670 | 8.24E-02 | 3.033 | 0.00250 | ||||||
| c | a | 3.3335510 | 8.75E-01 | 3.808 | 0.00010 | 1 327.47 | 1 363.08 | -656.74 | ||
| b | -0.0000020 | 5.00E-07 | -3.223 | 0.00130 | ||||||
| c | 0.2597660 | 8.05E-02 | 3.227 | 0.00130 | ||||||
| (3) | a | a | 6.0033800 | 3.42E-01 | 17.533 | <0.0001 | 1 307.76 | 1 338.29 | -647.88 | |
| b | 0.0119820 | 2.83E-02 | 0.423 | 0.67230 | ||||||
| (1) | Collection month | b | a | 4.1428180 | 8.77E-01 | 4.722 | <0.0001 | 1 287.60 | 1 323.21 | -636.80 |
| b | -0.0000010 | 5.00E-07 | -2.149 | 0.03190 | ||||||
| c | 0.1846210 | 8.05E-02 | 2.294 | 0.02200 |
Ase = Approximate standard error; Pr>|t| = Probability p=0.05; AIC and BIC = Akaike and Bayesian information criteria; logLik = Log-likelihood value of the model; a, b and c = Estimated parameters.
In the MEM adjustment, when using the variable nl(PredResin) and including the different effects by classification variable, we obtain non-significant values in certain parameters (i.e. [1] > classification variable=altitude > Effect parameter=b > non-significant parameter=b and c; and [3] > classification variable=Crown class > Effect parameter=a > non-significant parameter=b), and when the crown class effects were included, the AIC, BIC and logLik values did not improve (increase in value) and were therefore discarded for selection (Table 2). By including the classification variables in parameter b (related to the independent variable) of altitude and month of collection, improvements in the values of the parametric criteria for the selection of the best model were evidenced; in this model, the values of AIC, BIC and logLik decreased, while the expression with random effects by altitude of resin collection per face in P. pseudostrobus trees was statistically superior (Table 2).
The model selected as the best fit by MEM=[3] > classification variable=altitude > Effect parameter=a (Table 2) showed a statistical improvement of 17.21 % (222.07), 16.16 % (211.90) and 17.63 % (113.04) in the values of the parametric selection criteria for AIC, BIC and logLik, respectively, with respect to the traditional OLS adjustment. In addition, when the regression assumptions of normality and homoscedasticity of the residuals are checked graphically, the quantile plot tends to a straight line, which is desirable (Martínez et al., 2006); and the residuals do not increase in relation to the increase in the explanatory variable, therefore, there are no issues of non-compliance with the regression assumptions (Martínez et al., 2006) (Figure 1 and 2). For this reason, it is claimed that the model is statistically robust and superior to the other models.
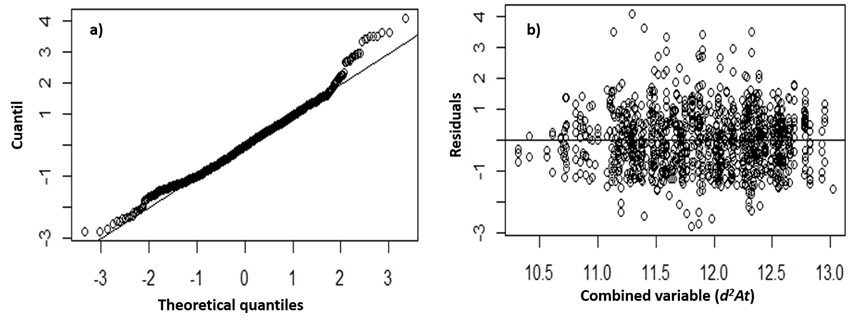
Figure 1 Compliance with the assumptions of normality (a) and homoscedasticity of residuals (b) in the model selected to predict resin in Pinus pseudostrobus Lindl., in the Indigenous Community of Nuevo San Juan Parangaricutiro, Michoacán.
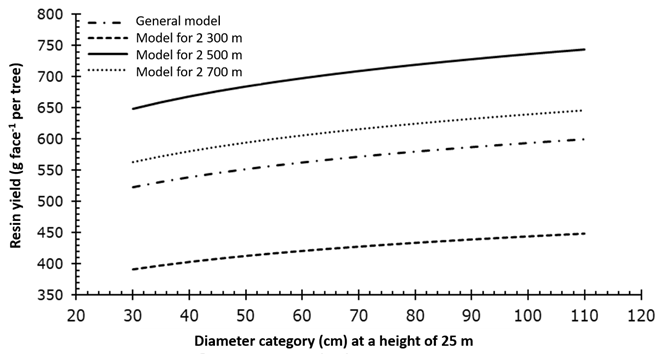
Figure 2 Projection of resin yield (g face-1 per tree) by diameter category at a standard height of 25 m of Pinus pseudostrobus Lindl., in the Indigenous Community of Nuevo San Juan Parangaricutiro, Michoacán.
Once the best model was chosen and using the summary(coef()) function of the R® software, the specific values of the ordinate to the origin (parameter a) were extracted for each grouping level, obtaining values of 5.440657, 5.945814 and 5.804905 at altitudes of 2 300, 2 500 and 2 700 m, respectively; while the parameter related to the variable d 2 tH was constant in all cases (b=0.05272409). The proposed expressions and the form of implementation were as follows:
General model:
Model for an altitude of 2 300 m:
Model for an altitude of 2 500 m:
Model for an altitude of 2 700 m:
Where:
y = Resin yield per side (g)
d = Normal diameter (cm)
tH = Total height (m)
nl = Natural logarithm
exp = Exponential function
e = Error term
When substituting the values of the parameters by specific altitude in expression (3) and applying them to trees with an average height of 25 m and diameter categories from 30 to 110 cm, higher values were observed for the best resin yield (g face-1): in P. pseudostrobus trees, the highest resin yield occurred at an altitude of 2 500 m, followed by 2 700 m and the lowest occurred at 2 300 m. Furthermore, in a tree with a diameter of 60 cm, a tH of 25 m, and a single face, when considering at least five collections per production year, the yield varied from 2 103.90 g face-1 per tree at 2 300 m altitude to 3 486.68 g face-1 per tree at 2 700 m (Figure 2).
In light of the evidence observed in Figure 2 and in order to verify whether the results were statistically different, it was decided to perform an analysis of variance (ANOVA) between the three estimates of resin productivity by diameter category at a standard height of 25 m, considering them as independent populations. For this purpose, an ANOVA was used to compare means utilizing the t-test with a reliability level of 99 % (p=0.01) (Martínez et al., 2006) in which the hypotheses of equality of means (null hypothesis: Ho) were proposed, at least one of which was established to be different from the others (alternative hypothesis: Ha).
The ANOVA results showed significant differences between the estimates (F=387.5, p=<0.001), therefore Ho is rejected and Ha is accepted. The separation of means with the t-test and graphing confirmed that resin production was higher at an altitude of 2 500 m, followed by individuals in the interval considering 2 700 m, and the area with the lowest productivity corresponded to the altitude of 2 300 m (Figure 3). Figure 3 shows that the general model (mean production) overestimates the yield at 2 300 m and underestimates the resin production at the 2 500 and 2 700 m altitudinal ranges.
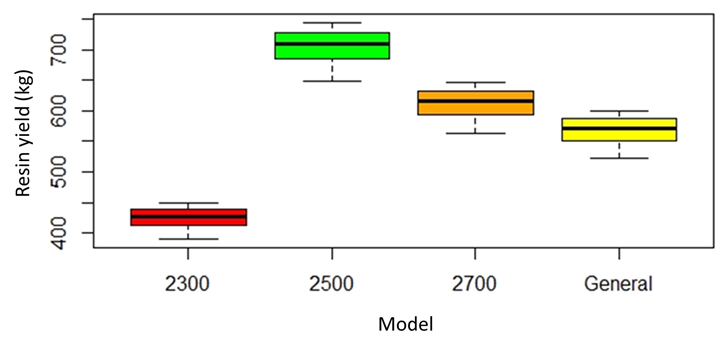
Figure 3 Separation of means (t) for the estimates made between the 30-110 cm diameter categories at a standard height of 25 m with the different models proposed.
With the validation of the ANOVA, it was observed that the Shapiro-Wilk and Bartlett's tests indicated lack of sufficient evidence to reject the null hypothesis (Moore, 2005), the normality of the residuals and that the variances are equal, respectively, at a significance level of p=0.01 (99 %), given that W=0.9623 and p=0.3759, while K 2 =3.9137 and p=0.2709. The above is ratified by the q-q plots of normality (Figure 4a) and by those of the homoscedasticity of the residuals by group (Figure 4b).
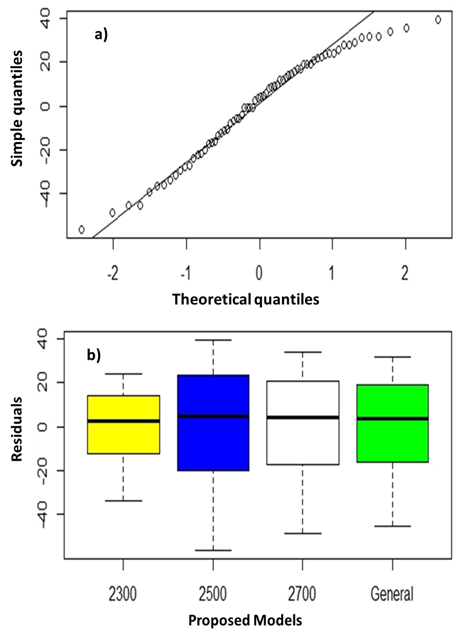
Figure 4 Graphical validation tests of analysis of variance (ANOVA) for normality (a) and homoscedasticity (b).
The altitudinal distribution sampled for P. pseudostrobus in CINSJP was 2 200-2 800 m, with altitudinal intervals of 200 m, including the optimum of development of the species (2 400-2 600 m), which was considered as the one with the highest resin production (g face-1), the first one was obtained at an altitude of 2 500 m, the next one at 2 700 m, and the lowest one, at an altitude of 2 300 m. In a similar work with P. oocarpa, the trees selected as good resin producers were recorded at altitudes of 1 192-1 789 m (1 780-1 880 ft) (Reyes et al., 2019). It is worth mentioning that the optimum development this species is observed at altitudes of 1 200-1 800 m above sea level (Dvorak et al., 2000a). In this regard, there are few studies that support the ideal altitude for a better resin production; however, certain authors (Nanos et al., 2001; Calama et al., 2010; Rodríguez-García et al., 2014) recognize that the combination of environmental factors in space and time, and their interaction with stand dynamics, have been identified as causes of variability in resin yield. These results can be explained by the different site index conditions present at different altitudes. The site index constitutes the main driver of empirical growth and yield models, dedicated to timber production, which is related to dasometric variables such as d and tH (Calama et al., 2010).
The average monthly resin production obtained (0.250-1.420 kg, on average 0.518 kg) was lower than that cited by Plesníková (2014) for P. pringlei, with 0.3 to 4.3 kg of resin per month, at an altitudinal distribution of 1 500 to 2 500 m (Dvorak et al., 2000b). Or than that documented by Reyes-Ramos et al. (2019), who obtained an average of 0.5 kg to 4.5 kg of resin per month from P. oocarpa. However, the monthly resin production behaved similarly to that reported by Instituto Nacional de Investigaciones Forestales (1973), who estimated an average annual production of 5.5 kg (0.4 kg month-1) for P. oocarpa and of 3.5-3.8 kg tree-1year-1 for Pinus pinaster Aiton (Tadesee et al., 2001; Rodríguez-García et al., 2014).
Only for the classification variables of altitude and month of collection, the values of the parametric criteria for the selection of the best model showed improvements, and the best model was (3) when including altitude, because it was statistically robust and optimum to the others. The results showed that trees with an average height of 25 m and diameter categories of 30-110 cm exhibited a higher resin production (g face-1) than at other altitudes (2 300 and 2 700 m).
Similar works on other pine species have shown that the clean stem height and the number of live faces per individual are variables that determine resin yield (Reyes et al., 2019). Thus, Reynoso-Santos et al. (2018) state that the models develloped on the basis of the combined variables d and tH explain a good proportion of pine resin yield. Other variables selected by the model were the crown class and the collection period, which is understandable, considering that the resin yield may increase or decrease as the crown size increases and depending on the collection season or period (Rodríguez-García et al., 2014).
According to Conafor (2013), resin production takes place during two seasons per year: the high season from March to June, and the low season from July to February. The monthly production is 2.2 t month-1 in the dry season and 1 t month-1 in the low season. For Michoacán, the dry season (especially from March to June) is the best time for harvesting and, on average, a resin pine produces one kilogram of resin per month ―an amount that may vary depending on the number of vertical cuts or faces made on the stem (Zamora-Martínez et al., 2013).
For Pinus tecunumanii F. Schwerdtf. ex Eguiluz & J. P. Perry in resinated areas, Dvorak et al. (2002) register average yields of 0.599 kg tree-1 month-1; report an average monthly production of 0.476 kg tree-1 month-1 in P. caribaea var. hondurensis (Sénécl.) W. H. Barrett & Golfari and P. oocarpa during the dry season.
The production of resin in the different species exhibits non-constant yields during the course of the year, these are conditioned to diverse factors such as the influence of the climate (mainly, temperature, precipitation, and humidity), natural factors (complex physiological processes such as the allocation of carbohydrates for growth), or tree-specific factors related to the genetic characteristics of the species, among them, the variability within the tree proper (Nanos et al., 2001; Tadesse et al., 2001; Calama et al., 2010), as well as tree age, crown diameter, stem diameter, distribution and density of resin canals, and soil (Tadesse et al., 2001; Reynoso-Santos et al., 2018; Reyes-Ramos et al., 2019).
Considering that the average annual resin production at national level is 2.0 kg tree-1, and 3.5 kg tree-1for purely resin species such as P. oocarpa (Reyes-Ramos et al., 2019), P. pseudostrobus trees located at an altitude of 2 500 m in the CINSJP are individuals that due to their high productivity in the area, can be regarded as a selection variable at the initial stage of a program aimed at genetic improvement for resin production.
The models generated differ from those developed for other non-timber forest products, such as mescal agaves (A. karwinskii and A. potatorum) (Velasco et al., 2009b); edible wild mushrooms (Zamora-Martínez et al., 2009; Velasco et al., 2010); camedor palm in Escárcega, Campeche (Zamora-Martínez et al., 2011); lechuguilla agave (Agave lechuguilla) in San Luis Potosí (Velasco et al., 2009a); P. pseudostrobus and P. leiophylla resin in Michoacán (Zamora-Martínez et al., 2013) and P. oocarpa in Chiapas (Reynoso-Santos et al., 2018; Cadena-Iñiguez et al., 2019), as this study integrated into the analysis the altitudinal range of distribution of the species in Michoacán, located in the Purépecha mountain range, which includes the CINSJP, where it occurs at altitudes of 2 200 to 3 000 m (Madrigal, 1982).
Conclusions
The proposed model considers easily measured dasometric variables such as normal diameter and total tree height, as well as the global parameters that result from the regression under the mixed effects model approach; therefore, it is robust and statistically reliable for estimating resin production per face and subsequently per individual. Given that it utilizes the random values of its parameters by grouping level, it can be used specifically by altitudinal gradient.
The altitude with the highest apparent resin production ranges between 2 400 and 2 600 m; thus, the yield is lower as the level above sea level of the topography decreases. Consequently, this information can be used for non-timber forest management planning in the forests of the Indigenous Community of Nuevo San Juan Parangaricutiro, Michoacán, where P. pseudostrobus grows and develops. It is also a tool for determining the production potential per unit area or in the establishment of commercial non-timber forest plantations for resin production.
Acknowledgments
The authors are grateful to INIFAP for having authorized the fiscal project "Genetic improvement of Pinus pseudostrobus Lindl. for resin production in Michoacán, Mexico” and for the support provided in field by the staff of the Technical Directorate and the resin collectors of the Indigenous Community of Nuevo San Juan Parangaricutiro, Michoacán.
REFERENCES
Aguilar, S. D. 2008. Programa de manejo forestal persistente para el aprovechamiento de los recursos forestales maderables para el predio denominado Comunidad Indígena de Nuevo San Juan Parangaricutiro, Michoacán. Nuevo Parangaricutiro, Mich., México. 271 p. [ Links ]
Arias T., A. A. y A. Chávez L. 2006. Resina: entre la madera y el desarrollo comunitario integral. Biodiversitas 65:1-7. https://bioteca.biodiversidad.gob.mx/janium/Documentos/7165.pdf . (12 de julio de 2016). [ Links ]
Ayala S., J. C. 2011. Diagnóstico de la situación actual y perspectivas de desarrollo en la producción de la resina de pino en México. In: Foro de intercambio de experiencias: Manejo, aprovechamiento y comercialización de los principales productos forestales no maderables (PFNM) en ecosistemas de bosques templados. Secretaría del Medio Ambiente y Recursos Naturales (Semarnat) y Comisión Nacional Forestal (Conafor). 29 y 30 de septiembre de 2011. Guadalajara, Jal., México. 37 p. [ Links ]
Ayala S., J. C., M. A. Galeote R. y F. J. Zamudio S. 1992. Factibilidad de los aprovechamientos resineros en una plantación joven de Pinus caribea var. Honduresis. Agrociencia 2(3): 47-61. https://www.academia.edu/16250067/1992_FACTIBILIDAD_DE_APROVECHAMIENTOS_RESINEROS_EN_UNA_PLANTACION_JOVEN_DE_PINUS_CARIBAEA_VAR_HONDURENSIS . (12 de julio de 2016). [ Links ]
Bolker, B. M., M. E. Brooks, C. J. Clark, S. W. Geange, … and J. S. S. White. 2009. Generalized linear mixed models: a practical guide for ecology and evolution. Trends in Ecology and Evolution 24(3):127-135. Doi: 10.1016/j.tree.2008.10.008. [ Links ]
Cadena-Iñiguez, P., R. Reynoso-Santos, J. Hernández-Ramos, H. J. Muñoz-Flores and E. Cruz-Santos. 2019. Transfer of a predictive model for the production of pine resin Pinus spp. a small producers in Ejido Jorge de la Vega Domínguez, Cintalapa, Chiapas. International Journal of Agriculture, Environment and Bioresearch 4(4):137-148. Doi: 10.35410/IJAEB.2019.4414. [ Links ]
Calama, R., M. Tomé, M. Sánchez-González, J. Miina, K. Spanos and M. Palahí. 2010. Modelling non-wood forest products in Europe: a review. Forest Systems 49(SI):69-85. Doi: 10.5424/fs/201019S-9324. [ Links ]
Castedo D., F., U. Diéguez-Aranda, M. Barrio A., M. Sánchez R. and K. von Gadow. 2006. A generalized height-diameter model including random components for radiata pine plantations in northwestern Spain. Forest Ecology and Management 229(1-3):202-213. Doi: 10.1016/j.foreco.2006.04.028. [ Links ]
Cayuela, L. 2014. Modelos lineales mixtos (LMM) y modelos lineales generalizados mixtos (GLMM) en R. Universidad Rey Juan Carlos. Madrid, MD, España. 66 p. [ Links ]
Comisión Forestal del Estado de Michoacán (Cofom). 2007. Programa de Desarrollo Forestal Sustentable 2030 Tomo III Anexo de Información Estadística. Cofom. Morelia, Mich., México. 284 p. http://www.conafor.gob.mx:8080/documentos/docs/12/184Programa%20Estrat%c3%a9gico%20Forestal%20del%20Estado%20de%20Michoacan%20Tomo%20III.pdf . (20 de mayo de 2022). [ Links ]
Comisión Nacional Forestal (Conafor). 2013. La producción de resina de pino en México. Secretaría de Medio Ambiente y Recursos Naturales (Semarnat). Zapopan, Jal., México. 101 p. http://www.conafor.gob.mx:8080/documentos/docs/43/6046La%20producci%C3%B3n%20de%20resina%20de%20pino%20en%20M%C3%A9xico.pdf . (12 de julio de 2016). [ Links ]
Corral R., S., A. M. Silva A. y G. Quiñonez B. 2019. Modelo generalizado no-lineal altura-diámetro con efectos mixtos para siete especies de Pinus en Durango, México. Revista Mexicana de Ciencias Forestales 10(53):86-117. Doi: 10.29298/rmcf.v10i53.500. [ Links ]
Correa M., J. C. y J. C. Salazar U. 2016. Introducción a los modelos mixtos. Universidad Nacional de Colombia. Medellín, ANT, Colombia. 257 p. [ Links ]
Cunningham, A. P. 2009. Estado actual de la resinación. Trabajo presentado en el XIII Congreso Forestal Mundial. Buenos Aires, Argentina. 7 p. https://www.academia.edu/4010228/Estado_actual_de_la_resinaci%C3%B3n_en_el_mundo . (15 abril de 2022). [ Links ]
Dvorak, W. S., E. A. Gutiérrez, L. F. Osorio, G. R. Hodge and J. T. Brawner. 2000a. Pinus oocarpa. In: CAMCORE Cooperative. Conservation and testing of tropical and subtropical forest tree species. Grow Graphics. Raleight, NC, USA. pp. 129-147. [ Links ]
Dvorak, W. S., G. R. Hodge y J. L. Romero. 2002. Resultados de veinte años de investigación sobre el Pinus tecunumanii por la Cooperativa de CAMCORE. Recursos Genéticos Forestales No. 29. Roma, RM, Italia. https://www.fao.org/3/y2316s/y2316s02.htm#bm02 . (22 de febrero de 2021). [ Links ]
Dvorak, W. S., P. Kikuti and I. Fier. 2000b. Pinus pringlei. In: CAMCORE Cooperative. Conservation and testing of tropical and subtropical forest tree species. Grow Graphics. Raleight, NC, USA. pp. 174-187. [ Links ]
Instituto Nacional de Estadística y Geografía (INEGI). 2009. Compendio de información geográfica municipal 2010. Nuevo Parangaricutiro, Michoacán de Ocampo. INEGI. Cuauhtémoc, México D. F., México. 10 p. http://www3.inegi.org.mx/contenidos/app/mexicocifras/datos_geograficos/16/16058.pdf . (30 de septiembre de 2019). [ Links ]
Instituto Nacional de Estadística y Geografía (Inegi). 2017. Anuario estadístico y geográfico de Michoacán de Ocampo 2017. INEGI. Aguascalientes, Ags., México. 723 p. https://www.inegi.org.mx/contenidos/productos/prod_serv/contenidos/espanol/bvinegi/productos/nueva_estruc/anuarios_2017/702825092092.pdf . (30 de septiembre de 2019). [ Links ]
Instituto Nacional de Investigaciones Forestales (INIF). 1973. Situación de la industria resinera en México. Publicación Especial Núm. 11. Secretaría de Agricultura y Recursos Hidráulicos. Coyoacán, México D. F., México. 138 p. [ Links ]
Littell, R. C., G. A. Milliken, W. W. Stroup, R. D. Wolfinger and O. Schabenberger. 2006. SAS for mixed models. SAS Institue Inc. Cary, NC, USA. 834 p. [ Links ]
Madrigal S., X. 1982. Claves para la identificación de las coníferas silvestres del Estado de Michoacán. Instituto Nacional de Investigaciones Forestales. Coyoacán, México, D. F., México. 100 p. [ Links ]
Martínez G., M. A., A. Sánchez V. y F. J. Faulin F. 2006. Bioestadística amigable. Editorial Díaz de Santos, S. A. Madrid, Mad., España. 936 p. [ Links ]
Mas P., J. y A. Prado. 1981. Comparación del método de resinación de pica de corteza con estimulantes contra el método francés. Boletín Técnico Núm. 35. Instituto Nacional de Investigaciones Forestales. Coyoacán, D. F., México. 20 p. [ Links ]
Moore, D. S. 2005. Estadística aplicada básica. Antoni Bosch. Trujillo, LL, Perú. 874 p. [ Links ]
Nanos, N., W. Tadesse, G. Montero, L. Gil and R. Alia. 2001. Spatial stochastic modeling of resin yield from pine stands. Canadian Journal of Forest Research 31(7):1140-1147. Doi: 10.1139/cjfr-31-7-1140. [ Links ]
Pinheiro, J. C., D. M. Bates and M. J. Lindstrom. 1994. Model building for nonlinear mixed effects model. University of Wisconsin. Madison, WI, USA. 11 p. [ Links ]
Plesníková, I. F. 2014. Variación genética en un ensayo de progenies de Pinus pringlei Shaw ex Sargent., procedentes de árboles superiores en producción de resina. Tesis de Maestría. Instituto de Investigaciones Agropecuarias y Forestales, Universidad Michoacana de San Nicolás de Hidalgo (IIAF-UMSNH). Morelia, Mich., México. 67 p. [ Links ]
R Core Team. 2016. The R Project for Statistical Computing. Vienna, W., Austria. R Foundation for Statistical Computing. http://www.R-project.org/ . (30 de octubre de 2020). [ Links ]
Reyes-Ramos, A., J. Cruz de León, A. Martínez-Palacios, P. C. M. Lobit, J. E. Ambríz-Parra y N. M. Sánchez-Vargas. 2019. Caracteres ecológicos y dendrométricos que influyen en la producción de resina en Pinus oocarpa de Michoacán, México. Madera y Bosques 25(1):1-13. Doi: 10.21829/myb.2019.2511414. [ Links ]
Reynoso-Santos, R., J. Hernández-Ramos , H. J. Muñoz-Flores , W. López-Báez, P. Cadena-Iñiguez, E. Cruz S. y E. A. Rodríguez C. 2018. Modelo para predecir la producción de resina de Pinus oocarpa Schiede ex Schltdl. en el ejido Jorge de la Vega, Chiapas, México. In: Martínez H., J., M. Á. Ramírez G. y J. Cámara-Córdoba (Edit.). Investigaciones Científicas y Agrotecnológicas para la Seguridad Alimentaria. Universidad Juárez Autónoma de Tabasco e Instituto Nacional de Investigaciones Forestales, Agrícolas y Pecuarias. Villahermosa, Tab., México. pp. 546-551. [ Links ]
Rodríguez-García, A., R. López, J. A. Martín, F. Pinillos and L. Gil. 2014. Resin yield in Pinus pinaster is related to tree dendrometry, stand density and tapping-induced systemic changes in xylem anatomy. Forest Ecology and Management 313(2):47-54. Doi: 10.1016/j.foreco.2013.10.038. [ Links ]
Romahn de la V., C. F.1992. Principales productos forestales no maderables de México. Universidad Autónoma Chapingo. Texcoco de Mora, Edo. Méx, México. 561 p. [ Links ]
Santana, J. S. y E. Mateos F. 2014. El arte de programar en R: un lenguaje para la estadística. Instituto Mexicano de Tecnología del Agua IMTA, Organización de las Naciones Unidas para la Educación, la Ciencia y la Cultura UNESCO y Comité Nacional Mexicano del Programa Hidrológico Internacional. Jiutepec, Mor., México. 193 p. [ Links ]
SAS Institute Inc. 2014. SAS/ETS 13.2 User’s Guide High-Performance Procedures. SAS Institute Inc. Cary, NC, USA. 413 p. [ Links ]
Secretaria de Medio Ambiente y Recursos Naturales (Semarnat). 2016. Anuario Estadístico de la Producción Forestal 2016. Semarnat. Miguel Hidalgo, CdMx, México. 228 p. https://www.gob.mx/cms/uploads/attachment/file/282951/2016.pdf . (30 de noviembre de 2019). [ Links ]
Secretaria de Medio Ambiente y Recursos Naturales (Semarnat). 2017. Anuario Estadístico de la Producción Forestal 2017. Semarnat. Miguel Hidalgo, CdMx, México. 284 p. https://dsiappsdev.semarnat.gob.mx/datos/portal/publicaciones/2020/2017.pdf . (25 de enero de 2022). [ Links ]
Tadesse, W., F. J. Auñón, J. A. Pardos, L. Gil y R. Alía. 2001. Evaluación precoz de la producción de miera en Pinus pinaster Ait. Investigación Agraria: Sistemas y Recursos Forestales 10(1):141-150. https://1library.co/document/qvp7d8gq-evaluacion-precoz-produccion-miera-pinus-pinaster-ait.html . (28 de noviembre de 2019). [ Links ]
Velasco B., E., A. Arredondo G., M. C. Zamora-Martínez y F. Moreno S. 2009a. Modelos predictivos para la producción de productos forestales no maderables: Lechuguilla. Manual Técnico Núm. 2. INIFAP-Centro Nacional de Investigación Disciplinaria en Conservación y Mejoramiento de Ecosistemas Forestales. Coyoacán, México D. F., México. 56 p. [ Links ]
Velasco B., E., M. C. Zamora-Martínez, C. Nieto de Pascual P., J. I. Martínez-Valdez y A. Montoya. 2010. Modelos predictivos de la producción de hongos silvestres comestibles en bosques de coníferas, Tlaxcala, México. Revista Mexicana de Ciencias Forestales 1(1):95-104. Doi: 10.29298/rmcf.v1i1.657. [ Links ]
Velasco B., E., M. C. Zamora-Martínez, H. Espinosa P., C. Sampayo B. y F. Moreno S. 2009b. Modelos predictivos para la producción de productos forestales no maderables: Agaves Mezcaleros. Manual Técnico Núm. 3. INIFAP-Centro Nacional de Investigación Disciplinaria en Conservación y Mejoramiento de Ecosistemas Forestales. Coyoacán, México D. F., México. 60 p. [ Links ]
Zamora-Martínez, M. C., E. Velasco B., A. González H. y G. Hernández G. 2011. Modelos predictivos para la producción de productos forestales no maderables: Palma Camedor. Manual Técnico Núm. 4. INIFAP-Centro Nacional de Investigación Disciplinaria en Conservación y Mejoramiento de Ecosistemas Forestales. Coyoacán, México D. F., México. 64 p. [ Links ]
Zamora-Martínez, M. C., E. Velasco B., A. González H., C. Nieto de Pascual P., F. Moreno S., M. E. Romero S. y A. Flores G. 2009. Modelos predictivos para la producción de productos forestales no maderables: Hongos. Manual Técnico Núm. 1. INIFAP-Centro Nacional de Investigación Disciplinaria en Conservación y Mejoramiento de Ecosistemas Forestales. Coyoacán, México D. F., México. 56 p. [ Links ]
Zamora-Martínez, M. C., E. Velasco B., H. J. Muñoz F. y M. E. Romero S. 2013. Modelos predictivos para la producción de productos forestales no maderables: Resina de Pino. Manual Técnico Núm. 9. INIFAP-Centro Nacional de Investigación Disciplinaria en Conservación y Mejoramiento de Ecosistemas Forestales. Coyoacán, México D. F., México. 44 p. [ Links ]
Received: July 14, 2021; Accepted: August 16, 2022
 Este es un artículo publicado en acceso abierto bajo una licencia Creative Commons
