


Services on Demand
Journal
Article
 text in
  English (pdf)
 Article in xml format
 Article references
 Send this article by e-mail
Indicators
-
 Cited by SciELO
 -
 Access statistics
Related links
-
 Similars in
SciELO
Similars in
SciELO
Share

 Permalink
Revista mexicana de ciencias forestales
Print version ISSN 2007-1132
Rev. mex. de cienc. forestales vol.13 n.73 México Sep./Oct. 2022 Epub Oct 10, 2022
https://doi.org/10.29298/rmcf.v13i73.1199
Scientific article
Local height-diameter model for Metopium brownei (Jacq.) Urb. in Quintana Roo, Mexico
1
 http://orcid.org/0000-0002-2481-6704
2
http://orcid.org/0000-0003-3597-4510
1Instituto Nacional de Investigaciones Forestales, Agrícolas y Pecuarias. Campo Experimental Chetumal, INIFAP. México.
2Instituto Nacional de Investigaciones Forestales, Agrícolas y Pecuarias. Campo Experimental San Martinito. México.
3Instituto Nacional de Investigaciones Forestales, Agrícolas y Pecuarias. Campo Experimental Saltillo. México.
4Instituito Nacional de Investigaciones Forestales, Agrícolas y Pecuarias. Campo Experimental Valle de México. México.
Metopium brownei is a timber species of high commercial value with the potential to help satisfy the furniture market in the Yucatán Peninsula, Mexico. Knowing the allometric relationship total height-normal diameter (at-d) reduces time and costs to carry out forest inventories. The objective of this study was to adjust growth models to estimate the total height as a function of the normal diameter in M. brownei trees as well as to determine the effect on precision and predictive quality when incorporating the mixed effects model (MEM) technique. A sample of 2 794 trees measured in the 2004—2009 National Forest and Soil Inventory for the state of Quintana Roo, was used with which six models were adjusted with the nonlinear least squares technique (MCNL). Subsequently, the MEM technique was applied to the best model with grouping levels given by the covariates of vegetation type (Veg) and municipality (Mpio). The best model under MCNL was the Chapman-Richards model because it explained 45 % of the sample variability, while, under MEM and when grouping Veg-Mpio in a combined way, the adjustment statistics were higher since the explanation was 50 %, the bias was 0.003 m and the percentage difference was 0.001 %. Validation using independent samples did not show significant differences. The proposed model is reliable to estimate the at-d relationship of this species in the tropical forests of Quintana Roo, both to obtain data from a forest inventory and in the preparation and execution of management plans.
Key words Tropical forest; random effects; nonlinear functions; forest inventory; forest management; allometric relationship
Metopium brownei es una especie maderable de alto valor comercial con potencial para contribuir a satisfacer el mercado de muebles en la Península de Yucatán, México. Conocer la relación alométrica altura total-diámetro normal (at-d) reduce tiempos y costos para realizar inventarios forestales. Los objetivos fueron ajustar modelos para estimar la altura total en función del diámetro normal de árboles de M. brownei, así como determinar el efecto en precisión y calidad predictiva al incorporar modelos de efectos mixtos (MEM). Para esto, se utilizó una muestra de 2 794 árboles medidos en el Inventario Nacional Forestal y de Suelos 2004-2009 para el estado de Quintana Roo, con los que se ajustaron seis modelos mediante la técnica de mínimos cuadrados no lineales (MCNL). Posteriormente, al mejor modelo se le aplicó la técnica de MEM con niveles de agrupación dados por las covariables de tipo de vegetación (Veg) y municipio (Mpio). El mejor modelo bajo MCNL fue el de Chapman-Richards porque explicó 45 % de la variabilidad muestral, mientras que con MEM y al agrupar de forma combinada Veg-Mpio los estadísticos de ajuste fueron superiores ya que la explicación fue de 50 %, el sesgo de 0.003 m y la diferencia porcentual de 0.001 %. La validación mediante muestras independientes no mostró diferencias significativas. El modelo que se propone es confiable para estimar la relación at-d de esta especie en selvas de Quintana Roo, tanto para obtener los datos de un inventario forestal como en la elaboración y ejecución de planes de manejo.
Palabras clave Bosque tropical; efectos aleatorios; funciones no lineales; inventario forestal; manejo forestal; relaciones alométricas
Introduction
Metopium brownei (Jacq.) Urb. (Anacardiaceae) or chechén negro is a tree up to 25 m in total height (at, m) and 60 cm normal diameter (d, cm). It is distributed on the slope of the Gulf of Mexico, from the south of the states of Veracruz, Tabasco, the Yucatán Peninsula and north of Chiapas. It is abundant in the middle and upper strata of the semi-evergreen and sub-deciduous forests, with less abundance in the low forests; both in shallow soils with good surface drainage, and in deep soils that withstand periodic flooding (Pennington and Sarukhán, 2005). From the attractive grain of its wood given by its anatomical structure and the combination of colors of its heartwood and sapwood, it is commercially used for the manufacture of veneer, staves, floors, wood paneling or wainscot, furniture and handicrafts with a high market value (Tamarit and López, 2007). Thus, it is an interesting taxon for the forest industry (Gallegos et al., 2012; Silva et al., 2011).
The state of Quintana Roo stands in the second place in the country in timber production of tropical species from forests, with a use of 47 139 m3 of roundwood of tropical hard and soft species (12.10 % of national production) and 4 807 m3 of precious taxa (15.18 % of the national production), with an important economic benefit (Semarnat, 2016).
In carrying out timber forest inventories, d and at are the two most important variables (Liu et al., 2017), but measuring at of all trees is very costly in terms of time and resources. In addition, it is the variable in which the greatest errors occur during its indirect measurement (Hunter et al., 2013). In contrast, the measurement of d is relatively simple, accurate and less expensive (Larjavaara and Muller-Landau, 2013).
The application of forest management requires knowledge of d and at at the tree and stand level to estimate the existing volumes in the forest masses (Pompa-García et al., 2011). The foregoing is achieved with the use of growth or allometric models that estimate the volume from them (Liu et al., 2017). Therefore, the construction and use of models that describe functional relationships and growth dynamics over time are very useful (Regalado et al., 2008). An allometric model is defined as an equation that quantitatively describes a relationship that allows one tree variable (at, volume or biomass) to be predicted as a function of another, for example, d (Picard et al., 2012).
The relationships between at and d, or some other variable such as stump diameter (dt), obey a proportionality rule that is the same for trees growing under similar conditions (Bohlman and O'Brien, 2006). This is a basic principle of allometry that makes it possible to predict variables that are difficult to measure based on others that are easy to measure (Huxley, 1924).
The generation of reliable equations for some variables of the tree is complex due to the variability they present and the different conditions in which they grow (Quiñonez et al., 2012).
Since some time ago, the adjustment of mixed effects models (MEM, for its acronym in Spanish) has become a viable option for this type of study (Corral-Rivas et al., 2014), which replaces the classic regression techniques. The inclusion of random and specific parameters per sampling unit makes it possible to model the variability of a given phenomenon such as growth in height, between the different locations or grouping factors of the variable of interest, and with this, the variance of the error is notably reduced (Rijal et al., 2012; Seoane, 2014). The MEM technique includes fixed parameters common to the entire population and other random parameters specific to grouping levels (Chenge, 2021; Raptis et al., 2021). By using MEM, more efficient, precise and reliable estimators are obtained than the fixed parameters of the model adjusted by LCNM; therefore, the source of variation of the variable of interest can be reduced (Carrero et al., 2008).
From the ecological and economic importance of M. brownei, it is essential that this taxon be studied in detail to generate biometric tools derived from the use of modern modeling techniques that guarantee the estimation of variables of interest such as the overall height, with the highest possible precision. Therefore, under the hypothesis that by including the MEM technique and grouping covariates within an at-d model, it will contribute to improving the quality of statistical adjustment, and so, the predictive capacity. The objectives of this study were: 1) To assess the fit of allometric and growth models under the MCNL technique to predict at as a function of d in M. brownei trees to select the one with the best fit quality, and 2) To adjust the base model selected by MEM, under the combination of two grouping factors to increase the predictive capacity of the at-d relationship for trees of the taxon in Quintana Roo, Mexico.
Materials and Methods
The study was carried out in the state of Quintana Roo, Mexico, in medium sub-evergreen, medium sub-deciduous, low sub-evergreen and sub-deciduous forests on hills and rocky plains. The prevailing climate is warm subhumid (Aw), with 26 °C as average annual temperature and 1 300 mm as average rainfall (Pennington and Sarukhán, 2005; Conafor, 2014).
A database made up of 2 794 at-d data pairs of M. brownei was integrated, which was obtained from 172 clusters of the National Forest and Soil Inventory 2004-2009 (Conafor, 2012) (Figure 1).

Figure 1 Spatial distribution of the clusters by municipality with the presence of Metopium brownei (Jacq.) Urb. in Quintana Roo, Mexico.
For the purposes of practical application of the at-d model to be generated, the information was grouped by combining the levels of classification of vegetation type (Veg): medium sub-deciduous tropical forest (SMS), medium sub-evergreen tropical forest (SMQ), low sub-evergreen tropical forest (SBQ) and low deciduous tropical forest (SBC), in addition to locality groups such as municipality (Mpio): Bacalar (Bac), Benito Juárez (BJ), Felipe Carrillo Puerto (FCP), Isla Mujeres (IM), José María Morelos (JMM), Lázaro Cárdenas (LC), Othón Pompeyo Blanco (OPB) and Solidaridad (Sol), as the use in Felipe Carrillo Puerto of this species for the elaboration of sleepers for several decades eliminated the best individuals and maybe affected the morphometry of the residual trees.
The d with bark was measured at 1.30 m from the ground, with a five-meter graduated diametric tape of the Forestry Suppliers Inc. Qualitäs-bandmaβ, graduated in centimeters and millimeters. The at was obtained from the base of the tree to the top of the crown with a Suunto® clinometer graduated in degrees and percentages.
The database was randomly divided into 60 %, which was used to perform the statistical adjustment of the at-d models and 40 % to validate the selected model. Six nonlinear models were fitted, as well as one potential-type allometric model (Burkhart and Tomé, 2012; Panik, 2014; Thanh et al., 2019; Hernández-Ramos et al., 2020) (Table 1). In a first stage, in order to obtain a base equation, the fit was performed using the nonlinear least squares (NLS) approach in the R statistical package with the nls command (R Core Team, 2016).
Table 1 Local models of at-d adjusted by LCNM for Metopium brownie (Jacq.) Urb. in Quintana Roo, Mexico.
| Model | Expression | Identificator |
|---|---|---|
| Potencial |
|
1 |
| Hossfeld I (Modified) |
|
2 |
| Verhulst-Logística |
|
3 |
| Chapman-Richards |
|
4 |
| Weibull |
|
5 |
| Strand |
|
6 |
at = Total height (m); d = Normal diameter (cm); e = Base of the neperian logarithms; β i = Parameters to be estimated.
The evaluation of goodness of fit and selection of the model was carried out considering the significance of the parameters (α≤0.05) and the best values in the statistics determination coefficient (R 2 ), Akaike and Bayesian information criteria (AIC and BIC) and log-likelihood (loglik) (Corral-Rivas et al., 2014; Guerra-De la Cruz et al., 2019). After selecting the best model, the MEM was run under the combination of the Veg-Mpio clustering factors.
The mathematical structure in matrix form of the model to fit under MEM was based on Bronisz and Mehtätalo (2020) and Chenge et al. (2021), which for a nonlinear model was expressed as:
Where:
Where:
The inclusion of the random effects (β i ) was carried out individually in each of its model parameters separately, for instance:
In addition, a varPower type structure was included in the MEM adjustment, which represents a power type variance function structure in which the distribution of the residuals is corrected for each factor or level of grouping. In this case, the adjustments were made using maximum likelihood in the R statistical package with the nlme command (Pinheiro and Bates, 2000; R Core Team, 2016).
The selection of the best model was made with the same criteria as the fixed effects models with LCNM. Likewise, the regression assumptions of the selected equation were verified by graphically verifying the assumptions of normality of the data with the distribution of frequencies and homoscedasticity of the residuals (R Core Team, 2016). The global deviations of the selected model with MEM were verified with the root mean square error (RCME), while the prediction capacity was confirmed through the average bias of the residuals (
The validation process was carried out with two independent samples: (i) with 40 % of the sample separated from the original database, and (ii) with 1 861 pairs of at-d data obtained in forest plots in the study area. In both cases, a t-test was applied to compare independent means (α=0.01) (Infante and Zarate, 2012).
Results
The average value for d was 17.88 cm, with minimum and maximum values of 7 and 80 cm, respectively; the coefficient of variation was 49.36 % and they showed a positive leptokurtic and asymmetric distribution. The average at was 10.88 m, with extreme values of 6 and 22 m, a coefficient of variation of 27.58 %, and a leptokurtic distribution with a tendency to be symmetric (Table 2).
Table 2 Descriptive statistics of 2 974 pairs of at-d data used in the adjustment for Metopium brownei (Jacq.) Urb. in Quintana Roo, Mexico.
| Statistics | Variables | |
|---|---|---|
| d (cm) | at (m) | |
| Mean | 17.88 | 10.88 |
| Maximum | 80.00 | 22.00 |
| Minimum | 7.50 | 6.00 |
| Variance | 77.86 | 8.99 |
| Standard deviation | 8.82 | 3.00 |
| Coefficient of variation (%) | 49.36 | 27.58 |
| Kurtosis | 4.80 | 0.17 |
| Asymmetry | 1.79 | 0.64 |
In the adjustment of the local fixed effects equations, parameters significantly different from zero were obtained at a significance level of 5 % (p≤0.05) in all cases. The R 2 values explained between 39 % and 45 % of the variability in the data; the values in the Akaike and Bayesian information criteria varied between 7 688 and 7 901, the average logarithm of likelihood was -3 857 (Table 3).
Table 3 Fit statistics of the fixed effects total height-diameter (at-d) models evaluated for Metopium brownei (Jacq.) Urb. in Quintana Roo, Mexico.
| Identifier | R 2 | AIC | BIC | logLik |
|---|---|---|---|---|
| 1 | 0.45 | 7 697.71 | 7 714.06 | -3 845.86 |
| 2 | 0.44 | 7 711.85 | 7 728.20 | -3 852.93 |
| 3 | 0.45 | 7 689.31 | 7 711.11 | -3 840.66 |
| 4 | 0.45 | 7 688.06 | 7 709.86 | -3 840.03 |
| 5 | 0.45 | 7 688.51 | 7 710.31 | -3 840.26 |
| 6 | 0.44 | 7 718.95 | 7 735.30 | -3 856.48 |
R 2 = Coefficient of determination; AIC = Akaike Information Criterion; BIC = Bayesian Information Criterion; logLik = Likelihood-log.
The best fits were obtained for model 4 which corresponds to the Chapman-Richards model (Table 3 and Figure 2). When analyzing the trends of the estimates, it was observed that this model reproduces an average trajectory similar to that of the observed data (Figure 2) and presented the lowest values of the AIC and BIC, and the highest of the loglik, therefore, it was selected to be adjusted using MEM and to analyze the effect of including classification variables. The potential model overestimates height dimensions from categories greater than 35 cm and the Strand, Hossfeld I Modified and Verhulst-logistic models underestimate height in the same categories, so they were rejected (Figure 2).

Figure 2 Distribution of data observed and estimated by the equations of fixed effects for the at-d models for Metopium brownei (Jacq.) Urb. in Quintana Roo, Mexico.
When the random component was incorporated into the model by the level of grouping (Veg-Mpio), it was observed that in some of the parameters not all their values were significant. For instance:
Where:
In Table 4 only the effects that were better and significant are presented. It was determined that by including the mixed effect in the asymptotic parameter
Table 4 Fixed parameters of the Chapman-Richards model when including a combination of grouping levels by vegetation type and municipality for Metopium brownei (Jacq.) Urb. in Quintana Roo, Mexico.
| Parameter | Estimator | Standar error | t value | p value | R 2 | AIC | BIC | logLik |
|---|---|---|---|---|---|---|---|---|
|
|
17.6583 | 1.3804 | 12.7920 | <0.0001 | 0.50 | 7 493.31 | 7 531.45 | -3 739.66 |
|
|
0.0326 | 0.0090 | 3.6088 | <0.0001 | ||||
|
|
0.5867 | 0.0543 | 10.8064 | <0.0001 |
R 2 = Coefficient of determination; AIC = Akaike Information Criterion; BIC = Bayesian Information Criterion; logLik = likelihood-log.
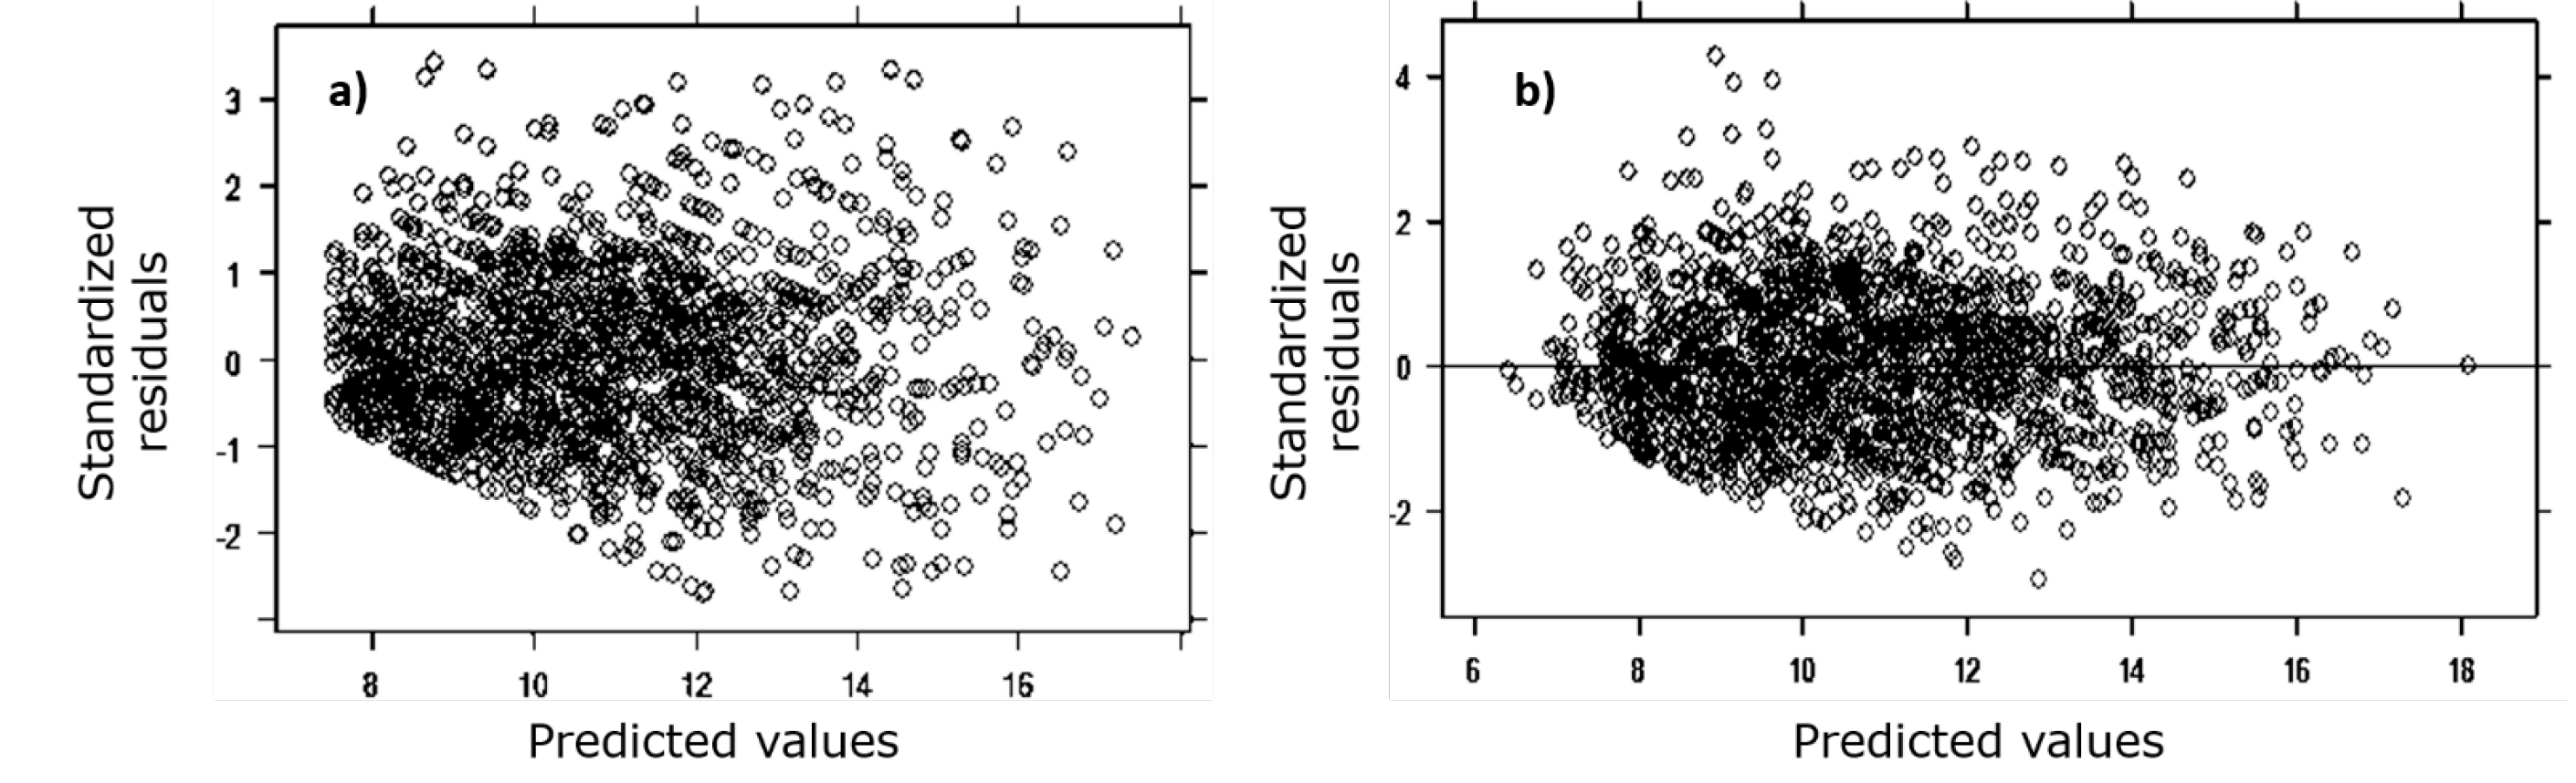
Figure 3 Distribution of standardized residuals with respect to the values predicted in the adjustments by the MCNL technique (a) and by the MEM technique (b) with the Chapman-Richards model for Metopium brownei (Jacq.) Urb. in Quintana Roo, Mexico.
The inclusion of the combined covariates (Veg-Mpio) in the model, led to a statistical gain because the value of R 2 improved 11.11 % with respect to the value of the model adjusted with MCNL. The likelihood indicators (AIC, BIC and logLik) also improved by an average of 2.5 % (Table 4). When contrasting the distribution of the residuals between the fit with MCNL (Figure 3a) and the MEM technique (Figure 3b), it was found that the latter provides a homoscedastic pattern with a distribution centered on zero. The Shapiro-Wilk normality test showed values higher than 0.91, which shows the fulfillment of this regression assumption.
When evaluating the adjustment capacity by MEM, it was determined that the value of the RCME was 2.36 m, the average bias was 0.003 and the DA was 0.0002 %. Validation by statistical comparison of means in independent samples at 99 % reliability (

Figure 4 Comparison of means of the model validation process using independent samples versus estimated data: (a) sample composed of 40 % of the observations of the original base, and (b) independent sample of forest inventories.
From the statistical robustness and improvement of the MEM with respect to the adjustment by MCNL (Tables 3 and 4), as well as its validation through independent samples (Figure 4), the specific random parameters were obtained for each combined level of grouping (Veg-Mpio) that can be used for each specific growth condition (Table 5).
Table 5 Specific parameters of the Chapman-Richards model when including a combination of grouping levels by vegetation type and municipality for Metopium brownei (Jacq.) Urb. in Quintana Roo, Mexico.
| Grouping | Type of vegetation/Municipality | Value of the effect | Value of the parámetro |
|---|---|---|---|
| SMQ-BJ | Medium sub-evergreen tropical forest-Benito Juárez | -1.8866 | 15.7717 |
| SBQ-OPB | Low sub-evergreen tropical forest-Othón P. Blanco | -1.3013 | 16.3569 |
| SBC-OPB | Low deciduous tropical forest-Othón P. Blanco | -1.2021 | 16.4562 |
| SMQ-SOL | Medium sub-evergreen tropical forest-Solidaridad | -0.7481 | 16.9102 |
| SMS-SOL | Medium sub deciduous tropical forest-Solidaridad | -0.6426 | 17.0156 |
| SMQ-BAC | Medium sub-evergreen tropical forest-Bacalar | -0.5097 | 17.1486 |
| SMQ-OPB | Medium sub-evergreen tropical forest-Othón P. Blanco | -0.2756 | 17.3827 |
| SMS-BAC | Medium sub deciduous tropical forest-Bacalar | -0.0820 | 17.5763 |
| SBQ-FCP | Low sub-evergreen tropical forest-Felipe Carrillo Puerto | -0.0729 | 17.5854 |
| SMS-LC | Medium sub deciduous tropical forest-Lázaro Cárdenas | 0.2412 | 17.8994 |
| SBQ-JMM | Low sub-evergreen tropical forest-José María Morelos | 0.4505 | 18.1088 |
| SMQ-IM | Medium sub-evergreen tropical forest-Isla Mujeres | 0.4926 | 18.1509 |
| SMS-FCP | Medium sub deciduous tropical forest-Felipe Carrillo Puerto | 0.6763 | 18.3346 |
| SMQ-FCP | Medium sub-evergreen tropical forest-Felipe Carrillo Puerto | 1.0206 | 18.6789 |
| SMQ-JMM | Medium sub-evergreen tropical forest-José María Morelos | 1.7978 | 19.4561 |
| SMS-JMM | Medium sub deciduous tropical forest-José María Morelos | 2.0419 | 19.7002 |
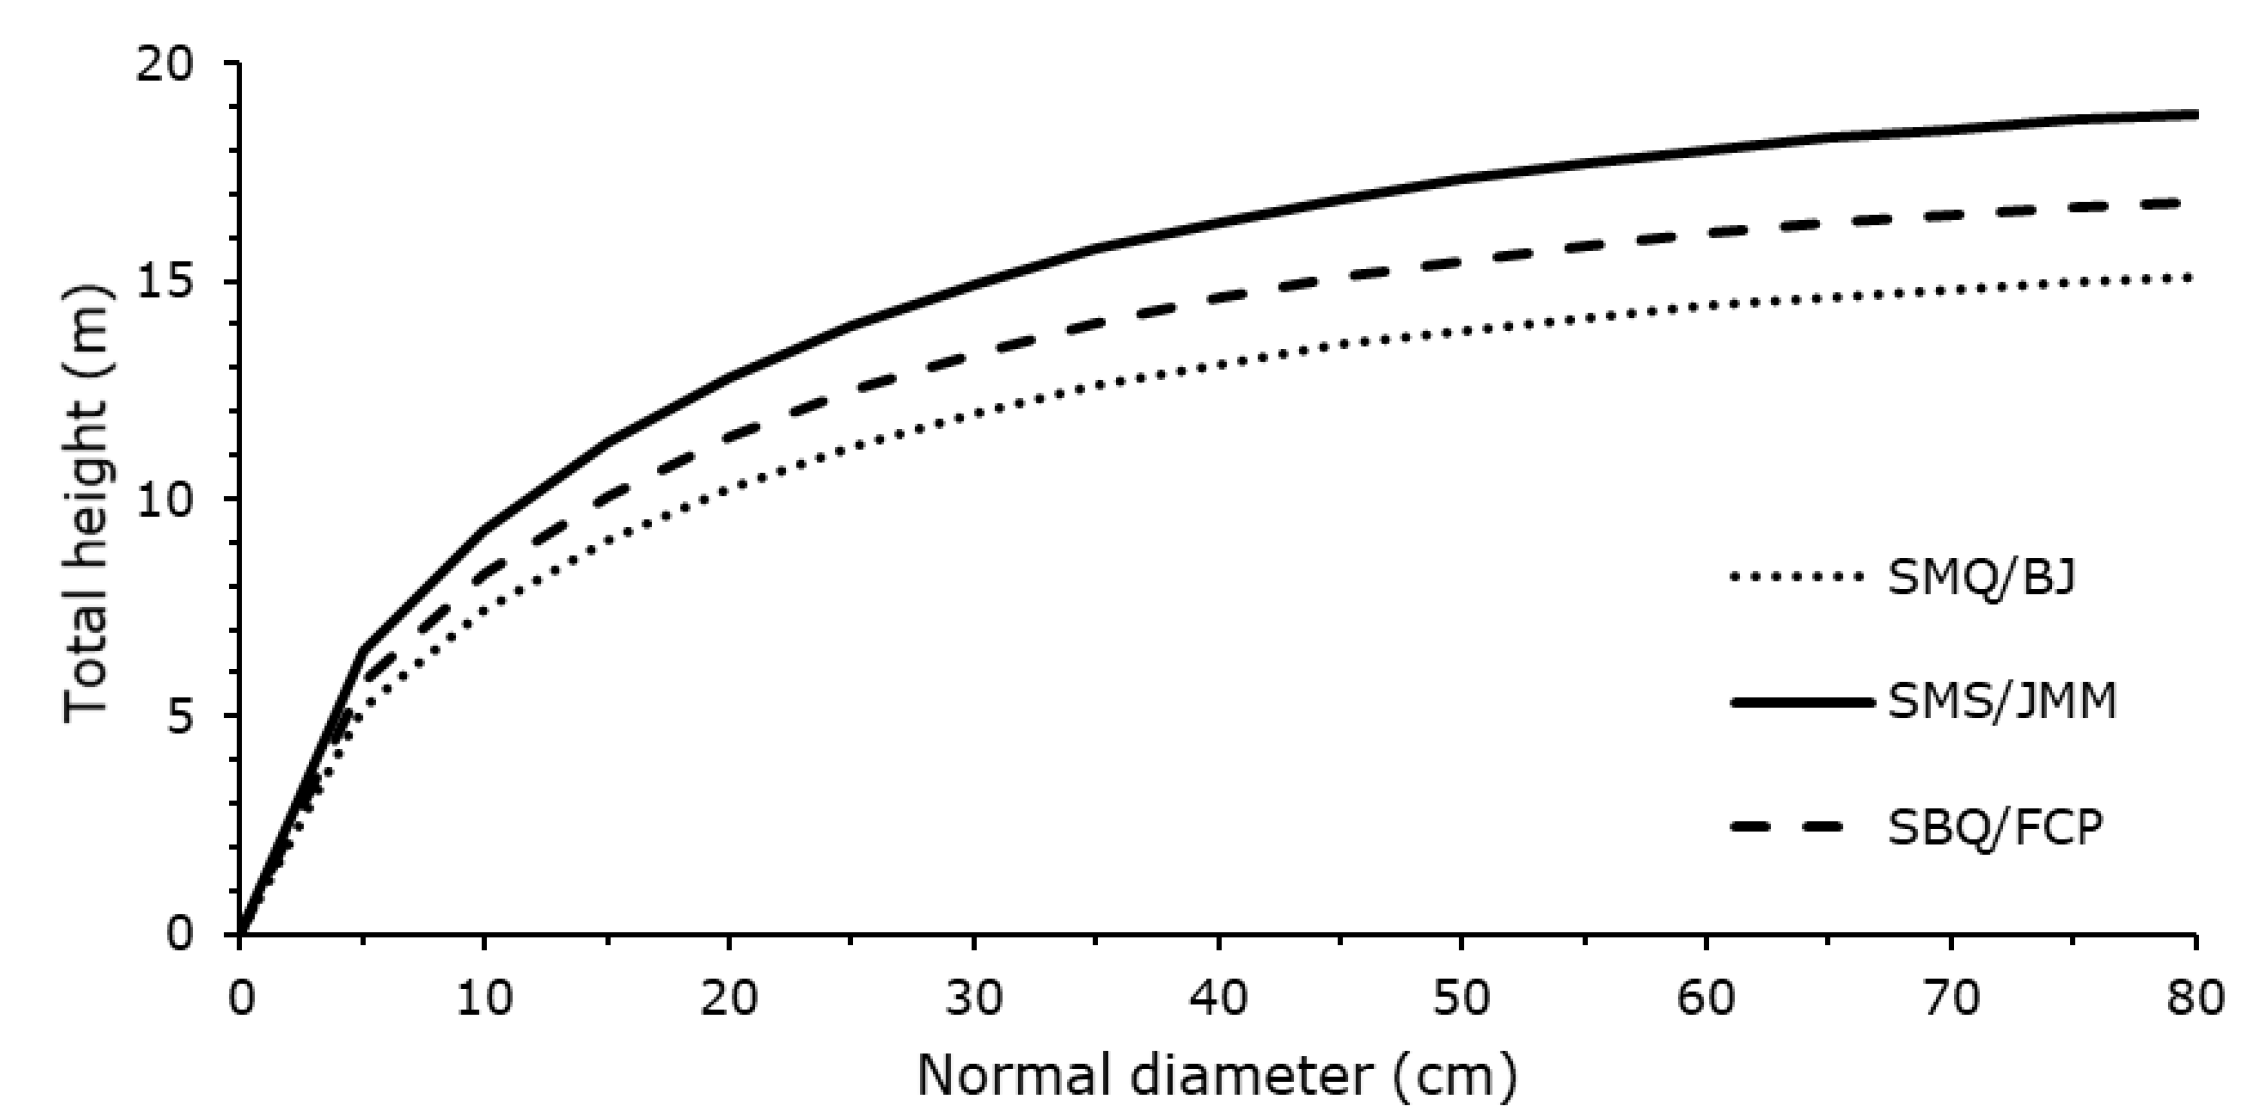
In addition, when contrasting extreme trends of at-d, an average difference of 3.20 m in height was observed, and in the diameter categories of 35 and 40 cm (Figure 5).
Discussion
The gain in the quality of fit of model 6 obtained under the MEM technique, is due to the fact that according to García and Rapelli (2011), grouping the information by some covariate, reduces the deviations with respect to the observed data and the estimation error, since the variance-covariance structure is corrected (Littell et al., 2006) because with this analysis technique, the variance is specific for each grouping level (Rijal et al., 2012; Seoane, 2014), thereby increasing R 2 and improving the values of other goodness-of-fit statistics (AIC, BIC and loglik).
The inclusion of a single specific random effect in the cluster levels (Veg-Mpio) offered the highest predictive quality when associated with the asymptotic parameter, which is explained because it is the most variable and least linear attribute (Tamarit-Urias et al., 2014). This situation led to obtain more efficient, precise and reliable estimators of the fixed parameters of the model and to predict random parameters of each experimental unit, which appropriately reflect the pattern of deviation, in relation to the mean (De los Santos-Posadas et al., 2006; García-Espinoza et al., 2019).
Therefore, the Chapman-Richards expression adjusted under the MEM approach is reliable for estimating at as a function of d in M. brownei trees in the natural tropical forests of Quintana Roo, Mexico, as did Arias (2004) who obtained an R 2 of 0.64 for six timber species from Costa Rica and Castillo-Gallegos et al. (2018) who cite values of R 2 =0.49 for Pinus chiapensis (Martínez) Andresen in forest plantations in Tlapacoyan, Veracruz. In both studies the Chapman-Richards expression was used.
The Chapman-Richards model was also used successfully by Saunders and Wagner (2008) in an at-d relationship under the MEM technique and inclusion of covariates for nine species of trees from the northeast of the United States of America. These authors pointed out that sigmoid models are biologically more appropriate to study at-d relationships. Rijal et al. (2012) and Raptis et al. (2021) also indicate that with the inclusion of stand covariates as predictors, the accuracy of the estimates of the Chapman-Richards model is improved when adjusting it using MEM.
The favorable effect achieved when the MEM technique is applied in at-d relationships is remarkable. Thus, Hernandez-Ramos et al. (2020) obtained an R 2 of 0.46 and an increase in the value referred to this statistic to 0.70 with the Hossfeld IV model under the fixed and random effects approaches, respectively for Lysiloma latisiliquum (L.) Benth. in Quintana Roo, while Garcia et al. (2017) determined local fixed effects models with R 2 from 0.92 to 0.97 to predict at as a function of d in eight tropical species from Quintana Roo, Mexico.
Hernandez-Ramos et al. (2019) adjusted at-d models for Bucida buceras L. (pukté) trees under the mixed effects approach. In this study, the control of variability, as for M. brownei, was carried out by groups when using the cluster, and they obtained a significant statistical improvement with the MEM approach compared to the adjustment of fixed parameters. However, the aforementioned authors recorded a bias of -0.46 m, which is higher than the estimate for M. brownei of 0.003 m, therefore, the proposed equation is reliable for estimating at, as a function of d for this species in the tropical forests of Quintana Roo.
When using the best model adjusted by MCNL, a constant growth trend is observed (Figure 5), while when applying the results obtained with the MEM adjustment this trend tends to an asymptote with a difference between the two of 4.16 m, so this approach contributes to reducing overestimation errors in the at used in the preparation of plans of forest management for M. brownie, species of commercial interest.
Conclusions
The selection of a base model and its subsequent adjustment through the combined use of the MEM technique with grouping factors given by covariates, is an efficient procedure to formulate expressions that allow estimating the total height as a function of the normal diameter in trees of Metopium brownei in Quintana Roo, Mexico, so it can be adopted as an excellent strategy to generate this type of biometric tools.
The Chapman-Richards model parameterized to an at-d relationship and adjusted by means of MEM with the combined factor between the types of vegetation and the municipality in the asymptotic parameter (β 0 ), is the one with the best predictive quality because it increases the precision of the predictions, therefore, its use is recommended in carrying out timber inventories of M. brownei in the study region.
The application of the equations obtained will make it possible to complete the forest inventory databases, in which, due to time and economic logistics, it is not possible to measure the heights of all the trees in the sample.
Acknowledgements
To the Comisión Nacional Forestal (National Forest Commission) for allowing the use of field data from the National Forest and Soil Inventory 2004-2009 of the state of Quintana Roo.
REFERENCES
Arias A, D.. 2004. Estudio de las relaciones altura-diámetro para seis especies maderables utilizadas en programas de reforestación en la Zona Sur de Costa Rica. Kurú: Revista Forestal 1(2):1-11. https://revistas.tec.ac.cr/index.php/kuru/article/view/571/497 . (30 de abril de 2021). [ Links ]
Bohlman, S. and S. O’Brien. 2006. Allometry, adult stature and regeneration requirement of tree species on Barro Colorado Island, Panama. Journal of Tropical Ecology 22(2):123-136. Doi: 10.1017/S0266467405003019. [ Links ]
Bronisz, K. and L. Mehtätalo. 2020. Mixed-effects generalized height-diameter model for young silver birch stands on post-agricultural lands. Forest Ecology and Management 460:1-9. Doi: 10.1016/j.foreco.2020.117901. [ Links ]
Burkhart, H. E. and M. Tomé. 2012. Modeling forest trees and stands. Springer- Dordrecht. Dordrecht, Netherlands. 458 p. [ Links ]
Carrero, O., M. Jerez, R. Macchiavelli, G. Orlandoni y J. Stock. 2008. Ajuste de curvas de índice de sitio mediante modelos mixtos para plantaciones de Eucalyptus urophylla en Venezuela. Interciencia 33(4):265-272. https://www.researchgate.net/publication/46406313_Ajuste_de_curvas_de_indice_de_sitio_mediante_modelos_mixtos_para_plantaciones_de_Eucalyptus_urophylla_en_Venezuela . (10 de abril de 2021). [ Links ]
Castillo-Gallegos, E., J. Jarillo-Rodríguez and R. Escobar-Hernández. 2018. Diameter-height relationships in three species grown together in a commercial forest plantation in eastern tropical Mexico. Revista Chapingo, Serie Ciencias Forestales y del Ambiente 24(1):33-48. Doi: 10.5154/r.rchscfa.2017.05.033. [ Links ]
Chenge, I. B. 2021. Height-diameter relationship of trees in Omo strict nature forest reserve, Nigeria. Trees, Forests and People 3:100051. Doi: 10.1016/j.tfp.2020.100051. [ Links ]
Comisión Nacional Forestal (Conafor). 2012. Inventario Nacional Forestal y de Suelos. Informe 2004-2009. Comisión Nacional Forestal (Conafor) y Secretaría del Medio Ambiente y Recursos Naturales (Semarnat). Zapopan, Jal., México. 228 p. [ Links ]
Comisión Nacional Forestal (Conafor). 2014. Inventario Estatal Forestal y de Suelos-Quintana Roo 2013. Colección de inventarios estatales forestales y de suelos 2013-2014. Secretaría del Medio Ambiente y Recursos Naturales (Sermarnat). Tlalpan, México, D. F., México. 128 p. [ Links ]
Corral-Rivas, S., J. G. Álvarez-González, F. Crecente-Campo y J. J. Corral-Rivas. 2014. Local and generalized height-diameter models with random parameters for mixed, uneven-aged forests in Northwestern Durango, Mexico. Forest Ecosystems 1(6):1-9. Doi: 10.1186/2197-5620-1-6. [ Links ]
De los Santos-Posadas, H. M., M. Montero-Mata y M. Kanninen. 2006. Curvas dinámicas de crecimiento en altura dominante para Terminalia amazonia (Gmel.) Excell en Costa Rica. Agrociencia 40(4):521-532. https://www.redalyc.org/articulo.oa?id=30240411 . (30 de abril de 2021). [ Links ]
Gallegos R., A., M. Sánchez D., G. A. González C., L. Román M., E. Hernández A. y A. Mora S. 2012. Diagnóstico del potencial, productividad y manejo de especies nativas maderables tropicales con alto potencial comercial. Universidad de Guadalajara-Centro Universitario de Ciencias Biológicas y Agropecuarias, Departamento de Producción Forestal. Guadalajara, Jal., México. 41 p. [ Links ]
García C., X., J. Hernández R., A. Hernández R., G. Quiñonez B., J. C. Tamarit U. y G. G. García E. 2017. Predicción del diámetro normal, altura y volumen a partir del diámetro del tocón en especies tropicales. Revista Mexicana de Ciencias Forestales 8(43):89-116. Doi: 10.29298/rmcf.v8i43.67. [ Links ]
García-Espinoza, G. G., O. A. Aguirre-Calderón, G. Quiñonez-Barraza, E. Alanís-Rodríguez, M. A. González-Tagle y J. J. García-Magaña. 2019. Global-local and fixed-random parameters to model dominant height growth of Pinus pseudostrobus Lindley. Revista Chapingo, Serie Ciencias Forestales y del Ambiente 25(1):141-156. Doi: 10.5154/r.rchscfa.2018.06.047. [ Links ]
García, M. del C. y C. Rapelli. 2011. Selección de un modelo no lineal mixto de niveles múltiples para modelar el crecimiento de la soja. FABICIB 15:11-22. Doi: 10.14409/fabicib.v15i1.877. [ Links ]
Guerra-De la Cruz, V., F. Islas-Gutiérrez, E. Flores-Ayala, M. Acosta-Mireles, E. Buendía-Rodríguez, F. Carrillo-Anzures, J. C. Tamarit-Urías y T. Pineda-Ojeda. 2019. Modelos locales altura-diámetro para Pinus montezumae Lamb. y Pinus teocote Schiede ex Schltdl. en Nanacamilpa, Tlaxcala. Revista Mexicana de Ciencias Forestales 10(51):133-156. Doi: 10.29298/rmcf.v10i51.407. [ Links ]
Hernández-Ramos, J., J. C. Tamarit-Urias, X. García-Cuevas, A. Hernández-Ramos, R. Reynoso-Santos y V. Reyes-Hernández. 2019. Modelos alométricos altura-diámetro para Bucida buceras (pukté) en Quintana Roo, México. Bosque 40(3):267-276. Doi: 10.4067/S0717-92002019000300267. [ Links ]
Hernández-Ramos, J. , J. I. Valdez-Hernández, X. García-Cuevas , G. Quiñonez-Barraza, V. J. Reyes-Hernández y A. Hernández-Ramos . 2020. Modelos altura-diámetro con efectos mixtos para Lysiloma latisiliquum (L) Benth. en Quintana Roo, México. Madera y Bosques 26(2): e2622046. Doi: 10.21829/myb.2020.2622046. [ Links ]
Hunter, M. O., M. Keller, D. Vitoria y D. C. Morton. 2013. Tree height and tropical forest biomass estimation. Biogeosciences 10(12):8385-8399. Doi: 10.5194/bg-10-8385-2013. [ Links ]
Huxley, J. S. 1924. Constant differential growth-ratios and their significance. Nature 114(2877):895-896. Doi: https://doi.org/10.1038/114895a0. [ Links ]
Infante G., S. y G. P. Zárate de L. 2012. Métodos estadísticos: un enfoque interdisciplinario. Colegio de Postgraduados. Texcoco, Edo.Méx., México. 624 p. [ Links ]
Larjavaara, M. and H. C. Muller‐Landau. 2013. Measuring tree height: a quantitative comparison of two common field methods in a moist tropical forest. Methods in Ecology and Evolution 4(9):793-801. Doi: https://doi.org/10.1111/2041-210X.12071. [ Links ]
Lencinas, J. D. y D. Mohr-Bell. 2007. Estimación de clases de edad de las plantaciones de la provincia de Corrientes, Argentina, con base en datos satelitales Landsat. Bosque 28(2):106-118. Doi: 10.4067/S0717-92002007000200003. [ Links ]
Littell, R. C., G. A. Milliken, W. W. Stroup, R. D. Wolfinger and O. Schabenberger. 2006. SAS® for Mixed Models. SAS Institute Inc. Cary, NC, USA. 814 p. [ Links ]
Liu, M., Z. Feng, Z. Zhang, C. Ma, M. Wang, … and L. Zhang. 2017. Development and evaluation of height diameter at breast models for native Chinese Metasequoia. PLoS One 12(8):e0182170. Doi: 10.1371/journal.pone.0182170. [ Links ]
Panik, M. J. 2014. Growth curve modeling: Theory and applications. Jhon Wiley & Sons, Inc. Hoboken, NJ, USA. 467 p. [ Links ]
Pennington, T. D. y J. Sarukhán. 2005. Árboles tropicales de México. Manual para la identificación de las principales especies. Universidad Nacional Autónoma de México y Fondo de Cultura Económica. Coyoacán, México D.F., México. 523 p. [ Links ]
Picard, N., L. Saint-André y M. Henry. 2012. Manual de construcción de ecuaciones alométricas para estimar el volumen y la biomasa de los árboles: del trabajo de campo a la predicción. Naciones Unidas para la Alimentación y la Agricultura (FAO) y Centre de Coopération Internationale en Recherche Agronomique pour le Développement. Roma, RM, Italia. 223 p. [ Links ]
Pinheiro, J. C. y D. M. Bates. 2000. Mixed-effects models in S and S-PLUS. Springer-Verlag. New York, NY, USA. 528 p. [ Links ]
Pompa-García, M., H. M. de los Santos-Posadas, M. E. Zepeda-Bautista y J. J. Corral-Rivas. 2011. Un modelo dendrométrico para estimación del diámetro normal a partir de las dimensiones del tocón. Agrociencia 45(3):379-387. https://www.scielo.org.mx/pdf/agro/v45n3/v45n3a10.pdf . (12 de abril de 2021). [ Links ]
Quiñonez B., G., F. Cruz C., B. Vargas L. y F. J. Hernández. 2012. Estimación del diámetro, altura y volumen a partir del tocón para especies forestales de Durango. Revista Mexicana de Ciencias Forestales 3(9):23-39. Doi: 10.29298/rmcf.v3i9.535. [ Links ]
R core Team. 2016. RStudio: Publish your R and Python content with RStudio Connect. Boston, MA, USA. RStudio, Inc. http://www.rstudio.com/ . (Consultado 11 de abril de 2021). [ Links ]
Raptis, D. I., V. Kazana, A. Kazaklis and C. Stamatiou. 2021. Mixed‑effects height-diameter models for black pine (Pinus nigra Arn.) forest management. Trees 35(4):1167-1183. Doi: 10.1007/s00468-021-02106-x. [ Links ]
Regalado M., A., E. Peralta R. y C. A. González R. 2008. Cómo hacer un modelo matemático. Temas de Ciencia y Tecnología 12(35):1-18. https://www.utm.mx/edi_anteriores/temas035/2%20ensayo-35.pdf . (12 de abril de 2021). [ Links ]
Rijal, B., A. R. Weiskittel and J. A. Kershaw. 2012. Development of regional height to diameter equations for 15 tree species in the North American Acadian Region. Forestry: An International Journal of Forest Research 85(3):379-390. Doi: 10.1093/forestry/cps036. [ Links ]
Saunders, M. R. and R. G. Wagner. 2008. Height-diameter models with random coefficients and site variables for tree species of Central Maine. Annals of Forest Science 65(2):203-212. Doi: 10.1051/forest:2007086. [ Links ]
Secretaría de Medio Ambiente y Recursos Naturales (Semarnat). 2016. Anuario estadístico de la producción forestal 2016. Secretaría de Medio Ambiente y Recursos Naturales. Miguel Hidalgo, D. F., México. 225 p. [ Links ]
Seoane, J. 2014. ¿Modelos mixtos (lineales)? Una introducción para el usuario temeroso. Etologuía 24:15-37. https://nanopdf.com/download/modelos-mixtos-universidad-autonoma-de-madrid_pdf . (12 de abril de 2021). [ Links ]
Silva G., J. A. y F. J. Fuentes T. 2012. Industrialización, comercialización y manejo sostenible de diez especies nativas mexicanas. Universidad de Guadalajara-Centro Universitario de Ciencias Biológicas y Agropecuarias, Departamento de Madera, Celulosa y Papel. Guadalajara, Jal., México. 75 p. [ Links ]
Tuan, N. T., T. T. Dinh and S. H. Long. 2019. Height-diameter relationship for Pinus koraiensis in Mengjiagang Forest Farm of Northeast China using nonlinear regressions and artificial neural network models. Journal of Forest Science 65(4):134-143. Doi: 10.17221/5/2019-JFS. [ Links ]
Tamarit U., J. C. y J. L. López T. 2007. Xilotecnología de los principales árboles tropicales de México. Libro técnico Núm. 3. INIFAP-Centro de Investigación Regional del Centro, Campo Experimental San Martinito. Tlahuapan, Pue., México. 264 p. [ Links ]
Tamarit-Urias, J. C., H. M. De los Santos-Posadas, A. Aldrete, J. R. Valdez-Lazalde, H. Ramírez-Maldonado y V. Guerra-De la Cruz. 2014. Ecuaciones dinámicas de índice de sitio para Tectona grandis en Campeche, México. Agrociencia 48(2):225-238. https://www.scielo.org.mx/pdf/agro/v48n2/v48n2a8.pdf . (30 de abril de 2021). [ Links ]
Received: August 31, 2021; Accepted: August 19, 2022
 Este es un artículo publicado en acceso abierto bajo una licencia Creative Commons
