


Serviços Personalizados
Journal
Artigo
 texto em
  Inglês (pdf)
 Artigo em XML
 Referências do artigo
 Enviar este artigo por email
Indicadores
-
 Citado por SciELO
 -
 Acessos
Links relacionados
-
 Similares em
SciELO
Similares em
SciELO
Compartilhar

 Permalink
Revista mexicana de ciencias forestales
versão impressa ISSN 2007-1132
Rev. mex. de cienc. forestales vol.13 no.73 México Set./Out. 2022 Epub 10-Out-2022
https://doi.org/10.29298/rmcf.v13i73.1187
Scientific article
Modelling diameter distribution of natural forests in Pueblo Nuevo, Durango State

1Tecnológico Nacional de México. Instituto Tecnológico de El Salto. México.
2Facultad de Ciencias Forestales, Universidad Juárez del Estado de Durango. México.
3Departamento de Ingeniería Agroforestal. Escuela Politécnica Superior de Lugo. Universidad de Santiago de Compostela. España.
Diameter distributions are an important factor in stand characterization because the diameter is generally correlated with other variables such height, volume, and biomass, and this makes it possible to know what kind products can be harvested from forests. The objective of this research was to develop a strategy to fit the Weibull, Beta and SB Johnson PDFs and reconstruct (modeling) the future diameter distribution with the parameter recovery method. In the first phase, the goodness-of-fit of three probability distribution functions, or PDFs, (Weibull, Johnson’s SB, and Beta) was evaluated using the moments and the maximum likelihood methods to estimate the distribution parameters of 2 252 temporary sampling plots distributed in natural forests in Pueblo Nuevo, Durango, Mexico. In general, the best results in terms of accuracy and parsimony during the model fitting evaluated with the average bias and the root mean square error were obtained with Weibull’s PDF, fitted with the moments method was the best, while Johnson’s SB and Beta were ranked in second and third position, respectively. Therefore, the two-parameter Weibull’s PDF was selected to describe the diameter distributions of the studied forest stands. The parameter recovery method suggested that 62 % of evaluated sampling plots followed a Weibull distribution with a significance level of 20 % in the Kolmogorov-Smirnov test.
Key words Diametric distribution; two-parameter Weibull function; mixed stands; moments method; parameter recovery; sampling plots
Las distribuciones diamétricas son un factor importante en la caracterización del rodal, ya que el diámetro, generalmente, está correlacionado con otras variables de interés como la altura, volumen, biomasa, etcétera, esto permite conocer el tipo de productos que pueden obtenerse del bosque. El objetivo de la presente investigación fue desarrollar una estrategia para ajustar las FDP Weibull, Beta y S B Johnson, así como reconstruir (modelación) la distribución diamétrica futura con el método de recuperación de parámetros. En una primera etapa, se estudió comparativamente la calidad de ajuste de tres funciones de distribución de probabilidad (FDP: Weibull, S B Johnson y Beta) mediante los métodos de momentos y máxima verosimilitud para recuperar los parámetros y describir la distribución diamétrica de 2 252 parcelas temporales de muestreo ubicadas en bosques naturales de Pueblo Nuevo, Durango, México. En general, los mejores resultados en términos de precisión y parsimonia en la etapa de ajuste, evaluados mediante el sesgo medio y la Raíz del Error Medio Cuadrático, se obtuvieron con la FDP Weibull ajustada con el método de los momentos; mientras que las distribuciones S B Johnson y Beta se ubicaron en segundo y tercer lugar, respectivamente. Por tanto, la FDP Weibull biparamétrica fue seleccionada para modelar las distribuciones diamétricas de los rodales estudiados. La técnica de la recuperación de parámetros evidenció que 62 % de las parcelas modeladas siguen una distribución teórica tipo Weibull con 20 % de nivel de significancia en la prueba de Kolmogorov-Smirnov.
Palabras clave Distribución diamétrica; función Weibull biparamétrica; masas mixtas; método de momentos; recuperación de parámetros; sitios de muestreo
Introduction
Natural forests with a cold temperate climate in the state of Durango are located in the Western Sierra Madre (WSM); they occupy an extensive territorial strip that covers almost half the state from northwest to southeast, having contributed on average 30.2 % (2.5 million m3) of the total timber production in Mexico during 2017 and 2018 (Semarnat, 2021). According to González-Elizondo et al. (2012), 21 species of the Pinus genus are registered in these forests, representing around 20 % of all existing pine taxa in the world and 43 Quercus taxa. Cupressus, Juniperus, Fraxinus, Arbutus, Abies, Pseudtsuga and Alnus species are also present, in smaller proportions. Most of the forest stands correspond to an irregular structure, with a mixture of Pinus and Quercus taxa, mainly.
Sustainable forest management requires information on the distribution of the number of trees by stand diameter class, which is necessary to predict the volume of the stand and its distribution by type of products. In addition, it provides data on stand stability and structure, useful characteristics in the prescription of forestry treatments (Gorgoso-Varela et al., 2020).
The use of probability density functions (PDFs) to estimate the number of trees per diameter class, together with the measurement of some stand variables (dominant height, mean height, basal area, etc.), is useful to reduce the costs of forest inventories and improve the predictions of existing growth models. Some PDFs have been adequately used to describe and predict the diameter structure of forest stands: Beta, Gamma, Normal, Weibull, SB Johnson, and in recent years, Logit-Logistic (Ogana, 2020). However, given that these functions utilize different parameter estimation techniques, different goodness-of-fit statistics, and different data, it is very likely that all of these have led to different conclusions. Therefore, there is no theoretical reason why there should be only one PDF for all possible situations (Wang and Rennolls, 2005).
The purpose of accurately modeling the diameter distribution of the stand, is to estimate the parameters of the PDF that determines the frequency by diameter class at a specific point in time (age or a particular year). Therefore, the parameters of the PDF can be estimated by two methods: (i) explicitly through parameter prediction, e.g., based on linear models; and (ii) with the indirect parameter recovery technique, which does not directly predict the parameters of the PDF, but whereby the functions estimate parameters that are directly related to the distribution, for example: central moments, non-central moments or a set of percentiles (Hyink and Moser, 1983).
Today, there are studies that compare the accuracy achieved with parameter prediction and recovery methods (Maldonado and Navar, 2002; Cao, 2004; Palahí et al., 2006; Jiang and Brooks, 2009); however, they have been developed in plantations and forest stands with one or two species. Therefore, few studies have been cited for the natural forests of the Western Sierra Madre, where there is a large mix of species (Corral-Rivas et al., 2015); hence the importance of studying methodologies to evaluate different alternatives for implicit modeling of growth and volume yield per unit area in the natural forests of southwestern Durango, Mexico.
The objective of the present contribution was to develop a strategy to adjust the Weibull, Beta and SB Johnson PDFs, as well as to reconstruct (modeling) the future diameter distribution with the parameter recovery method.
Materials and Methods
Study area
The study area was the La Victoria ejido, located in the southwest of the state of Durango, Mexico, between 105°25'39.465" W and 23°43'53.022" N. The altitude above sea level fluctuates between 2 400 and 2 850 m. The predominant climate is semi-cold temperate, with summer rains. The average annual rainfall varies from 900 to 1 200 mm, and the average annual temperature varies from 5 to 18 °C (García, 2004). The forests are made up of species of the Pinus, Quercus, Juniperus, Cupressus, Pseudotsuga, Arbutus and Alnus genera, which form mixed and irregular structures.
Data
Data were collected in 2017, during the timber forest management inventory, from 2 252 temporary sampling sites with a circular shape and a surface area of 0.10 ha each, located in the La Victoria ejido, in the municipality of Pueblo Nuevo, Durango, using a stratified systematic sampling design. A surface area of 10 876 ha divided into 518 management units (stands), was covered. The database included records of eight species of conifers: Pinus cooperi C. E. Blanco, P. durangensis Martínez, P. leiophylla Schiede ex Schltdl. & Cham., P. teocote Schied. ex Schltdl. & Cham., P. engelmannii Carrière, P. strobiformis Engelm., P. herrerae Martínez y Juniperus deppeana Steud.; and eight species of broadleaves: Alnus acuminata Kunth, Arbutus bicolor S. González, M. González & P. D. Sørensen, Quercus durifolia Seemen ex Loes., Q. sideroxyla Bonpl., Q. obtusata Bonpl., Q. coccolobifolia Trel., Q. viminea Trel. y Q. candicans Née.
For each tree with a normal diameter equal to or larger than 7.5 cm, the normal diameter was measured at 1.3 m (d, cm) with model 122450 Ben Meadows® diameter tapes; the total height of the tree (h, m) and of the stem without branches (h, m) was measured with the model Pm5/360pc SUUNTO® clinometer. These data were used to estimate the following variables: number of trees per hectare (N, trees ha-1), basimetric area (G, m2 ha-1), root mean square diameter (d g , cm), dominant height and diameter, estimated as the average of the 100 largest trees per hectare (H 0 , m and D0, cm, respectively) (Assmann 1970). Table 1 shows the main descriptive statistics of the database utilized in the adjustment of the PDFs.
Table 1 Summary of the database used in the adjustment and modeling of diametric distributions.
| Variable | Mean | Interval |
|---|---|---|
| Normal diameter (d, cm) | 19.6 | 7.9‒64.9 |
| Total height (h, m) | 10.2 | 6.5‒15.0 |
| Normal diameter asymmetry coefficient (cm) | 1.2 | -0.2‒4.0 |
| Kurtosis coefficient of the normal diameter (cm) | 4.4 | 1.5‒22.6 |
| Dominant height (H 0, m) | 17.9 | 12.7‒25.4 |
| Dominant diameter (D 0, m) | 39.1 | 28‒50.3 |
| Root Mean Squared Diameter (d g) | 22.3 | 15.8‒28.6 |
| Basimetric area per hectare (G, m2) | 24.5 | 13‒38.3 |
| Number of trees per hectare (N) | 630.6 | 400‒1 303 |
Models
Adjustment of the PDFs
The goodness of fit of three of the most widely used PDFs in forestry was tested (Gorgoso et al., 2012; Ogana, 2020), which are described below.
Two-parameter Weibull PDF
The two-parameter Weibull PDF has the following expression (Bailey and Dell, 1973):
Where:
F(x) = Cumulative relative frequency of the random variable
b and c = Scale and shape parameters, respectively
The parameters of the Weibull PDF were estimated by two methods: (i) maximum likelihood, and (ii) moments.
Maximum Likelihood (ML)
The commonly used method for estimating the parameters of the Weibull PDF with good estimates is ML, compared to other procedures (Sghaier et al., 2016). According to Nanos and Montero (2002), parameters b and c are solved with the following expressions:
Where:
n = Number of observations
x i = Normal diameter of each tree
The value of parameter c was calculated with Equation 2 using an iterative procedure, then the value of parameter b was obtained with Equation 3.
Moments Method (MM)
The MM consists of relating the parameters b and c of the Weibull PDF with the first and second moments of the diameter distribution (mean diameter and variance). Lei (2008) indicates that the parameters b and c are solved with the following expressions:
Where:
The value of parameter c in Equation 4 was estimated with an iterative procedure, after which the value of parameter b was obtained with Equation 5.
SB Johnson PDF
The SB Johnson PDF has the following expression (Johnson, 1949):
Where:
f(x) = Relative frequency of the random variable x
ln = Natural logarithm of base 10
The parameters of the SB Johnson PDF were determined by the moments method (MM) (Soares et al., 2003); the value of the location parameter was considered (
Where:
Sd(x) = Standard deviation of the distribution
Beta PDF
The general expression of the Beta PDF for a continuous random variable is as follows:
Where:
f(x) = Relative frequency of the random variable x
c = Function scale factor
The parameters of the Beta PDF were calculated using the moments method (Loetsch et al., 1973). The parameters were estimated based on the first and second moments of the distribution (arithmetic mean diameter
Where:
Parameter c is calculated as follows:
Where:
The parameters of the PDFs were obtained using the mledist function of the fitdistrplus package (Delignette-Muller y Dutang, 2015) implemented in R (R Core Team, 2020).
Evaluation of PDFs
The analysis of the PDFs' ability to fit was based on numerical and graphical comparisons of the errors (residuals). The statistics used for evaluating goodness-of-fit were as follows: (i) average bias (AB), whose optimal value is zero, implying that the deviations between the actual and predicted values are compensated for the total of the analyzed data, and (ii) Root Mean Square Error (RMSE), which is an indicator of accuracy: the lower the value, the smaller the difference between actual and predicted values (Gorgoso-Varela et al., 2020). The corresponding mathematical expressions are as follows:
Where:
n = Number of observations
p = Number of parameters of the PDF
AB and RMSE values were estimated for each PDF as the average of the relative frequencies of each diameter class (tabulated in 2 cm classes) for each sampling site and stand. The Kolmogorov-Smirnov (KS) test was used to validate whether the empirical and theoretical cumulative frequencies are similar (Sokal and Rohlf, 2012). The most notable maximum difference in absolute value between the two frequencies is given by the value of D n in the following expression:
Where:
F(x i ) and F * (x i ) = Cumulative empirical and theoretical distribution, respectively
The value of D n is compared to the one obtained from a table according to the number of data (n) and the chosen significance level (α=20 %).
Modeling of PDF parameters
The parameters of the future distribution were estimated using the moments method of Shifley and Lentz (1985), so that the parameters of the PDF are directly related to the moments of first and second order with respect to the origin; i.e. the average diameter
Given that the d
g
is always equal to or greater than
In the case of the SB Johnson and Beta PDFs, the parameter recovery using the moments method required fitting another equation that related the maximum diameter of the distribution to the stand variables estimated from the growth models [
Results and Discussion
Adjustment and evaluation of the PDFs
Table 2 presents the statistics used to evaluate the quality of the fit, as well as the number and percentage of sampling sites that passed the KS test for the evaluated PDFs.
Table 2 Goodness-of-fit of the probability density functions (PDFs) evaluated in the adjustment step.
| AB | RMSE | KS (n) | KS (%) | |
|---|---|---|---|---|
| Weibull (MM) | 0.10 | 0.29 | 1 595 | 70.8 |
| Weibull (ML) | 0.10 | 0.30 | 1 509 | 67.0 |
| S B Johnson | 0.11 | 0.30 | 1 351 | 60.0 |
| Beta | 0.16 | 0.96 | 742 | 32.9 |
AB = Average bias (cm); RMSE = Root mean square error; KS (n) and KS (%) = Number and percentage of plots that passed the Kolmogorov-Smirnov test out of a total of 2 252, respectively; MM = Moments method; ML = Maximum likelihood method.
The statistics reveal a significant difference between the ability of the Weibull PDF to fit the Beta and SB Johnson PDFs. This was demonstrated by the lower AB and RMSE values in all diameter classes and the higher percentage of sample sites passing the KS test at a significance level of 20 %. This gives a clear idea of the validity of using this distribution to adequately describe the wide range of shapes shown by the diameter distributions for this type of forest stands. Pece et al. (2000) suggest that the 20 % significance level of the KS test is the most demanding, as it reduces the minimum deviations for non-rejection of concordance.
The results reflect the flexibility and parsimony of the Weibull PDF because it only requires the estimation of two parameters, compared to the four that have to be estimated for the Beta and SB Johnson PDFs. Several authors also cite the flexibility of the Weibull PDF to describe a wide range of unimodal distributions (j-inverted, exponential and normal), furthermore, they highlight its ability to be expressed in its closed form, as a cumulative distribution function (mathematical simplicity) (Bailey and Dell, 1973; Reynolds et al., 1998; Maldonado and Návar, 2002; Liu et al., 2004; Palahí et al., 2006; Lei, 2008; Pogoda et al., 2019).
When analyzing the Weibull PDF adjustment methodologies, a marginal gain was observed in the number of plots that passed the KS test by using the MM (70.8 %), in contrast to the ML method (67.0 %). In this regard, papers such as the one by Corral-Rivas et al. (2015) confirm the suitability of the Weibull PFD adjustment according to the MM, compared to four alternative methodologies evaluated for the mixed and patchy forests of northwestern Durango. For their part, Sun et al. (2019) recommend estimating the parameters of this distribution with the method of moments and nonlinear regression for mixed and irregular masses in China.
For the detection of some kind of systematic pattern, the behavior of the PDFs was analyzed based on the evolution of the AB and RMSE in the prediction of the number of trees per diameter class (Figure 1).
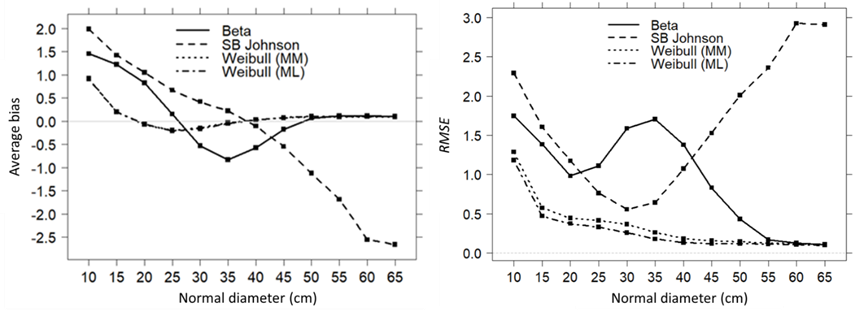
Figure 1 Evolution of the average bias and Root mean squared error (RMSE) in the prediction of trees by diameter class of the PDFs evaluated at the adjustment stage.
Figure 1 shows that the SB Johnson PDF exhibited the highest AB and RMSE values in the smaller diameter classes, indicating that it underestimates the frequencies in the smaller diameter classes and overestimates in the diameter classes above 45 cm. The Beta PDF also underestimates the lower frequencies and overestimates the intermediate frequencies (30-40 cm), improving its accuracy from the 45 cm diameter class upwards. Finally, the estimation of the frequencies with better precision over the whole interval of the observed diameter classes to have a very similar trend was achieved by adjusting the Weibull PFD according to the MM and the ML method.
When comparing the MM and ML adjustment methods of the Weibull PDF, we observed that there are no significant differences between the values of the goodness-of-fit statistics or their behavior in the prediction of the frequencies in the whole interval of the diameter classes. In their studies in northwestern Durango, Mexico and northwestern Spain, respectively, Gorgoso et al. (2012) and Quiñonez et al. (2015) obtained the best results with the MM and ML adjustment methods. Therefore, in order to select the Weibull PDF fitting methodology, the number of excluded plots was analyzed with the KS test, it was determined that the MM was slightly larger (70.8 %), therefore, the rest of the analyses are limited to this function with the parameters estimated with the MM for the modeling of the stand diameter distributions at any time interval.
Modeling of the diameter distribution
The estimation of the parameters (scale and shape) of the Weibull PDF using the parameter recovery methodology with the MM, exhibited simplicity and yielded desirable results according to the values of the evaluated goodness-of-fit statistics. Of the total number of sampling sites, 62 % passed the KS test at a significance level of 20 % (1 394 sampling sites). This result validates the Weibull PDF as suitable for adequately describing the wide range of shapes observed in the diametric distributions of forests under forest management at any stage of their development. Similar results were obtained by Siipilehto and Mehtätalo (2013), who compare methodologies for parameter recovery and prediction of the two-parameter Weibull PDF in Pinus sylvestris L. stands in Finland; they demonstrated that parameter recovery provides better compatibility with stand characteristics, especially as it estimates the volume per diameter class with greater precision. Furthermore, Quiñonez et al. (2015) show that in the case of incoetaneous masses with a mixture of species, the use of the MM for the recovery of the parameters of the Weibull PDF yields more accurate results.
Since the mean diameter of a stand is always less than or equal to its root mean square diameter, the adjustment relationship must meet this compatibility condition. For this purpose, it was determined that the mathematical model that meets this constraint has the following structure:
Where:
d g = Root mean square diameter (cm)
N = Number of trees per hectare
G = Basimetric area (m2 ha-1)
RS = Relative spacing index (%)
β i = Parameters to be estimated
The fit of Equation 19 was good, given that the values of the coefficient of determination (R 2 ) and of the RMSE were 0.933 and 0.722 cm, respectively. Table 3 shows the estimated values of the parameters with Equation 19.
Table 3 Parameters estimated with the mean stand diameter prediction model.
| Parameter | Estimator | Standard error | t for H0 (Parameter=0) | Prob>F |
|---|---|---|---|---|
| β 0 | 0.69223 | 0.06014 | 11.51 | 0.0001 |
| β 1 | -0.00085 | 0.00008 | -11.08 | 0.0001 |
| β 2 | 0.01293 | 0.00217 | 5.96 | 0.0001 |
| β 3 | 0.02963 | 0.00379 | 7.82 | 0.0001 |
Figure 2 shows the validation process derived from the representation of the evolution of the average bias and the Root Mean Square Error by diameter classes obtained in the adjustment and modeling stage of the Weibull PDF.
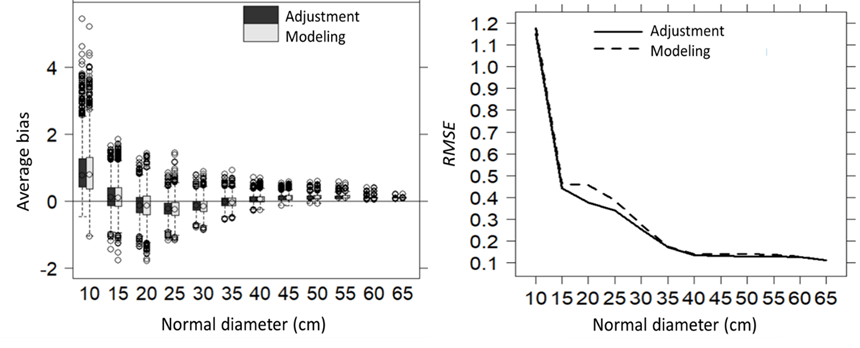
Figure 2 Evolution of the average bias and the root mean square error by diameter class with the Weibull PDF in the fitting and modelling phase.
Figure 2 compares the error in terms of the number of predicted trees per diameter class, showing that the largest deviations overestimate and are located in the diameter classes below 15 cm. The reason may be the result of the influence of silvicultural interventions and the effect of competition on young stands with different species mixtures. This same behavior was observed by Corral-Rivas et al. (2015) for conifer and broadleaf stands in northeastern Durango, Mexico. Therefore, since these are stands with the highest number of trees per unit area, any change in their structure increases their variation. In this regard, Sandoval et al. (2012) conclude that the accuracy in the prediction of diameter structures with the Weibull PDF increases with the age of the plantation of three dendroenergetic species in Chile.
The results of the present study are very similar to those documented by Sun et al. (2019) for mixed and patchy stands in China, where the intermediate clear-cutting of Pinus tabulaeformis Carrière resulted in stands with a bimodal distribution.
Conclusions
The methodology selected to estimate the parameters of the (two-parameter) Weibull PDF allows estimating with adequate precision the category corresponding to the number of trees per diameter at the unit area level. The recovery of parameters of the Weibull PDF with the moments method is efficient and suggests that the diameter structures have a unimodal behavior and can be used to estimate the products that will be obtained from the forest at a given time (age), therefore it represents a useful silvicultural tool for planning a sustainable forest management of mixed and irregular stands in southwestern Durango, Mexico. The parsimony (simplicity) of the PDF is a desirable feature to implement in an empirical model with sufficient potential to be of practical use in the study area.
Notably, at the modeling stage, a percentage of the masses studied (38 %) did not pass the KS test; this affords an opportunity for future work on the study of bimodal distribution functions to cover this type of structures.
Acknowledgements
Thanks to Conacyt for the financial support given to the first author to study the Master's program at the Instituto Tecnológico de El Salto / Tecnológico Nacional de México.
REFERENCES
Assmann, E. 1970. The principles of forest yield study: studies in the organic production, structure, increment and yield of forest stands. Pergamon Press. New York, NY, USA. 506 p. [ Links ]
Bailey T., R. L. and R. Dell. 1973. Quantifying diameter distributions with the Weibull function. Forest Science 19(2):97-104. Doi: 10.1093/forestscience/19.2.97. [ Links ]
Cao, Q. V. 2004. Predicting parameters of a Weibull function for modeling diameter distribution. Forest Science 50(5):682-685. Doi: 10.1093/forestscience/50.5.682. [ Links ]
Corral-Rivas, S., J. G. Álvarez-González, J. J. Corral-Rivas and C. A. López-Sánchez. 2015. Characterization of diameter structures of natural forests of northwest of Durango, Mexico. Revista Chapingo Serie Ciencias Forestales y del Ambiente 21(2):221-236. Doi: 10.5154/r.rchscfa.2014.10.046. [ Links ]
Delignette-Muller, M. L. and C. Dutang. 2015. fitdistrplus: An R package for fitting distributions. Journal of Statistical Software 64(4):1-34. Doi: 10.18637/jss.v064.i04. [ Links ]
Frazier, J. R. 1981. Compatible whole-stand and diameter distribution models for loblolly pine plantations. PhD thesis. School of Forestry and Wildlife, Virginia Polytechnic Institute and State University. Blackburg, VA, USA. 125 p. [ Links ]
García, M. E. 2004. Modificaciones al sistema de clasificación climática de Köppen. Instituto de Geografía, Universidad Nacional Autónoma de México. Coyoacán, México, D. F., México. 91 p. [ Links ]
González-Elizondo, M. S., M. González-Elizondo, J. A. Tena-Flores, L. Ruacho-González e I. L. López-Enríquez. 2012. Vegetación de la sierra madre occidental, México: Una síntesis. Acta Botánica Mexicana 100:351-403. Doi: 10.21829/abm100.2012.40. [ Links ]
Gorgoso, J. J., A. Rojo, A. Camara-Obregon and U. Dieguez-Aranda. 2012. A comparison of estimation methods for fitting Weibull, Johnson’s SB and beta functions to Pinus pinaster, Pinus radiata and Pinus sylvestris stands in northwest Spain. Forest Systems 21(3):446-459. Doi: 10.5424/fs/2012213-02736. [ Links ]
Gorgoso-Varela, J. J., F. N. Ogana and P. O. Ige. 2020. A comparison between derivative and numerical optimization methods used for diameter distribution estimation. Scandinavian Journal of Forest Research 35(3-4):1-9. Doi: 10.1080/02827581.2020.1760343. [ Links ]
Hyink, D. M. and J. W. Moser. 1983. A generalized framework for projecting forest yield and stand structure using diameter distributions. Forest Science 29(1):85-95. Doi: 10.1093/forestscience/29.1.85. [ Links ]
Jiang, L. and J. R. Brooks. 2009. Predicting diameter distributions for young longleaf pine plantations in Southwest Georgia. Southern Journal of Applied Forestry 33(1):25-28. Doi: 10.1093/sjaf/33.1.25. [ Links ]
Johnson, N. L. 1949. Systems of frequency curves generated by methods of translation. Biometrika 36(1-2):149-176. Doi: 10.2307/2332539. [ Links ]
Lei, Y. 2008. Evaluation of three methods for estimating the Weibull distribution parameters of Chinese pine (Pinus tabulaeformis). Journal of Forest Science 54(12):566-571. Doi: 10.17221/68/2008-JFS. [ Links ]
Liu, C., S. Y. Zhang, Y. Lei, P. F. Newton and L. Zhang. 2004. Evaluation of three methods for predicting diameter distributions of black spruce (Picea mariana) plantations in central Canada. Canadian Journal of Forest Research 34(12):2424-2432. Doi: 10.1139/x04-117. [ Links ]
Loetsch, F., K. E. Haller and F. Zöhrer. 1973. Forest inventory 2. Inventory data collected by terrestrial measurements and observations, data processing in forest inventory. The sample plot, plotless sampling and regeneration survey. List sampling with unequal probabilities and planning, performan. Verlagsgesellschaft BLV. Munich, BY, Germany. 469 p. [ Links ]
Maldonado A., D., y J. Návar C. 2002. Ajuste y predicción de la distribución Weibull a las estructuras diamétricas de plantaciones de pino de Durango, México. Madera y Bosques 8(1):61-72. Doi: 10.21829/myb.2002.811306. [ Links ]
Nanos, N. and G. Montero. 2002. Spatial prediction of diameter distributions models. Forest Ecology and Management 161(1-3):147-158. Doi: 10.1016/S0378-1127(01)00498-4. [ Links ]
Ogana, F. N. 2020. A percentile-based estimator for the log-logistic function: Application to forestry. Forestry Studies|Metsanduslikud Uurimused 72(1):107-120. Doi: 10.2478/fsmu-2020-0009. [ Links ]
Palahí, M., T. Pukkala and A. Trasobares. 2006. Modelling the diameter distribution of Pinus sylvestris, Pinus nigra and Pinus halepensis forest stands in Catalonia using the truncated Weibull function. Forestry: An International Journal of Forest Research 79(5):553-562. Doi: 10.1093/forestry/cpl037. [ Links ]
Pece, M. G., C. G. de Benítez y M. J. de Galíndez. 2000. Uso de la función Weibull para modelar distribuciones diamétricas en una plantación de Melia azedarach. Revista Forestal Venezolana 44(2):49-52. http://www.saber.ula.ve/bitstream/handle/123456789/24167/articulo44_2_5.pdf?sequence=1&isAllowed=y . (25 de junio de 2022). [ Links ]
Pogoda, P., W. Ochal and S. Orzel. 2019. Modeling diameter distribution of Black Alder (Alnus glutinosa (L.) Gaertn.) Stands in Poland. Forests 10(5):1-16. Doi: 10.3390/f10050412. [ Links ]
Quiñonez B., G., H. M. De los Santos P., F. Cruz C., A. Velázquez M., G. Ángeles P. y G. Ramírez V. 2015. Modelación dinámica de distribuciones diamétricas en masas mezcladas de Pinus en Durango, México. Madera y Bosques 21(2):59-71. Doi: 10.21829/myb.2015.212445. [ Links ]
R Core Team. 2020. R: A language and environment for statistical computing. Vienna, Austria. R Foundation for Statistical Computing. https://www.r-project.org/ . (12 de mayo de 2020). [ Links ]
Reynolds, M. R., T. E. Burk and W-C. Huang. 1998. Goodness-of-fit tests and model selection procedures for diameter distribution models. Forest Science 34(2):373-399. Doi: 10.1093/forestscience/34.2.373. [ Links ]
Sandoval, S., J. Cancino, R. Rubilar, E. Esquivel, E. Acuña, F. Muñoz and M. Espinosa. 2012. Probability distributions in high-density dendroenergy plantations. Forest Science 58(6):663-672. Doi: 10.5849/forsci.11-028. [ Links ]
Soares S., J. R., F. C. Vitti T., R. L. Grisi de M., F. W. Acerbi Jr. and A. L. de Assis. 2003. SB distribution´s accuracy to represent the diameter distribution of Pinus taeda, through five fitting methods. Forest Ecology and Management 175(1-3):489-496. Doi: 10.1016/S0378-1127(02)00183-4. [ Links ]
Secretaría del Medio Ambiente y Recursos Naturales (Semarnat). 2021. Anuario Estadístico de la Producción Forestal 2018. Semarnat-Dirección General de Gestión Forestal y de Suelos. Miguel Hidalgo, CdMx, México. 298 p. [ Links ]
Sghaier, T., I. Cañellas, R. Calama and M. Sánchez-González. 2016. Modelling diameter distribution of Tetraclinis articulata in Tunisia using normal and Weibull distributions with parameters depending on stand variables. iForest Biogeosciences and Forestry 9(5):702-709. Doi: 10.3832/ifor1688-008. [ Links ]
Shifley, S. and E. Lentz. 1985. Quick estimation of the three-parameter Weibull to describe tree size distributions. Forest Ecology and Management 13(3-4):195-203. Doi: 10.1016/0378-1127(85)90034-9. [ Links ]
Siipilehto, J. and L. Mehtätalo. 2013. Parameter recovery vs. parameter prediction for the Weibull distribution validated for Scots pine stands in Finland. Silva Fennica 47(4):1-22. Doi: 10.14214/sf.1057. [ Links ]
Sokal, R. R. and F. J. Rohlf. 2012. Biometry. The principles and practice of statistics in biological research. W.H. Freeman and Company. New York, NY, USA. 915 p. [ Links ]
Sun, S., Q. V. Cao and T. Cao. 2019. Characterizing diameter distributions for uneven-aged pine-oak mixed forests in the Qinling Mountains of China. Forests 10(7):596. Doi: 10.3390/f10070596. [ Links ]
Wang, M. and K. Rennolls. 2005. Tree diameter distribution modeling: Introducing the logit - logistic distribution. Canadian Journal of Forest Research 35(6):1305-1313. Doi: 10.1139/x05-057. [ Links ]
Received: July 13, 2021; Accepted: July 18, 2022
 Este es un artículo publicado en acceso abierto bajo una licencia Creative Commons
