


Servicios Personalizados
Revista
Articulo
 texto en
  Inglés (pdf)
 Artículo en XML
 Referencias del artículo
 Enviar artículo por email
Indicadores
-
 Citado por SciELO
 -
 Accesos
Links relacionados
-
 Similares en
SciELO
Similares en
SciELO
Compartir

 Permalink
Revista mexicana de ciencias forestales
versión impresa ISSN 2007-1132
Rev. mex. de cienc. forestales vol.13 no.70 México mar./abr. 2022 Epub 09-Mayo-2022
https://doi.org/10.29298/rmcf.v13i70.1163
Scientific article
Influence of altitude and exposure on the structure and composition of a temperate forest in the state of Durango
1Facultad de Ciencias Forestales, Universidad Autónoma de Nuevo León. México.
2Instituto Tecnológico del El Salto. México.
3Facultad de Ciencias Forestales, Universidad Juárez del Estado de Durango. México
Geographic variables can largely determine species structure and diversity. The objective of the study was to determine whether there are differences between the components that make up the structure, diversity, and floristic composition in relation to exposure and altitude in temperate forests of the state of Durango. The mensuration data were obtained from 30 permanent sites (2 500 m2), considering a normal diameter (Nd)> 7.5 cm (at 1.30 m), total height, and the record by species. 6 areas distributed at three altitudinal intervals (500 m) with South and North exposure were defined. The structure was characterized based on the Importance Value Index (IVI), alpha diversity (α) with richness of species (S), and the Shannon true diversity index (1 D), as well as beta diversity (β) determined by means of a Bray-Curtis similarity analysis. A two-factor ANOVA statistical test was performed to find significant differences between altitude intervals in the different areas. The areas with a higher altitude had higher density and basimetric area in both exposures, except for area 5 (1 500 to 1 800 m south), which showed similar values in basal area. The Pinus and Quercus genera showed a higher IVI in all areas. The sites with a southern exposure had a greater richness of species, especially those located at the lowest altitude interval. The similarity between areas comprised the zones with the highest altitude and northern exposure, isolating the lowlands with different altitude ranges.
Keywords ANOVA; density; diversity; interval; richness of species; similarity
Las variables geográficas determinan en gran medida la estructura y diversidad de especies. El objetivo del estudio fue conocer si existen diferencias entre los componentes que conforman la estructura, diversidad y composición florística con relación a la exposición y altitud en bosques templados del estado de Durango. Los datos dasométricos se obtuvieron de 30 sitios permanentes (2 500 m2), se consideraron: diámetro normal (Dn)>7.5 cm (1.30 m), altura total, y el registro por especie. Se definieron seis áreas distribuidas en tres intervalos altitudinales (500 m) con exposición sur y norte. Se caracterizó la estructura por medio del Índice de Valor de Importancia (IVI), diversidad alfa (α), riqueza de especies (S) y el Índice de Diversidad Verdadera de Shannon (1 D), así como la diversidad beta (β) por medio del análisis de similitud de Bray-Curtis. Se realizó una prueba estadística de ANOVA de dos factores para determinar diferencias significativas entre intervalos de altitud en las áreas; las de mayor altitud tuvieron más densidad y área basal en ambas exposiciones, con excepción del área 5 (1 500 a 1 800 m sur) que mostró valores similares en área basal. Los géneros Pinus y Quercus presentaron un IVI superior en todas las áreas. Los sitios en exposición sur registraron una mayor riqueza de especies, sobre todo los que se ubicaron en el intervalo de menor altitud. La similitud entre áreas comprendió las zonas con más altitud y exposición norte, y se aislaron las tierras bajas con intervalos altitudinales diferentes.
Palabras clave ANOVA; densidad; diversidad; intervalo; riqueza de especies; similitud
Introduction
Forests and tropical rainforest provide important environmental goods and services, which can contribute to the improvement of the local economy (Méndez et al., 2018). Temperate forests are ecosystems with great diversity in the American continent; they extend from the United States of America to Honduras (Mora-Donjuán y Alanís-Rodríguez, 2016).
Knowledge of the structure and composition of plant communities is fundamental, as it allows the creation of strategies that promote the growth and development of forest stands, ensuring rational use without compromising the original scenarios (Aguirre-Calderón, 2015; Manzanilla et al., 2020). In addition, it is necessary to know the richness, composition and degree of similarity of the communities (Domínguez et al., 2018), as well as the components that influence diversity and richness, the most prominent of which are the environmental factors and the physical land characteristics (Saldaña, 2013).
Species diversity may decrease towards higher latitudes and altitudes (Malizia et al., 2020). García-Aguilar et al. (2017) confirm that the development capacity of forests is closely linked to the physical conditions of the terrain. Likewise, McIntire et al. (2016) confirm that exposure is a limiting factor for the establishment of shade-intolerant species.
At present, several studies have been carried out on the floristic structure and composition in forest ecosystems, which focus on changes in the altitudinal gradient (Alves et al., 2010; Rascón et al., 2018). However, the influence of geographic exposure has not been considered, resulting in insufficient information about Mexico.
Therefore, the objective of this research was to determine differences in the structure, richness, composition and degree of similarity of plant communities, with regard to exposure and altitude range in a temperate forest in the state of Durango. The following hypotheses are analyzed: (i) the northern exposure will record higher values of basal area; (ii) as altitude increases, the richness and diversity of species will decrease, and (iii) the degree of similarity in the species composition will be defined by exposure.
Materials and Methods
The study area was located in the mountain system called Western Sierra Madre in the state of Durango, between the geographic coordinates 26°26'25.7" N, and 106°03'57.5" W, and 23°10'29.5" N and 105°22'09.2" W (Figure 1).

According to the Köppen classification modified by García (1988), the predominant climate types in the area are temperate sub-humid, with four subdivisions: (A)c(w2), (A)c(w1), C(E)(w2), and C(E)(w2)(x'). Temperature variation ranges from 12 to 18 °C, with the exception of some areas with values of 10 to 12 °C; rains usually occur in summer and droughts in winter (Quiñones et al., 2012). The soil types form associations between Regosol, Lithosol, Cambisol, and Phaeozem (INEGI, 2007). The existing vegetation types are pine forest, oak forest, pine-oak forest, oak-pine forest, and shrub secondary vegetation in all plant communities (González et al., 2012).
Data collection and analysis
The mensuration information was obtained from 30 permanent forest monitoring plots of 2 500 m2 each, randomly located in six areas, three altitudinal intervals (between 1 500 and 3 000 m), with five plots per exposure (north and south). The normal diameter (Nd> 7.5 cm) was considered, which was measured with a Ben Meadows 122450 diametric tape; total height (H), measured with a Suunto Pm5/360pc clinometer, and the record by species. The scientific names were corroborated in the website The Plant List (http://www.theplantlist.org/).
The Ecological Importance Value Index (EVI) was calculated for each area; percentage values in the range of 0 to 100 were obtained (Alanís-Rodríguez et al., 2020) by species, based on the sum of the relative structural parameters of abundance (density), frequency and basal area (33; Moreno, 2001). Species richness was determined using the Margalef Index and alpha diversity was estimated using the Shannon True Diversity Index (Jost, 2006). Each of the parameters was calculated using the equations in Table 1.
Table 1 Equations to calculate structure and diversity parameters.
| Parameter | Equation | Description |
|---|---|---|
| Abundance |
|
A
i
= Absolute abundance RA i = Relative abundance of species i with respect to the total abundance N i = Number of individuals of species i S = Sampling area (ha) |
| Frequency |
|
F
i
= Absolute frequency RF i = Relative frequency of species i with respect to the total frequency P i = Number of sites where species i is present NS = Total number of sampling sites |
| Basal area |
|
D
i
= Absolute dominance RD i = Relative dominance of species i with respect to the total dominance B a = Basal area of species i S = Surface area (ha) |
| EVI |
|
RA
i
= Relative abundance RF i = Relative frequency RD i = Relative dominance |
| Margalef Index |
|
S = Number of species present N = Total number of individuals n = Number of individuals of species i |
| Shannon true diversity index |
1 D = 𝑒𝑥𝑝(𝐻´) |
pi= Proportional abundance of the i
th
species n i = Number of individuals per species N = Total number of individuals present 1 D = Shannon true diversity index exp = Exponential H´ = Shannon diversity index |
The verification of compliance with the assumptions of normality of the residuals was based on the Shapiro-Wilk statistical test; in addition, the homogeneity of variances was checked by means of the Levene's test. A two-factor analysis of variance (ANOVA) was applied (exposure and altitude interval) in order to determine the differences between areas. Tukey's multiple comparisons test was used to determine differences at the significance level of p<0.05. Statistical analyses were performed using IBM© SPSS© Statistic software version 19 (Zar, 2010).
In order to calculate the beta diversity, defined as the replacement of species in communities with different environmental scenarios (Whittaker, 1972), a classification model was developed using sample similarity algorithms; the percentage of similarity between the samples (0 % to 100 %) was estimated by means of the Bray-Curtis similarity dendrogram, which is suitable for the analysis of the behavior of plant species (Rascón et al., 2018). The analysis was carried out with the Past 4.01 software (Hammer, 2001), using the abundance parameter in the different altitude intervals by area as a grouping matrix.
Results
Forty-eight species were registered (Table 2), distributed into eight families; of these, Fagaceae had the highest number of taxa and comprised 39.58 % of the total, followed by Pinaceae, with 31.25 %. Convolvulaceae and Betulaceae had the lowest values.
Table 2 List of tree species present in the study area.
| Family | Species |
|---|---|
| Betulaceae | Alnus jorullensis Kunth |
| Convolvulaceae | Ipomoea arborescens Humb. et Bonpl. |
| Cupressaceae | Juniperus deppeana Steud. |
| Cupressaceae | Cupressus lusitanica Mill. |
| Ericaceae | Arbutus arizonica (A. Gray) Sarg. |
| Ericaceae | Arbutus bicolor S. González, M. González & P.D. Sorensen |
| Ericaceae | Arbutus madrensis S. González |
| Ericaceae | Arbutus tesselata P.D. Sorensen |
| Ericaceae | Arbutus xalapensis Kunth |
| Ericaceae | Comarostaphylis polifolia Kunth |
| Fabaceae | Lysiloma acapulcense Benth. |
| Fabaceae | Acacia pennatula Benth. |
| Fagaceae | Quercus albocincta Trel. |
| Fagaceae | Quercus castanea Née |
| Fagaceae | Quercus coccolobifolia Trel. |
| Fagaceae | Quercus crassifolia Humb. & Bonpl. |
| Fagaceae | Quercus depressipes Trel. |
| Fagaceae | Quercus durifolia Seemen ex Loes. |
| Fagaceae | Quercus elliptica Née |
| Fagaceae | Quercus fulva Liebm. |
| Fagaceae | Quercus gentryi C. H. Mull. |
| Fagaceae | Quercus jonesii Trel. |
| Fagaceae | Quercus laeta Liebm. |
| Fagaceae | Quercus obtusata Humb. & Bonpl. |
| Fagaceae | Quercus resinosa Liebm. |
| Fagaceae | Quercus rugosa Née |
| Fagaceae | Quercus salicifolia Benth. |
| Fagaceae | Quercus scytophylla Liebm. |
| Fagaceae | Quercus sideroxyla Bonpl. |
| Fagaceae | Quercus urbanii Trel. |
| Fagaceae | Quercus viminea Trel. |
| Pinaceae | Pinus arizonica Engelm. |
| Pinaceae | Pinus cembroides Zucc. |
| Pinaceae | Pinus chihuahuana Martínez |
| Pinaceae | Pinus cooperi C.E. Blanco |
| Pinaceae | Pinus douglasiana Martínez |
| Pinaceae | Pinus durangensis Martínez |
| Pinaceae | Pinus engelmannii Carrière |
| Pinaceae | Pinus herrerae Martínez |
| Pinaceae | Pinus leiophylla Schiede ex Schltdl. et Cham. |
| Pinaceae | Pinus lumholtzii B. L. Rob et Fernald |
| Pinaceae | Pinus luzmariae Pérez de la Rosa |
| Pinaceae | Pinus oocarpa Schiede ex Schltdl. |
| Pinaceae | Pinus strobiformis Engelm. |
| Pinaceae | Pinus teocote Schiede ex Schltdl. et Cham. |
| Pinaceae | Pseudotsuga menziesii (Mirb.) Franco |
| Rosaceae | Crataegus mexicana DC. |
| Rosaceae | Prunus serotina Ehrh. |
Abundance (density). Areas 1 and 2 exhibited higher values. On the southern exposure, the species with the highest abundance were: P. arizonica Engelm., with 600 ind ha-1, and J. deppeana Steud., with 66 ind ha-1. On the northern exposure, P. arizonica had 344 ind ha-1, and Q. sideroxyla Bonpl., 111 ind ha-1. Areas 3 and 5 showed similarity in the total number of individuals per hectare. The most abundant taxa in area 3 were Q. laeta Liebm., with 122 ind ha-1, and P. leiophylla Schiede ex Schltdl. et Cham., with 68 ind ha-1. In area 5, P. durangensis and P. oocarpa Schiede ex Schltdl. had a greater presence (Table 3). Areas 4 and 6 recorded a difference compared to the higher altitude intervals (p<0.05). In area 4, the species with the highest density were Q. crassifolia Humb. & Bonpl., with 121 ind ha-1 and P. leiophylla, with 83 ind ha-1. In area 6, the most abundant taxa were P. durangensis, with 77 ind ha-1, and Q. resinosa Liebm., with 47 ind ha-1.
Table 3 Estimated structural parameters by area and altitude range (IVI ordered from highest to lowest percentage value, only the three species with the highest value are included).
| Exposure/Altitude | Species | Density | Frequency | Dominance (Basal area) | IVI | |||
|---|---|---|---|---|---|---|---|---|
| Absolute (N ha-1) |
Relative (%) |
Absolute | Relative (%) |
Absolute (m2 ha-1) |
Relative (%) |
|||
| South 2 700-3 000 masl (Area 1) | P. arizonica | 600 | 75.6 | 5 | 25 | 21.26 | 74.98 | 58.53 |
| J. deppeana | 66 | 8.27 | 5 | 25 | 0.15 | 5.32 | 12.86 | |
| P. strobiformis | 32 | 4.03 | 4 | 20 | 1.51 | 4.02 | 9.35 | |
| North 2 700-3 000 masl (Area 2) | P. arizonica | 344 | 45.03 | 4 | 13.33 | 8.9 | 31.71 | 30.02 |
| Q. sideroxyla | 111 | 14.55 | 5 | 16.67 | 8.81 | 31.38 | 20.87 | |
| A. xalapensis | 73 | 9.53 | 3 | 10 | 2.02 | 7.2 | 8.91 | |
| South 2 100-2 400 masl (Area 3) | Q. laeta | 122 | 24.21 | 3 | 10.71 | 4.65 | 19.28 | 18.04 |
| P. leiophylla | 68 | 13.49 | 2 | 7.14 | 4.22 | 17.5 | 12.71 | |
| Q. sideroxyla | 58 | 11.51 | 1 | 3.57 | 4 | 16.6 | 10.53 | |
| North 2 100-2 400 masl (Area 4) | Q. crassifolia | 121 | 29.38 | 2 | 5.56 | 2.25 | 14.32 | 16.42 |
| P. teocote | 50 | 12.26 | 4 | 11.11 | 2.72 | 17.29 | 13.55 | |
| P. leiophylla | 66 | 16.15 | 2 | 5.56 | 2.94 | 18.75 | 13.49 | |
| South 1 500-1 800 masl (Area 5) | P. durangensis | 206 | 39.24 | 2 | 7.14 | 14.29 | 47.97 | 31.47 |
| P. oocarpa | 177 | 33.74 | 3 | 10.71 | 5.99 | 20.12 | 21.53 | |
| Q. viminea | 8 | 1.53 | 3 | 10.71 | 0.62 | 2.08 | 4.78 | |
| North 1 500-1 800 masl (Area 6) | P. durangensis | 76.8 | 21.92 | 2 | 8.33 | 3.36 | 21.06 | 17.1 |
| Q. gentryi | 25.6 | 7.31 | 2 | 8.33 | 1.49 | 9.35 | 8.33 | |
| P. oocarpa | 26.4 | 7.53 | 2 | 8.33 | 1.41 | 8.88 | 8.25 | |
Basimetric area. The southern exposure exhibited the largest basal area in the three altitude intervals. In interval 1 (2 700-3 000 m), the average was 56.42 m2 ha-1; P. arizonica stood out with 21.26 m2 ha-1 in area 1 (Table 3). The ANOVA test showed no significant differences for areas 4 and 6; however, the average was lower, of 15.70 m2 ha-1 and 15.94 m2 ha-1, respectively. The species with the largest basimetric area were P. leiophylla, with 2.94 m, and P. durangensis, with 3.36 m2 ha-1 (Figure 2B).

Figure 2 Means and standard error of (A) Abundance (ind ha-1), (B) Basimetric area (m2 ha-1), (C) Richness of species (S), (D) Shannon True Diversity Index (1 D), (E), Margalef Index (D mg ). Means with different letters (a, b) indicate differences (p<0.05).
Ecological importance value index (EVI). The Pinus and Quercus genera exhibited the highest percentages of IVI; P. arizonica reached the highest percentage in the interval 1, north and south; Q. laeta Liebm., on the southern exposure, and Q. crassifolia, on the northern exposure, dominated the mean altitude interval. In the lowest height interval, the highest IVI was obtained by P. durangensis; Table 3 shows the three most important species by area.
The dendrogram of plant communities by altitude intervals showed that there is 65 % similarity between areas 1 and 2, with 65 %, and 46 % between areas 4 and 6 (Figure 3). This indicates a similar floristic composition in these areas, where the dominant species tend to be the same as in other areas. Likewise, the southern exposure of area 5 exhibited lower similarity values compared to the rest of the areas; as a rule, the exposure is precisely what defines the degree of similarity between sites located at lower altitudes. The generalist species found in both exposures and within the three altitudinal intervals were P. durangensis, Q. sideroxyla Bonpl., J. deppeana, and A. xalapensis Kunth. At sites with lower altitudes, the species varied by type of exposure: Q. coccolobifolia Trel. occurred on the northern exposure, and A. pennatula Benth., L. acapulcense Benth., P. serotina Ehrh., and I. arborescens Humb. et Bonpl., on the southern exposure.
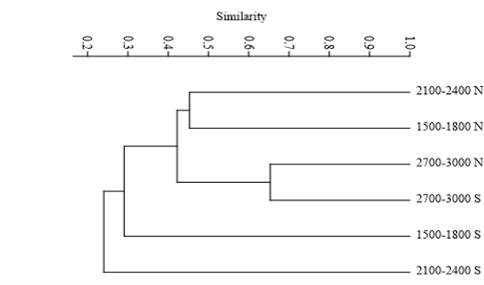
Figure 3 Dendrogram of similarity based on a Bray-Curtis analysis between areas with different altitudinal ranges.
Richness. Differences (p<0.05) were found between areas 1 and 4, with a lesser number of species at sites with a higher altitude; the number of species within area 4 was observed to be around twice as high as in area 1. In the remaining areas, the average interval was five taxa per site (Figure 2C).
Diversity indexes. Shannon's true diversity showed no differences (p<0.05) between areas, with an average of 2.94 ± 1.58 on the southern exposure and 3.89 on the northern exposure (Figure 2D). Regarding the Margalef index, differences (p<0.05) were observed in the areas located at a higher altitude with respect to lower areas. The average values were 0.73 for both exposures in interval 1, and 0.98, in interval 3 (Figure 2E).
Discussion
The results obtained for density agree with those cited by Delgado et al. (2016), who estimated 565 ind ha-1 and 16 taxa in temperate forests of Durango, within an altitudinal range of 2 400 to 2 500 m. On the other hand, López-Hernández et al. (2017) registered lower values, 389 ind ha-1 and 11 species in forests in the state of Puebla; this can be attributed to the fact that the evaluated forests exhibit more intensive harvesting activities than those of the present study.
The basimetric area was found to increase as altitude does, as confirmed by Muñoz et al. (2020); exposure and slope can also influence the productivity of different areas. Results of the study show that the basimetric area is larger at sites with higher altitudes, with values up to twice as high. Results are similar to those obtained by Graciano-Ávila et al. (2017), who estimated a similar basimetric area in temperate forests of Durango, Mexico.
In most temperate forests of Mexico, Pinus and Quercus tend to be the most prevalent genera, as they include a greater number of species which have more dominant mensuration variables and, therefore, tend to have a higher value of ecological importance (Domínguez et al., 2018). In this case, there were variations in the species with a higher IVI value; thus, areas located at both higher and lower altitudes registered higher EVIs in Pinus, a result that agrees with those obtained by Hernández-Salas et al. (2013) and Graciano-Ávila et al. (2019), who report P. durangensis as the most ecologically important species in the forests of Chihuahua and Durango. Paredes et al. (2019) coincide with the results obtained in the present study and cite Q. crassifolia as the most ecologically important taxon in a temperate rainforest in Hidalgo.
Altitude, slope and exposure have a great influence on the floristic composition and species richness of plant communities. Siles et al. (2017) recorded 27 taxa over an altitudinal gradient of 1 300 to 1 500 m; these data are similar to those documented in the present study, in which 18 to 23 species were found to occur within the lower altitudinal range. Likewise, authors such as Castellanos-Bolaños et al. (2019) agree that the higher the altitude, the lower the number of taxa.
Regarding diversity, Domínguez et al. (2018) indicate similar records at similar altitudes for a temperate forest in the Ruiz Cortinez ejido, in the region of El Salto, Durango, where the values obtained for diversity are similar to those of the present study.
In order to assess the diversity and wealth of species among communities, it is necessary to know the biological characteristics and their proportional distribution (Moreno, 2001). The value of the Margalef index was lower at higher altitudes, as shown by Báez et al. (2015), who indicate that low temperatures and topographical features contribute to the decline of species. Likewise, the high number of taxa at lower altitudes is similar to that estimated by Clark et al. (2015), who report a large wealth of species in plots located at low altitudes.
According to Zarco et al. (2010), exposure influences the development of different species, particularly at medium and low altitudes; this information is in agreement with that recorded in the present study, where the number of taxa was found to be higher on the southern exposure.
The similarity between communities is linked to altitude and exposure, among other factors (Chust et al., 2006) that determine which species can adapt to different plant communities. Accordingly, it is possible to observe both generalist and specialist species adapted to different areas with particular conditions.
Hernández et al. (2013) indicate that the grouping depends, to a large extent, on the degree of adaptation of the taxa, so that different species of conifers and oaks may occur in sites with different characteristics. The above confirms the data obtained for different species of Pinus and Quercus, which are present in all the areas studied. Likewise, we agree with Delgado et al. (2016), who point out the occurrence of particular species established in very clearly defined microhabitats, given that in this study certain taxa were observed only in low altitude intervals and on the southern exposure.
Conclusions
The basal area does not exhibit significant differences between the different areas and altitudinal ranges. However, the density is higher at sites with a higher altitude, contradicting the hypothesis put forward at the beginning of the study.
Regarding the wealth and diversity of species, the hypothesis is fulfilled, since these are greater in areas with a southern exposure. Similarly, sites at lower altitudes have the highest number of species, and both generalist and specialist species are identified in specific areas.
The results indicate that, within the areas evaluated in the different altitudinal intervals, the structure, floristic composition, and wealth of species are strongly influenced by the topographic characteristics of the terrain. It is possible to identify that the degree of similarity of plant communities varies according to the altitudinal range and slope exposure, where temperature can support or hinder the development of species.
Referencias
Aguirre-Calderón, O. A. 2015. Manejo Forestal en el Siglo XXI. Madera y Bosques 21: 17-28. Doi: https://doi.org/10.21829/myb.2015.210423. [ Links ]
Alanís-Rodríguez, E., E. A. Rubio-Camacho y J. S. Marroquin-de la Fuente. 2020. Muestreo ecológico de la vegetación. Ed. Universitaria UANL. Monterrey, NL., México. 204 p. [ Links ]
Alves L., F., S. A. Vieira, M. A. Scaranello, P. B. Camargo, F.A. A. Santos, C. A. Joly and L. A. Martinelli. 2010. Forest structure and live aboveground biomass variation along an elevational gradient of tropical Atlantic moist forest (Brazil). Forest Ecology and Management 260(5): 679-91. Doi: https://doi.org/10.1016/j.foreco.2010.05.023. [ Links ]
Báez, S., A. Malizia, J. Carilla, C. Blundo, M. Aguilar, N. Aguirre, Z. Aquirre, E. Alvarez, F, Cuesta, Á, Duque, W. Farfán-Rios, K. García-Cabrera, R. Grau, J. Homeier, R. Linares-Palomino, L. Malicia, O. Cruz, O. Osinaga, O. Phillips, C. Reynel, M. Silman and K. Feeley. 2015. Large-Scale Patterns of Turnover and Basal Area Change in Andean Forests. PLoS ONE 10(5): e0126594. Doi:https://doi.org/10.1371/journal.pone.0126594. [ Links ]
Castellanos-Bolaños, J. F., E. J. Treviño-Garza, O. A. Aguirre-Calderón, J. Jiménez-Pérez y A. Velázquez-Martínez. 2019. Diversidad arbórea y estructura espacial de bosques de pino-encino en Ixtlán De Juárez, Oaxaca. Revista Mexicana de Ciencias Forestales 1(2):39-52. Doi:https://doi.org/10.29298/rmcf.v1i2.636. [ Links ]
Chust, G., J. Chave, R. Condit, S. Aguilar, S. Lao and R. Pérez. 2006. Determinants and spatial modeling of tree β-diversity in a tropical forest landscape in Panama. Journal of Vegetation Science 17: 83-92. Doi: https://doi.org/10.1111/j.1654-1103.2006.tb02426.x. [ Links ]
Clark, D. B., J. Hurtado and S. S. Saatchi. 2015. Tropical rain forest structure, tree growth and dynamics along a 2700-m elevational transect in Costa Rica. PloS one 10(4): e0122905. Doi: https://doi.org/10.1371/journal.pone.0122905. [ Links ]
Delgado Z., D. A., S. A. Heynes S., M. D. Mares Q., N. L. Piedra L., F. I. Retana R., K. Rodríguez C., A. I. Villanueva H., M. D. S. González E. y L. Ruacho-González. 2016. Diversidad y estructura arbórea de dos rodales en Pueblo Nuevo, Durango. Revista Mexicana de Ciencias Forestales 7 (33): 94-107. Doi: https://doi.org/10.29298/rmcf.v7i33.92. [ Links ]
Domínguez G., T. G., B. N. Hernández G., H. González R., I. Cantú S., E. Alanís R. y M. D. S. Alvarado. 2018. Estructura y composición de la vegetación en cuatro sitios de la Sierra Madre Occidental. Revista Mexicana de Ciencias Forestales 9 (50): 9-34. Doi: https://doi.org/10.29298/rmcf.v9i50.227. [ Links ]
Graciano-Ávila, G., E. Alanís-Rodríguez, O. A. Aguirre-Calderón, M. A. González-Tagle, E. J. Treviño-Garza y A. Mora-Olivo. 2017. Caracterización estructural del arbolado en un ejido forestal del noroeste de México. Madera y Bosques 23 (3): 137-146. Doi: http://dx.doi.org/10.21829/myb.2017.2331480. [ Links ]
Graciano-Ávila, G., E. Alanís-Rodríguez, O. A. Aguirre-Calderón, M. A. González-Tagle, E. J. Treviño-Garza, A. Mora-Olivo y E. Buendía-Rodríguez. 2019. Estimación de volumen, biomasa y contenido de carbono en un bosque de clima templado-frío de Durango, México. Revista Fitotecnia Mexicana 42 (2): 119-127. Doi: https://doi.org/10.35196/rfm.2019.2.119. [ Links ]
García, E. 1998. Climas (Clasificación de Köppen, modificada por García) Escala 1:1 000 000. Comisión Nacional para el Conocimiento y Uso de la Biodiversidad. México, D.F., México. [ Links ]
García-Aguilar, J. Á., V. A. Velasco-Velasco, G. Rodríguez-Ortiz y J. R. Enríquez-del Valle. 2017. Influencia de la calidad de sitio sobre el crecimiento de una plantación de Pinus patula Schltdl. et Cham. Revista Mexicana de Ciencias Forestales 8 (44): 132-154. Doi: https://doi.org/10.29298/rmcf.v8i44.108. [ Links ]
González E., M. S., M. González E., J. A. Tena F., L. Ruacho G. e I. L. López E. 2012. Vegetación de la Sierra Madre Occidental, México: Una síntesis. Acta Botánica Mexicana 100: 351-403. http://www.scielo.org.mx/pdf/abm/n100/n100a12.pdf (26 de noviembre del 2021). [ Links ]
Hammer, Ø., D. A. Harper and P. D. Ryan. 2001. PAST: Paleontological statistics software package for education and data analysis. Palaeontologia electrónica 4(1): 9. https://paleo.carleton.ca/2001_1/past/past.pdf (15 de noviembre del 2021). [ Links ]
Hernández-Salas, J., O. A. Aguirre-Calderón, E. Alanís-Rodríguez, J. Jiménez-Pérez, E. J. Treviño-Garza, M. A. González-Tagle, C. Luján-Álvarez, J. M. Olivas-García y L. A. Domínguez-Pereda. 2013. Efecto del manejo forestal en la diversidad y composición arbórea de un bosque templado del noroeste de México. Revista Chapingo serie Ciencias Forestales y del Ambiente 19 (2): 189-199. http://doi: 10.5154/r.rchscfa.2012.08.052. [ Links ]
Instituto Nacional de Estadística y Geografía (INEGI). 2007. Conjunto de Datos Vectorial Edafológico. Serie II Continuo Nacional Durango. Escala 1:250 000. Durango, Dgo., México. s/p. [ Links ]
Jost, L. 2006. Entropy and diversity. Oikos 113: 363-375. Doi:https://doi.org/10.1111/j.2006.0030-1299.14714.x [ Links ]
López-Hernández, J. A., O. A. Aguirre-Calderón, E. Alanís-Rodríguez, J. C. Monárrez-González, M. A. González-Tagle y J. Jiménez-Pérez. 2017. Composición y diversidad de especies forestales en bosques templados de Puebla, México. Madera y Bosques 23 (1): 39-51. Doi:http://dx.doi.org/10.21829/myb.2017.2311518. [ Links ]
Malizia, A., C. Blundo, J. Carilla, O. Osinaga Acosta, F. Cuesta, Á. Duque, N. Aguirre, Z. Aguirre, M. Ataroff, S. Baez, M. Calderón-Loor, L. Cayola, L. Cayuela, S. Ceballos, H. Cedillo, W. Farfán Ríos, K. J. Feeley, A. F. Fuentes, L. E. Gámez Álvarez, R. Grau, J. Homeier, O. Jadan, L. D. Llambi, M. I. Loza Rivera, M. J. Macía, Y. Malhi, L. Malizia, M. Peralvo, E. Pinto, S. Tello, M. Silman and K. R. Young. 2020. Elevation and latitude drive structure and tree species composition in Andean forests: Results from a large-scale plot network. Plos One 15 (4). Doi: https://doi.org/10.1371/journal.pone.0231553. [ Links ]
Magurran, A. E. 2004. Measuring Biological Diversity. Blackwell Science. Oxford, UK. 256 p. [ Links ]
McIntire, E. J. B., F. I. Piper and A. Fajardo. 2016. Wind exposure and light exposure, more than elevation-related temperature, limit tree line seedling abundance on three continents. Journal of Ecology 104 (5): 1379-1390. Doi: 10.1111/1365-2745.12599. [ Links ]
Méndez O., C., C. A. Mora D., E. Alanís R., J. Jiménez P., O. A. Aguirre C., E. J. Treviño G. y M. A. Pequeño L. 2018. Fitodiversidad y estructura de un bosque de pino-encino en la Sierra Madre del Sur, México. Revista Mexicana de Ciencias Forestales 9 (50): 35-53. Doi: https://doi.org/10.29298/rmcf.v9i50.236. [ Links ]
Mora-Donjuán, C. A. y E. Alanís-Rodríguez. 2016. Resiliencia de bosques de pino - encino en América: Una visión global del estado actual. Revista Forestal Mesoamericana Kurú 13(33): 1-2. Doi: https://doi.org/10.18845/rfmk.v13i33.2571. [ Links ]
Moreno C., E. 2001. Métodos para medir la biodiversidad. Vol.1. M&T-Manuales y Tesis SEA. Sociedad Entomológica Aragonesa (SEA). Zaragoza, España. 84 p. [ Links ]
López, M., K. Klanderud, B. Finegan, D. Veintimilla, D. Bermeo, E. Murrieta, D. Delgado and D. Sheil. 2020. How forest structure varies with elevation in old growth and secondary forest in Costa Rica. Forest Ecology and Management 469: 118191. Doi: https://doi.org/10.1016/j.foreco.2020.118191. [ Links ]
Paredes O., A., R. R. Zárate, R. R. Laguna y A. S. Islas. 2019. Diversidad de especies arbóreas y arbustivas del ejido El Puente, Mineral del Chico Hidalgo. Revista Iberoamericana de Ciencias 6 (4): 93-105. http://www.reibci.org/publicados/2019/oct/3700105.pdf (2 de diciembre de 2021). [ Links ]
Manzanilla Q., G. E., J. M. Mata B., E. J. Treviño G., O. A. Aguirre C., E. Alanís R. y J. I. Yerena Y. 2020. Diversidad, estructura y composición florística de bosques templados del sur de Nuevo León. Revista Mexicana de Ciencias Forestales 11 (61). Doi: https://doi.org/10.29298/rmcf.v11i61.703. [ Links ]
Quiñónez B., G., F. Cruz C, B. Vargas L. y F. J. Hernández. 2012. Estimación del diámetro, altura y volumen a partir del tocón para especies forestales de Durango. Revista Mexicana de Ciencias Forestales 3 (9): 23-39. Doi: https://doi.org/10.29298/rmcf.v3i9.535. [ Links ]
Rascón, J. M., E. Alanís-Rodríguez, A. Mora-Olivo, E. Buendía-Rodríguez, L. Sánchez-Castillo and J. E. Silva-García. 2018. Differences in vegetation structure and diversity of a forest in an altitudinal gradient of the Sierra La Laguna Biosphere Reserve, Mexico. Botanical Sciences 96 (4): 598-608. Doi: https://doi.org/10.17129/botsci.1993. [ Links ]
Saldaña, A. 2013. Relación entre riqueza de especies y diversidad funcional de atributos foliares en dos ensambles de especies siempreverdes de un bosque templado lluvioso. Gayana. Botánica 70 (2): 177-187. Doi:https://dx.doi.org/10.4067/S0717-66432013000200001. [ Links ]
Siles G., P., T. A. Patricia, F. A. Rugama, L. Alaniz y W. O. González. 2017. Composición florística, estructura y biomasa de los bosques de Pino-Encino en la reserva Santa Rosa, Tisey, Estelí, Nicaragua. Revista de Biologia Tropical 65 (2): 763-776. Doi:https://doi.org/10.15517/rbt.v65i2.22928. [ Links ]
Whittaker, R. H. 1972. Evolution and measurement of species diversity. Taxon 21:213-251. Doi: https://doi.org/10.2307/1218190. [ Links ]
Quiñónez Barraza, G., F. Cruz Cobos, B. Vargas Larreta y F. J. Hernández. 2012. Estimación del diámetro, altura y volumen a partir del tocón para especies forestales de Durango. Revista Mexicana de Ciencias Forestales , 3 (9): 23-39. http://www.scielo.org.mx/pdf/remcf/v3n9/v3n9a3.pdf (26 de noviembre del 2021). [ Links ]
Zar, J. H. 2010. Biostatistical Analysis. Ed. Prentice Hall. Upper Saddle River, NJ, USA. 946 p. [ Links ]
Zarco, V. M., J. L. Valdez-Hernández, G. Ángeles-Pérez y O. Castillo Acosta. 2010. Estructura y diversidad de la vegetación arbórea del Parque Estatal Agua Blanca, Macuspana, Tabasco. Universidad y Ciencia 26 (1): 1-17. http://www.scielo.org.mx/scielo.php?pid=S0186-29792010000100001&script=sci_abstract (19 de octubre de 2021). [ Links ]
Received: May 27, 2021; Accepted: January 14, 2022
 Este es un artículo publicado en acceso abierto bajo una licencia Creative Commons
