


Servicios Personalizados
Revista
Articulo
 texto en
  Inglés (pdf)
 Artículo en XML
 Referencias del artículo
 Enviar artículo por email
Indicadores
-
 Citado por SciELO
 -
 Accesos
Links relacionados
-
 Similares en
SciELO
Similares en
SciELO
Compartir

 Permalink
Revista mexicana de ciencias forestales
versión impresa ISSN 2007-1132
Rev. mex. de cienc. forestales vol.12 no.66 México jul./ago. 2021 Epub 04-Oct-2021
https://doi.org/10.29298/rmcf.v12i66.816
Scientific article
Multitemporal analysis of the change in land cover in the Mixteca Alta Oaxaqueña
1Universidad Autónoma de Nuevo León. Facultad de Ciencias Forestales. México.
2Tecnológico Nacional de México / Instituto Tecnológico Superior de San Miguel El Grande. México.
The aim of this research was to assess the land use and vegetation change in a micro-basin of the Mixteca Alta in the state of Oaxaca, Mexico, from 1995 to 2016, through high resolution images and, thereby, identify the dynamics of loss and gain of the vegetal cover that allow to classify priority areas for conservation and restoration. The analysis was developed through an unsupervised classification and field validation. Results showed that forest cover has a positive increase of 6.6 % during the period from 1995 to 2016, as an outcome of restoration strategies promoted by indigenous communities and government institutions; agriculture decreased by 8.4 %, which is largely due to the fact that many areas have been abandoned due to migration and loss of soil productivity, as well as alteration of the precipitation regime, thus presenting a natural conversion to grasslands. The areas without vegetation decreased by 4.1 % as a result of the efforts in the construction of works for soil conservation, formation of successive terraces and stabilization of slopes. The increase in grassland areas within the micro-basin is a cause for concern, since should be considered as priority restoration areas due to the easily erodible soil type.
Key words: Land cover; indigenous communities; functional connectivity; desertification; satellite images; micro-watershed
El objetivo de la presente investigación fue evaluar el cambio del uso de suelo y vegetación en una microcuenca de la Mixteca Alta Oaxaqueña durante el periodo de 1995 a 2016, mediante el uso de imágenes de alta resolución y con ello identificar la dinámica de pérdida y ganancia de la cobertura vegetal que permitan catalogar zonas prioritarias para la conservación y restauración. El análisis se desarrolló con una clasificación no supervisada y validación en campo. Los resultados mostraron un incremento positivo de 6.6 % durante el período de 1995 al 2016 en la cobertura forestal, a partir de las estrategias de restauración impulsadas por las comunidades indígenas e instituciones gubernamentales; mientras que, la agricultura tuvo una disminución de 8.4 %, lo cual se explica, en gran medida, porque muchas áreas han sido abandonadas por la migración y la pérdida de productividad del suelo, así como a la alteración del régimen de precipitación; lo que condujo a una conversión natural hacia los pastizales. Las áreas sin vegetación disminuyeron 4.1 % a consecuencia de los esfuerzos en la construcción de obras para la conservación de suelos, la formación de terrazas sucesivas y la estabilización de taludes. El aumento de áreas de pastizal dentro de la microcuenca es un motivo de preocupación, ya que se deben considerar como áreas prioritarias de restauración debido al tipo de suelo fácilmente erosionable.
Palabras clave: Cobertura del suelo; comunidades indígenas; conectividad funcional; desertificación; imágenes satelitales; microcuenca
Introduction
The Mixteca Alta Oaxaqueña is classified as an ecological disaster zone, from its high rates of erosion, which are present in more than 60 % of its territory, with a loss rate that amounts to 200 tons ha-1 (Mendoza, 2002; Guerrero-Arenas et al., 2010), mainly due to the abandonment of agriculture, overgrazing and the use of traditional agriculture, a situation that provoked high vulnerability, favored by steep slopes, precipitation and easily eroded clay soils (Caballero, 2006; Santiago-Mejía et al., 2018).
Communities are vulnerable to the processes of land use changes, which is why several studies have been carried out related to the degradation, erosion and restoration (Contreras-Hinojosa et al., 2003; Valencia et al., 2006), as well as the social problems they face (Hernández et al., 2011; Aguilar-Santelises and del Castillo, 2013). However, few studies have focused on a more detailed analysis of the land cover change at the basin or micro-basin level, as an integral solution insuch a way that the strategies have a greater social, environmental and economic impact.
Scientific research to determine the processes of land use change use satellite images, mainly Landsat and Sentinel (Velázquez et al., 2003; Camacho-Sanabria et al., 2015; Steinhausen et al., 2018), which are considered to be low resolution, and also have a series of limitations that generate a margin of misclassification between 10 and 20 % (Pham et al., 2016; Azzari et al., 2017; Astola et al., 2019); Therefore, the objective of this project was to assess the land use and vegetation change in a micro-basin of the Mixteca Alta Oaxaqueña during the 1995-2016 period, through the use of high resolution images and, thereby, identify the vegetation cover dynamics of loss and gain that allow to classify priority areas for conservation and restoration.
Materials and Methods
The study area includes two micro-basins (San Isidro Peñasco (20-082-01-007) and San Sebastián Atoyaquillo (20-0082-01-015), which were unified for the present analysis and for the purposes of this research, which was called San Isidro Peñasco micro-basin, which is located between 17°11'43.57”-17°24'33.79'' N and 97°36'24.48”-97°30'21.60''' W, in the Mixteca Alta region of the state of Oaxaca (Inegi, 2004), with an area of 16 807.58 ha (Figure 1).
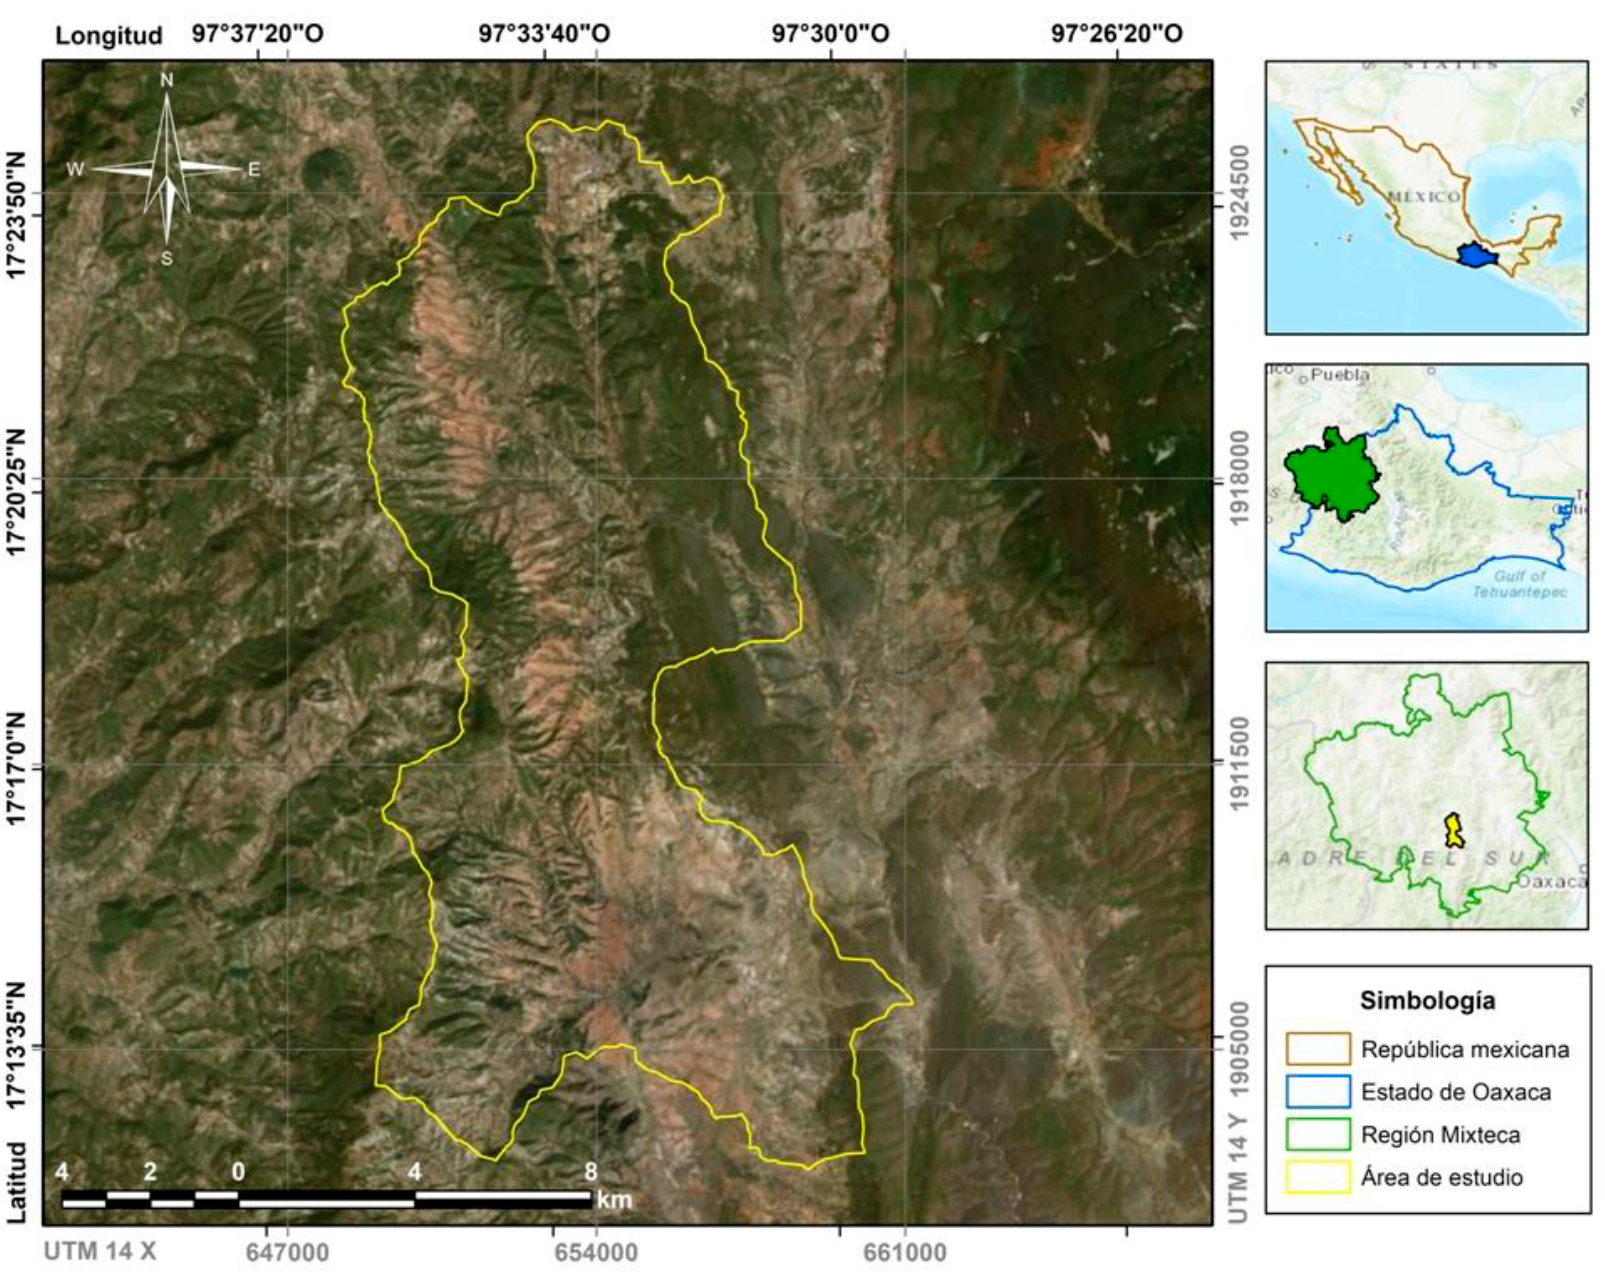
Simbología = Simbology; Estado de Oaxaca = State of Oaxaca; Región Mixteca = Mixteca region; Área de estudio = Study area.
Figure 1 Location of the study area.
The dominant climate is temperate subhumid C (w2), C (w1) and semi-warm humid A(C)w1; the soils at the site are of the Cambisol, Feozem, Leptosol, Luvisol and Regosol types (Inegi, 2004). The pluvial precipitation varies from 741 mm to 2 200 mm per year and 27.5 °C as the annual average temperature (García-Conabio, 1998; SMN, 2010).
Selection of satellite images
For a previous analysis of the study area, Landsat 8 OLI (30 m / pixel) and Sentinel 2A (10 m / pixel) images from the year 2017 (Copernicus Open Access Hub, 2020; USGS, 2020) were used. The images were subjected to atmospheric correction in order to perform a supervised classification and were geometrically cropped to adjust to the extent of the area of interest. Subsequently, four orthomosaics composed of high resolution images were processed and generated: 15 orthophotos from the Instituto Nacional de Estadística y Geografía (National Institute of Statistics and Geography) (Inegi) from 1995 (1.5 m / pixel), 321 Birdseye images (0.28 m / pixel; 2010), 80 from World Imagery (1.14 m / pixel; 2013) and 80 from Airbus Defense and Space (1.14 m / pixel; 2016).
The images were obtained from SASPlanet, which is free software for viewing and downloading orthomosaics from the main satellite providers for free and open source such as Google Earth, Bing Maps, DigitalGlobe, Kosmosnimki, Yandex Maps, Yahoo! Maps, VirtualEarth, Gurtam, OpenStreetMap, eAtlas, iPhone Maps, General Staff mapsy, among others (SASPlanet, 2020).
Supervised classification
Change detection is the process of identifying the difference in the state of an object or phenomenon by observing it at different times, essentially, it involves the ability to quantify temporal effects through multitemporal data sets (Lloyd, 1982; Singh, 1989). Land use and vegetation were analyzed using an unsupervised classification of the K-Means Cluster Analysis (KMC) module, which is one of the most widely used clustering methods for analyzing characteristics in satellite images (Rashmi et al., 2016), because it is one of the learning algorithms that solve the clustering problem using the iterative refinement technique (Oliver et al., 2006; Jumb et al., 2014).
The classification was carried out through training sites of the information obtained in the field (Figure 2), in which a total of 10 automated classifications were made, which were summarized in seven classes of land use and vegetation coverage, with the analysis method of multivariate data clusters Minimum iterative distance (Hastie et al., 2009). In all the procedures, the Las Palmas QGIS 2.18.25 software (QGIS Development Team, 2020) was used, which integrates the open source SAGA (System for Automated Geoscientific Analyzes) process toolbox licensed by the General Public License (Conrad et al., 2015).
Determination of hedging gains and losses
The determination of the loss or gain of coverage of the different land uses and vegetation was obtained through the construction of four transition matrices and one of the exchange rate for the periods. In order to determine the exchange rate, the equation adapted by Palacio-Prieto et al. (2004) was used:
Where:
Description of land use change and vegetation
To describe the land use and vegetation cover changes, a cross-tabulation of time 1 and time 2 was generated, which allows obtaining a matrix of changes in use. The diagonal shows the total amount of stable landscape between one date and another, while outside the diagonal the transitions of the classes between Year 1 and Year 2 are located. A positive value of the rate of change indicates area gain, while a negative value indicates loss.
From the matrix, the profit was calculated, resulting from the difference between the total for the year 2016 and the persistence. The loss was obtained from the difference between the total for 1995 and persistence. The exchange between categories was calculated as twice the minimum value of the gains and losses, and the total change for each category was established as the sum of the gains and losses. In the case of earnings, it is assumed that the earnings of each category and the proportion of each category in 2016 are fixed, and then distribute the earnings through the other categories, according to the relative proportion of the other categories in 1995.
Results and Discussion
Land use and vegetation changes
From the supervised classification process, seven classes of land use and vegetation were derived, but the categories of human settlements, roads and rivers did not show a significant change, occupying 10 % of the surface throughout the period under study; based on this, only the following categories were considered for the analysis: forest, grassland, agriculture and areas without vegetation.
The micro-basin occupies 15 119.02 ha, 40.8 % of which corresponds to forest cover and 49.1 % to non-forest cover (Table 1). These results differ from those from Carranza (2014) for the Mixteca region, since he considered a forest cover of 69 % and non-forest areas of 31 %, which is explained by the use of Spot-5 and Landsat satellite images that show geometric errors and cloudiness, as well as a resolution that varies from 2.5 to 15 m/pixel for panchromatic bands and 10 to 60 m/pixel for multispectral bands, while in the present study the resolution was 0.28 and 1.14 m/pixel with low cloudiness.
Table 1 Land use classification for the 1995 -2016 period.
| Year | 1995 | 2010 | 2013 | 2016 | ||||
|---|---|---|---|---|---|---|---|---|
| Cover/Use | ha | % | ha | % | ha | % | ha | % |
| Forest | 5 734.66 | 34.12 | 6 804.52 | 40.48 | 6 833.93 | 40.66 | 6 857.39 | 40.80 |
| Grassland | 3 229.01 | 19.21 | 3 518.76 | 20.94 | 3 849.61 | 22.90 | 4 231.03 | 25.17 |
| Agriculture | 3 938.32 | 23.43 | 2 918.40 | 17.36 | 2 860.44 | 17.02 | 2 526.61 | 15.03 |
| Without vegettation | 2 217.03 | 13.19 | 1 877.35 | 11.17 | 1 575.05 | 9.37 | 1 504.00 | 8.95 |
Land use and vegetation from 1995 to 2016 within the micro-basin was very dynamic. Common observable sequences of land cover changes include conversion from agriculture to grassland, agriculture to areas without vegetation, agriculture to forest, grassland to agriculture, grassland to forest, forest to agriculture, and areas without vegetation to grassland (Table 2).
Table 2 Soil cover changes from 1995 to 2016.
| Period | ∆1995-2010 | ∆2010-2013 | ∆2013-2016 | |||
|---|---|---|---|---|---|---|
| Cover/Use | ha | %∆ | ha | %∆ | ha | %∆ |
| Forest | 1 069.86 | 8.53 | 29.41 | 0.22 | 23.46 | 0.17 |
| Grassland | 289.74 | 4.29 | 330.85 | 4.49 | 381.42 | 4.72 |
| Agriculture | -1 019.92 | -14.87 | -57.96 | -1.00 | -333.84 | -6.20 |
| Without vegetation | -339.68 | -8.30 | -302.30 | -8.76 | -71.05 | -2.31 |
∆ = Increment
In 1995, the main coverage was forest type (34.1 %) (Figure 3A), with a marked distribution in the upper part of the micro-basin, a soil conservation strategy promoted by indigenous communities, due to the importance of the role it plays, the vegetation in this area, as an area of water recharge and protection against surface runoff and soil erosion (Castellanos-Bolaños and Ruiz, 1993; Champo-Jiménez et al., 2012). The second dominant coverage in this period was agriculture (23.4 %), as a result of the Mexican Food System (SAM, for its acronym in Spanish) in 1980, the National Food Program (PNA, for its acronym in Spanish) in 1983, the Rain-Tequio-Food Program in 1987 and the Special for Food Security (PESA, for its acronym in Spanish) in 1994 (Guerrero-Arenas et al., 2010).
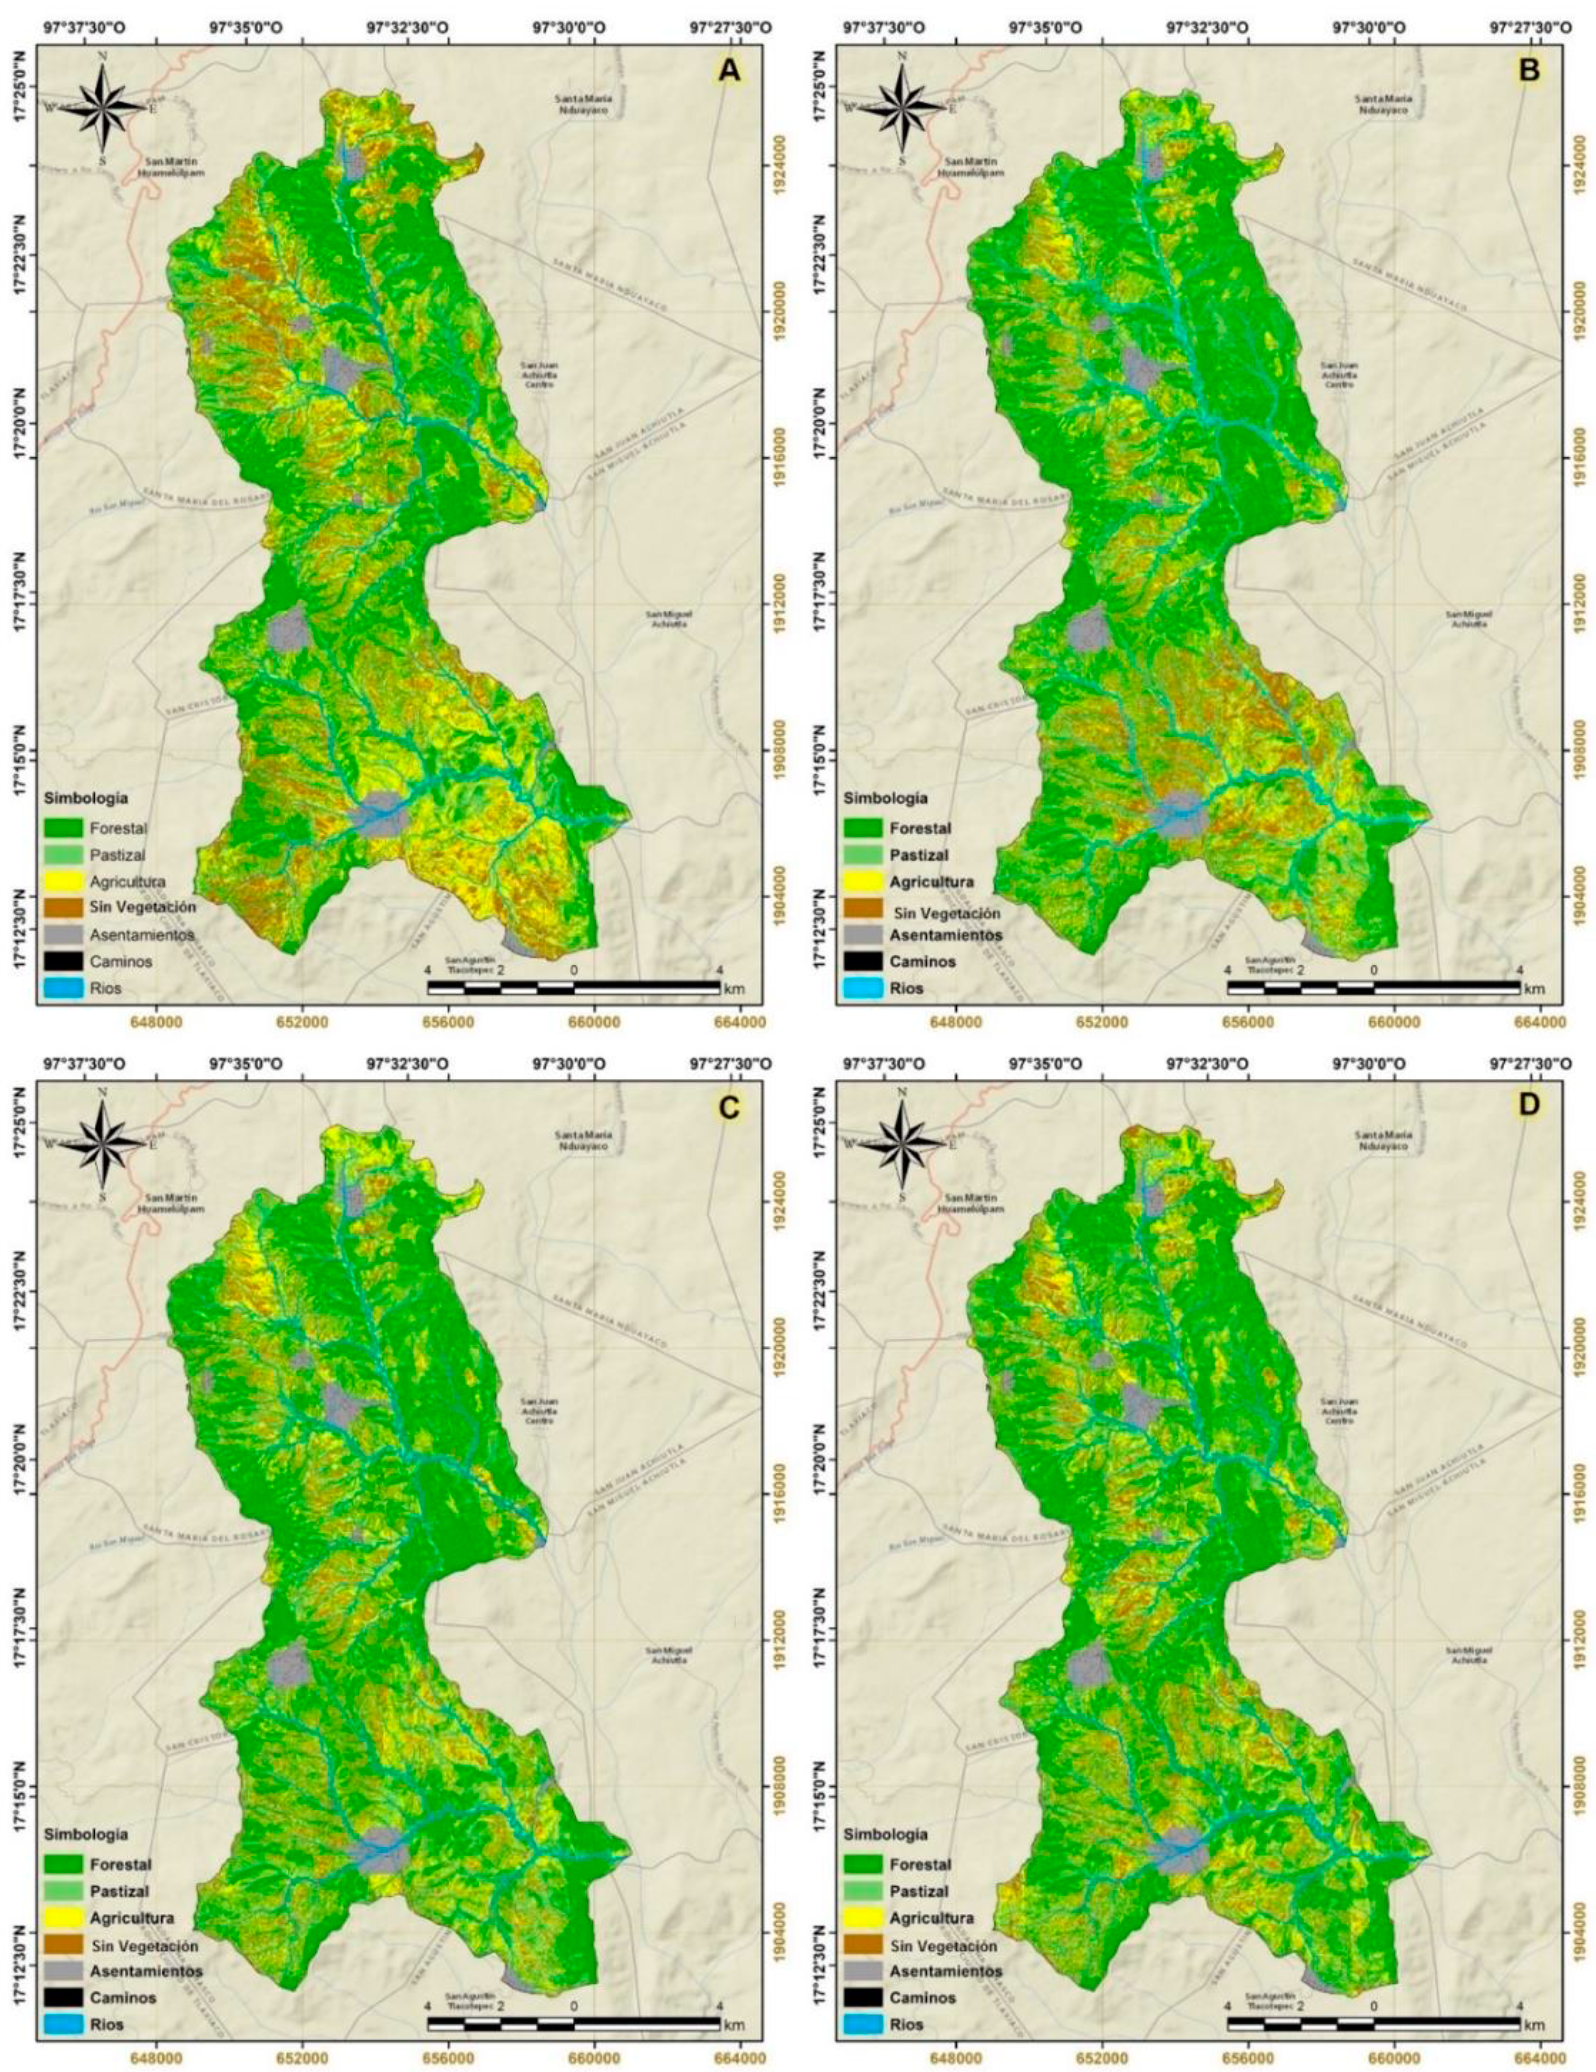
Simbología = Simbology; Pastizal = Grassland; Agricultura = Agriculture; Sin vegetación = Without vegetation; Asentamientos = Settlements; Caminos = Roads; Ríos = Rivers.
Figure 3 Land use and vegetation classification during different years of the San Isidro Peñasco micro-basin, Mixteca Alta, Oaxaca. A) 1995; B) 2010; C) 2013; and D) 2016.
In 2010, the area covered by forest, in regard to 1995 increased to 40.5 % (Figure 3B), as a consequence of the annual reforestations carried out by several communities such as Ignacio Zaragoza, San Isidro Peñasco, Guadalupe Peñasco, San José del Río, Mirasol and Cavacúa, who have planted more than 600 ha, with their own financial resources.
As of 1996, the communities of this region began to receive financing from the Ministry of the Environment and Natural Resources (Semarnat, for its acronym in Spanish) through the National Reforestation Program (Pronare, for its acronym in Spanish), later by the National Forestry Commission (Conafor for its acronym in Spanish) through the Forest Ecosystem Conservation and Restoration Program (Procoref, for its acronym in Spanish), the Forest Development Program, the ProÁrbol Program and the National Forest Program (Pronafor, for its acronym in Spanish), to continue with their reforestation activities, as well as the construction of nurseries and works of soil conservation (Conafor, 2004) and since 2019 with the Sembrando Vida program through the implementation of the Milpa Intercropped of Fruit Trees (MIAF, for its acronym in Spanish) and Agroforestry Systems (SAF, for its acronym in Spanish) systems for food self-sufficiency of peasant families (Sader, 2020).
In the classification of land use and vegetation in 2013 and 2016, a minimal change in forest cover was observed, with respect to the 2010 period, with a coverage of 40.6 % and 40.8 % in each period (Figure 3C and 3D), due to the low survival rates of reforestations and the mortality of established species in the region; such is the case of Pinus greggii Engelm. ex Parl., who managed to acclimatize, but over the years, gradually died without manifesting his adaptation with the presence of natural regeneration that allows an increase in forest cover (Castellanos-Bolaños and Ruiz, 1993; Velázquez et al., 2003; Valencia et al., 2006; Velasco-Velasco et al., 2012). In relation to the pasture during this period, an increase is observed between 22.9 % and 25.1 %.
In regard to areas without vegetation and with erosion, a gradual decrease is observed as a result of the efforts of indigenous communities and institutions such as the Ministry of the Environment and Natural Resources (Semarnat), the National Forestry Commission (Conafor), the National Commission of Arid Zones (Conaza), the United Nations Environment Program (UNEP), National Commission of Protected Natural Areas (Conanp), National Water Commission (CNA), National Institute of Ecology (INE), National Commission for the Indigenous Peoples Development (CDI) and World Wide Fund for Nature (WWF).
Land use change detection
With the classifications, three transition matrices were obtained to determine the loss or gain, as well as an exchange rate matrix. In the period 1995-2010, there was an increase of 15.73 % in forest cover with respect to 1995, which was recovered, mainly, in grassland and agriculture areas. At the same time, grasslands increased to 8.97 %, while in agriculture and areas without vegetation there was a reduction of 34.91 % and 18.13 %, respectively (Table 3).
Table 3 Transition matrix of vegetation cover in the periods from 1995 to 2010, 2010 to 2013 and 2013 to 2016 (values expressed in hectares).
| Year 1995 | Forest | Grassland | Agriculture | Without vegetation | Total |
|---|---|---|---|---|---|
| Forest | 5 649 | 53 | 25 | 6 | 5 734 |
| Grassland | 679 | 3 129 | -957 | 378 | 3 229 |
| Agriculture | 445 | 303 | 3743 | -555 | 3 936 |
| Without vegetation | 30 | 32 | 106 | 2 049 | 2 217 |
| Year 2010 | 6 804 | 3 518 | 2 918 | 1 877 | 15 188 |
| Forest | 6 656 | 63 | 52 | 33 | 6 804 |
| Grassland | 67 | 3 366 | 22 | 63 | 3 518 |
| Agriculture | 45 | 368 | 2 775 | -270 | 2 918 |
| Without vegetation | 65 | 52 | 11 | 1 749 | 1 877 |
| Year 2013 | 6 833 | 3 849 | 2 860 | 1 575 | 15 119 |
| Forest | 6 701 | 78 | 36 | 18 | 6 833 |
| Grassland | 73 | 3 697 | -221 | 301 | 3 850 |
| Agriculture | 80 | 328 | 2 706 | -254 | 2 860 |
| Without vegetation | 3 | 128 | 5 | 1 439 | 1 575 |
| Year 2016 | 6 857 | 4 231 | 2 526 | 1 504 | 15 120 |
For the 2010-2013 period, a significant decrease is recognized in the class of areas without vegetation with a 16 % rate. The average annual change for the class of areas without vegetation was 100.6 ha. Furthermore, agriculture lost its area by 58 ha (2.1 %) with an average annual change of 19.3 ha. In this period, grassland increased in a significant proportion with an average change of 110.3 ha-1 year-1. As in the previous time frame, forest cover increased at a rate of 0.4 % with an average increase of 9.6 ha-1 year-1 (Table 3).
The land use change during the 2013-2016 period showed a similar trend to the previous matrix, with negative rates only for the categories of agriculture and areas without vegetation. The positive scenarios were for forest areas and grasslands with gains between 0.3 % and 9 % (Table 3).
Of the types of land use and vegetation present in the micro-basin, the one with the highest rate of change was grassland, increasing by 1.3 % per year, which is explained by the abandonment of agricultural areas due to the loss of productivity ground. The forest cover also presented high annual rates of change that represented an increase of 0.8 % per year, mainly in the upper part of the micro-basin (Figure 4).
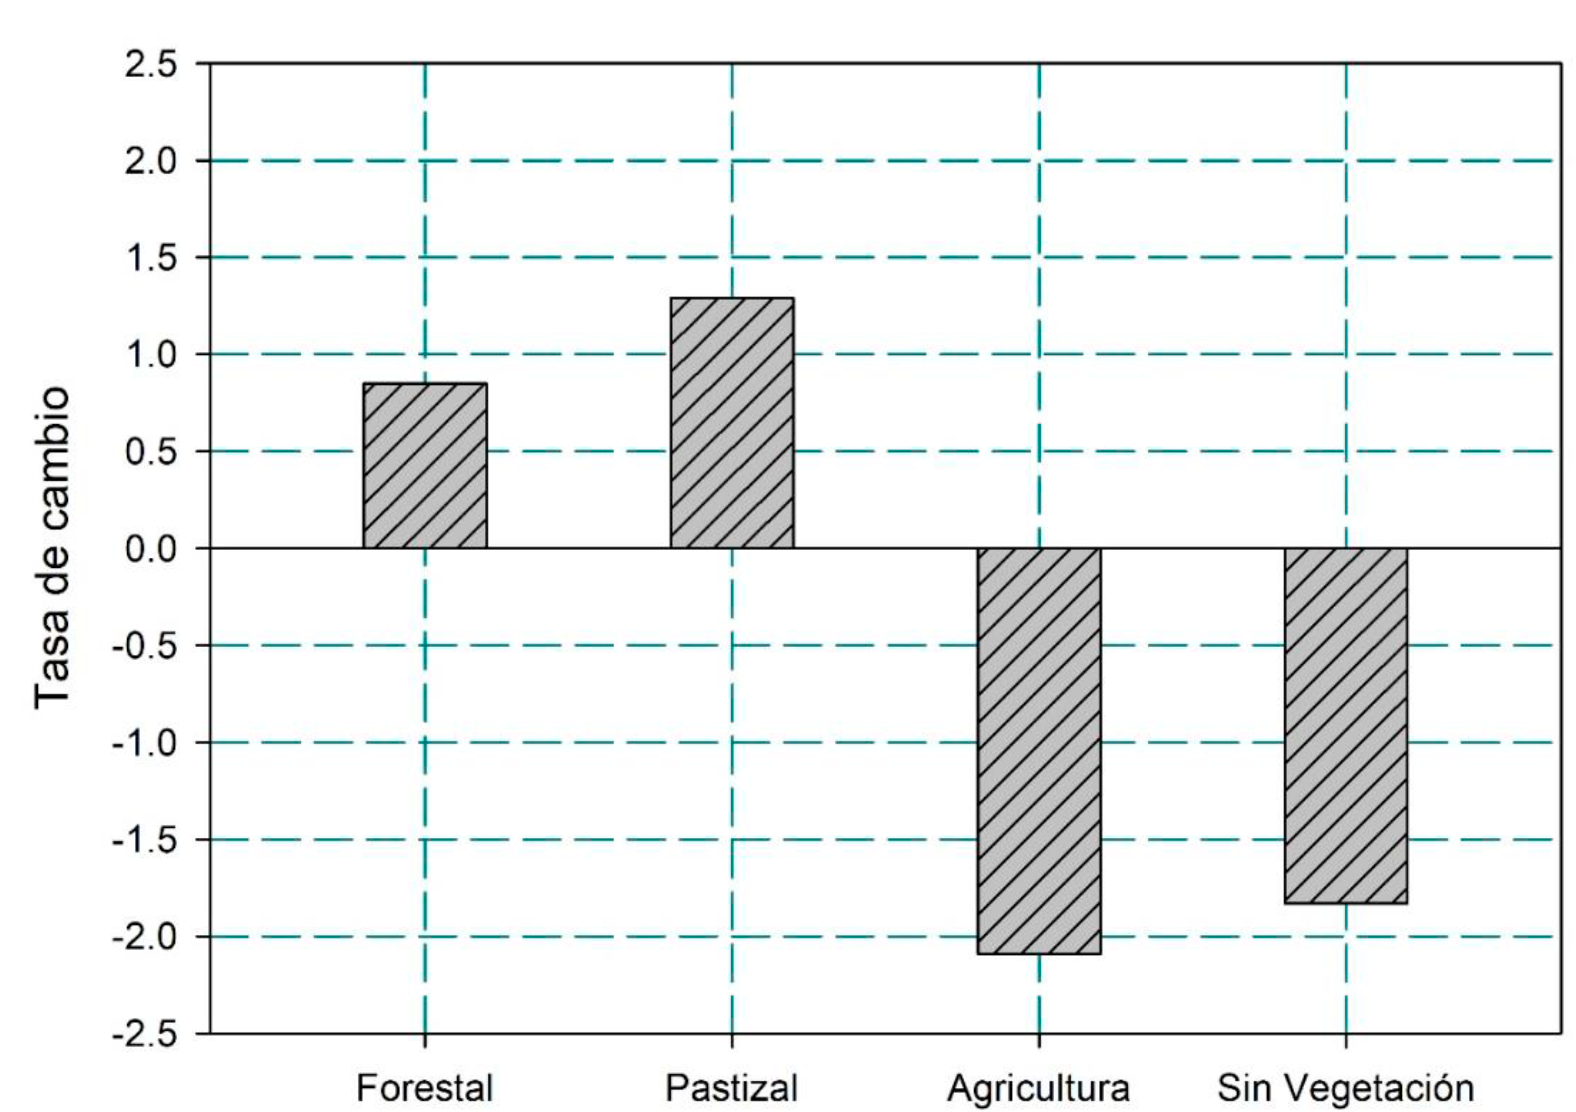
Tasa de cambio = Exchange rate; Forestal = Forest; Pastizal = Grassland; Agricultura = Agriculture; Sin vegeación = Without vegetation.
Figure 4 Land use change rate in the study area (1995-2016).
There are several reasons for the dynamics of change in land use and vegetation in the study area, such as the progressive increase in population and economic activities, which promote the expansion of agriculture, livestock, selective use of wood for house building, without ignoring the forest area loss caused by fires, as well as the presence of pests and diseases (Contreras-Hinojosa et al., 2003).
The recovery of forests is the result of reforestations in the study area carried out by the communities that are located there, since the 90s, as part of a collective conscience to restore their ecosystems (Carranza, 2014), as well as the participation of some institutions that have contributed significantly to a comprehensive management of the micro-watershed to guarantee the availability of environmental goods and services for present and future generations (Conafor, 2004).
With the supervised classification method of high resolution satellite images, the results differ greatly from the information generated by various institutions such as the National Commission for the Knowledge and Use of Biodiversity (Conabio, 1999), which compared to the classification of the year 1995 of the present study, present a difference of 26.2 % for the forest cover and of 63.3 % for the classification of agriculture (Figure 5A), due to the fact that the sampling algorithm used in the Landsat images, which is its main input, it is the closest neighbor, which best preserves the radiance values of the image. However, some images show a displacement between the coordinates of the bands, which can produce a systematic error when processed separately, in addition to the error in the data capture by the sensor, especially in pixels corresponding to overlapping areas with the same path but different row. These errors are related to the coordinates of the center of the image used to process the images and to correct it, a readjustment of the origin of the mesh of the bands must be carried out (Cristóbal et al., 2004).
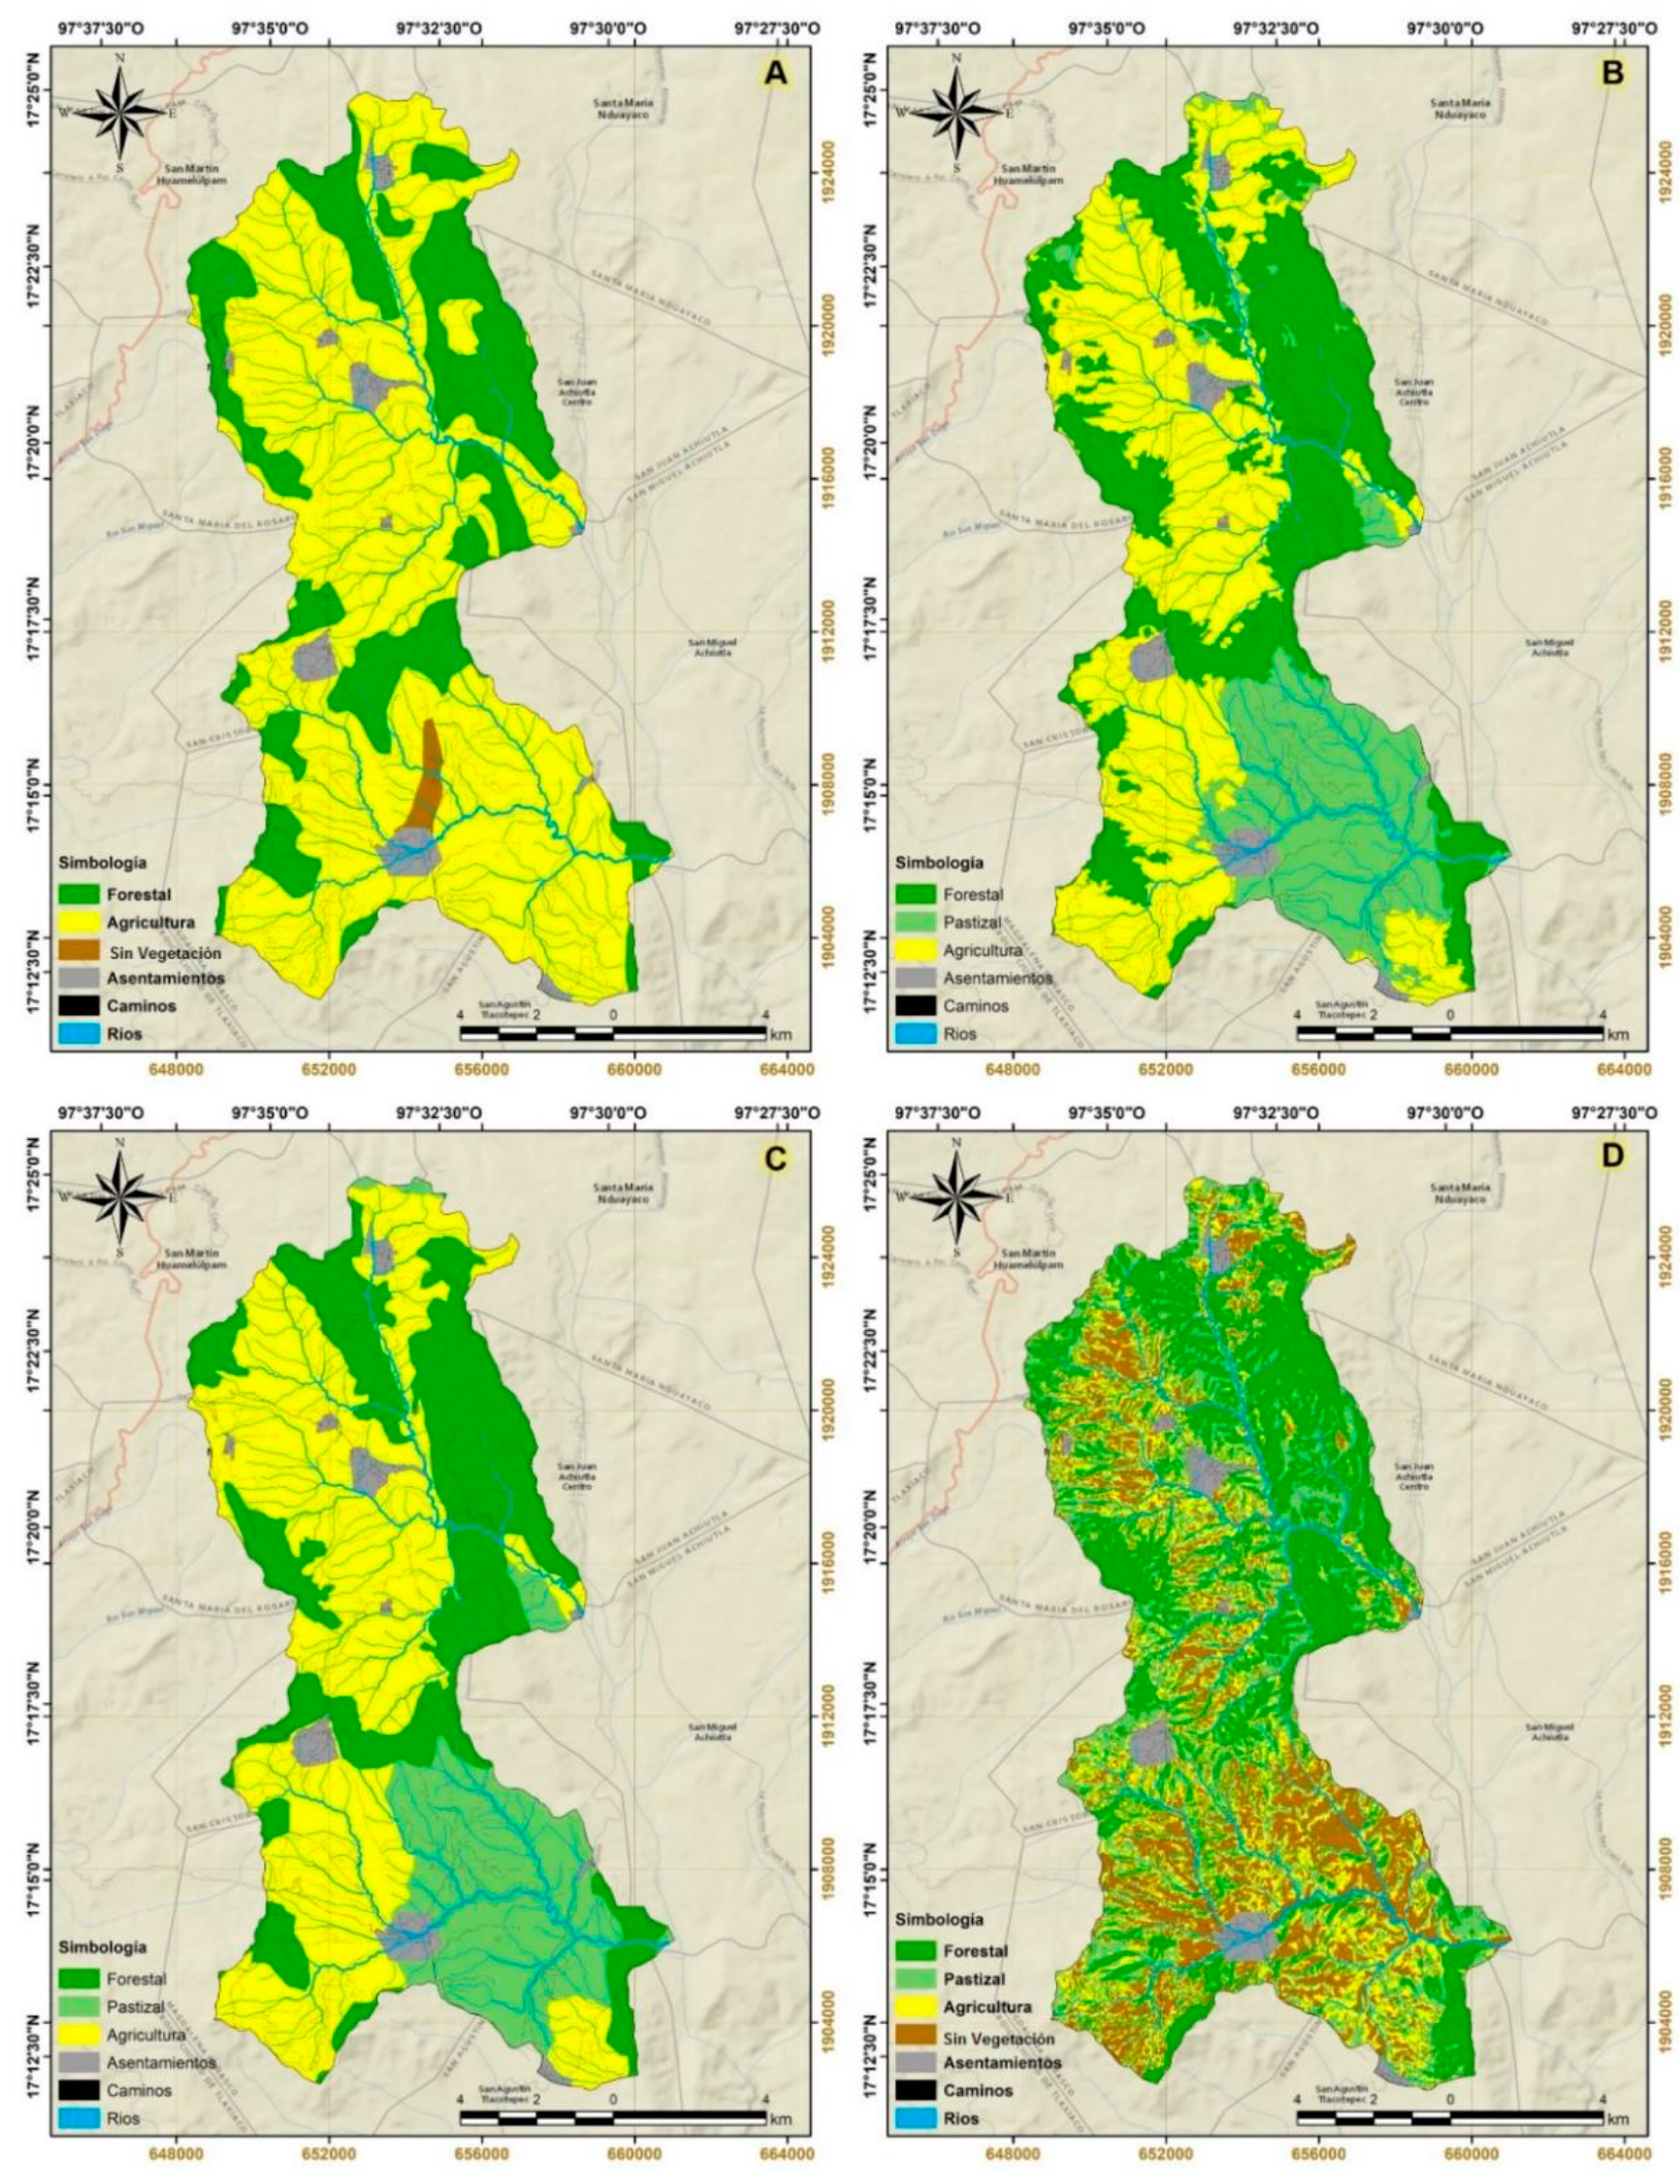
Figure 5 Comparative maps of land use and vegetation of the San Isidro Peñasco micro-basin, Mixteca Alta, Oaxaca; A) Conabio, 1999; B) Conafor, 2014; C) Inegi, 2017; and D) Landsat, 2016.
The information developed by Conafor (2013) defines an area of forest use of 5 150.2 ha, for grassland of 3 306.4 ha and for agriculture of 6 662.3 ha, which compared to the 2013 classification represents a difference for forest cover of 32.7 %, grassland 16.4 % and agriculture 57 % (Figure 5B). Regarding the information generated by Inegi (2017), which establishes a forest area of 4 852.3 ha, of grassland of 3 117.5 ha and of agriculture with 7 149.1 ha, when comparing it with the classification generated for 2016, a difference is obtained of 41.3 % forestry, 35.7 % grassland and 64.6 % agriculture (Figure 5C).
Vega et al. (2008) recommend performing a visual correction after the digital classification of Landsat images, because the response of the spectral signature varies between elements of the same class, due to the effect of the shadow caused by the orography of the region and humidity, during the time of image acquisition; for this reason, analog aerial photographs (1 m/pixel) must be available, because with them it is possible to visualize with greater precision the type of land use and vegetation, which will reduce the margin of error of the desired product, with a minimum mappable surface of 3 × 3 pixels (90 × 90 m).
With the use of low and medium resolution satellite images, the difference in land use area and vegetation decreases, for which, when making a comparative analysis with Landsat-type images from 2016, distributed land covers of the area are obtained. as follows: forest of 5 366.6 ha, pasture with 3 733.5 ha, agriculture with 2 740.4 ha and areas without vegetation 3 280.1 ha and with respect to the high resolution images for that same year the difference is 27.7 % forestry, 13.3 % grassland, 7.8 % agriculture and 54.1 % areas without vegetation (Figure 5D).
The results of the current study agree with those expressed by Trucíos et al. (2013), in an analysis of the information from the National Forest Inventory (2000), as well as that of the land use and vegetation of series I (1976), II (1992) and III (2002) generated by Inegi, in comparison with the digitization and interpretation of orthophotos (2 m/pixel) and high resolution images from the Quickbird satellite (0.60 m/pixel) and Worldview (0.50 m/pixel), obtaining as a result that there are significant differences between the areas reported for forestry, agriculture, grassland and human settlements, which is due to errors in the interpretation of satellite images of 30 and 60 m/pixel, during the National Forest Inventory and in the information generated by Inegi at a scale of 1: 250 000; while said error decreases substantially with the use of high resolution images for a scale of 1: 10 000.
The research documented here indicates that there is a better classification depending on the resolution of the pixel, as demonstrated by Astola et al. (2019), in a comparison carried out between satellite images for the prediction of forest variables in the boreal region, show that there is a better predictive capacity in the models with Sentinel-2 data in contrast to Landsat 8, in response to spatial resolution and the additional red border bands, which improves the information available on forest ecosystems by reducing 20 to 60 % bias with other optical satellites.
In the last 30 years, important works have been carried out in the San Isidro Peñasco micro-basin of the Mixteca Alta Oaxaqueña to reduce this pressure over the ecisystems, through strategies such as: the construction of dams for sediment retention, infiltration ditches, rainwater catchment pots, terraces for stabilization of slopes and reforestation with different species of conifers, however, at present it faces multiple pressures due to different anthropogenic activities, which require a prioritization of areas of ecological restoration and conservation of biodiversity.
Conclusions
In the San Isidro Peñasco micro-basin, the forest cover represents 40 % of its area, but the advance of grasslands (25 %), agriculture (15 %) and areas without apparent vegetation (9 %) is worth noticing. This situation allows the region to be classified as a priority for ecological restoration, through a comprehensive landscape management approach, from the fragmentation of its ecosystems.
The use of high resolution images supports a more precise classification, which guarantees a better interpretation of the different scenarios of land use and vegetation to update the available information, which allows to have a real panorama of the area of the different types of vegetation that need ecological restoration and biodiversity conservation strategies at the state level.
Acknowledgements
To the Consejo Nacional de Ciencia y Tecnología (Conacyt) (Science and Technology National Council) (Conacyt), for the scholarships awarded to the first two authors and to the Facultad de Ciencias Forestales (Graduate School of Forest Sciences) of the Universidad Autónoma de Nuevo León
REFERENCES
Aguilar-Santelises, R. and R. del Castillo F. 2013. Factors affecting woody plant species diversity of fragmented seasonally dry oak forests in the Mixteca Alta, Oaxaca, Mexico. Revista Mexicana de Biodiversidad 84(2): 575-590. Doi: 10.7550/rmb.30458. [ Links ]
Airbus Defence and Space. 2016. Satellite Maps Yandex. SASPlanet Development Team. http://sat01.maps.yandex.net/tiles?l=sat&x= (26 de enero de 2020). [ Links ]
Astola H., T. Häme., L. Sirro., M. Molinier and J. Kilpi. 2019. Comparison of Sentinel-2 and Landsat 8 imagery for forest variable prediction in boreal region. Remote Sensing of Environment 223: 257-273. Doi: 10.1016/j.rse.2019.01.019. [ Links ]
Azzari G., M. Jain and D. B. Lobell. 2017. Towards fine resolution global maps of crop yields: Testing multiple methods and satellites in three countries. Remote Sensing of Environment 202: 129-141. Doi: 10.1016/j.rse.2017.04.014. [ Links ]
Birdseye. 2010. Satellite Maps Google. SASPlanet Development Team. http://khms.google.com/kh/v= (26 de enero de 2020). [ Links ]
Caballero, J. J. 2006. Tecnologías tradicionales de transmisión oral en la región de la Mixteca. In: Noriega, M. (ed.). Casa editorial. Manejo del agua y restauración productiva en la región indígena Mixteca de Puebla y Oaxaca. Washington, DC. USA. The international Bank for Reconstruction and Development / The World Bank. México, DF., México. pp. 61-70. [ Links ]
Camacho-Sanabria, J. M., J. I. Juan P., N. B. Pineda J., E. G. Cadena V., L. C. Bravo P. y M. Sánchez L. 2015. Cambios de cobertura/uso del suelo en una porción de la Zona de Transición Mexicana de Montaña. Madera y Bosques 21(1): 93-112. Doi: 10.21829/myb.2015.211435. [ Links ]
Carranza S., J. 2014. Análisis de información espacial y aplicación de herramientas para la determinación de servicios ecosistémicos y toma de decisiones en la Región de la Mixteca. Santa Lucía del Camino, Oaxaca, México. 491 p. http://proyectomixtecasustentableac.org/wp-content/uploads/2018/08/14-An%C3%A1lisis-de-informaci%C3%B3n-espacial-y-aplicaci%C3%B3n-de-herramientas-de-los-Servicios-Ecosist%C3%A9micos.pdf (13 de marzo de 2020). [ Links ]
Castellanos-Bolaños, J. F. y M. Ruiz M. 1993. Introducción de Pinus greggii Engelm. en la Mixteca Alta Oaxaqueña. Folleto de Investigación No. 1. INIF-SARH. Centro de Investigación Pacífico Sur. Yanhuitlán, Oaxaca. México. 18 p. https://vun.inifap.gob.mx/BibliotecaWeb/_Content (17 de mayo de 2020). [ Links ]
Comisión Nacional para el Conocimiento y Uso de la Biodiversidad (Conabio). 1999. Uso de suelo y vegetación modificado por Conabio'. Escala 1: 1000000. Comisión Nacional para el Conocimiento y Uso de la Biodiversidad. Ciudad de México, México. http://www.conabio.gob.mx/informacion/metadata/gis/usv731mgw.xml?_xsl=/db/metadata/xsl/fgdc_html.xsl&_indent=no (3 de junio de 2019). [ Links ]
Comisión Nacional Forestal (Conafor). 2004. Manual de obras y prácticas para la conservación de suelos forestales. Ciudad de México, México. 298 p. http://www.conafor.gob.mx:8080/documentos/ver.aspx?articulo=1310&grupo=20 (30 de julio de 2019). [ Links ]
Comisión Nacional Forestal (Conafor). 2013. Inventario Estatal Forestal y de Suelos - Oaxaca. Información complementaria y cartografía. Zapopan Jalisco, México. http://187.218.230.30/filesconafor/userfiles/IEFyS/IEFYS_Oaxaca_2013/ (5 de junio de 2020). [ Links ]
Conrad, O., B. Bechtel, M. Bock, H. Dietrich, E. Fischer, L. Gerlitz, J. Wehberg, V. Wichmann and J. Böhner. 2015. System for Automated Geoscientific Analyses (SAGA) v. 2.1.4. Geoscientific Model Development, 8: 1991-2007. Doi:10.5194/gmd-8-1991-2015. [ Links ]
Coppernicus Open Access Hub. 2020. The european space agencyhe. Missions Sentinel 2A. https://scihub.copernicus.eu/dhus/#/home (15 de febrero de 2019). [ Links ]
Cristóbal, J., X. Pons y P. Serra. 2004. Sobre el uso operativo de Landsat-7 ETM+ en Europa. Revista de Teledetección 21: 55-59. http://www.aet.org.es/revistas/revista21/AET21-11.pdf (11 de noviembre 2020) [ Links ]
Contreras-Hinojosa, J. R., V. Volke-Haller., J. L. Oropeza-Mota., C. Rodríguez-Franco., T. Martínez-Saldaña y Á. Martínez-Garza. 2003. Estado actual y causas de la degradación de los agostaderos en el Municipio de Yanhuitlán, Oaxaca. Terra Latinoamericana 21(3): 427-435. http://www.redalyc.org/pdf/573/57311097001.pdf (25 de marzo de 2020). [ Links ]
Champo-Jiménez, O., L. Valderrama-Landeros y M. L. España-Boquera. 2012. Pérdida de cobertura forestal en la Reserva de la Biósfera Mariposa Monarca, Michoacán, México (2006- 2010). Revista Chapingo Serie Ciencias Forestales y del Ambiente, 18(2): 143-157. Doi: 10.5154/r.rchscfa.2010.09.074. [ Links ]
García, E.-Comisión Nacional para el Conocimiento y Uso de la Biodiversidad (Conabio). 1998. Climas (clasificación de Köppen, modificado por García). Escala 1:1000000. http://www.conabio.gob.mx/informacion/metadata/gis/clima1mgw.xml?_httpcache=yes&_xsl=/db/metadata/xsl/fgdc_html.xsl&_indent=no (15 de noviembre 2019). [ Links ]
Guerrero-Arenas, R., E. Jiménez H. y H. Santiago R. 2010. La transformación de los ecosistemas de la Mixteca Alta oaxaqueña desde el Pleistoceno Tardío hasta el Holoceno. Ciencia y Mar 14(40): 61-68. https://biblat.unam.mx/hevila/Cienciaymar/2010/no40/4.pdf (3 de febrero de 2019). [ Links ]
Hastie, T., R. Tibshirani and J. Friedman. 2009. The elements of statistical learning: data mining, inference, and prediction, Springer Series in Statistics. New York, NY. 737 p. Doi: 10.1007/b94608 [ Links ]
Hernández J, E., J. Franco F., A. Villarreal O., C. Camacho J. y M. Pedraza M. 2011. Caracterización socioeconómica y productiva de unidades caprinas familiares en la mixteca poblana. Archivos de Zootecnia, 60(230): 175-182. Doi: 10.4321/S0004-05922011000200002. [ Links ]
Instituto Nacional de Estadística y Geografía (Inegi). 1976. 'Uso del suelo y vegetación, escala 1:250000, serie I (continuo nacional)', escala: 1:250 000. Instituto Nacional de Ecología - Dirección de Ordenamiento Ecológico General e Instituto Nacional de Estadística, Geografía e Informática. Digitalización de las cartas de uso del suelo y vegetación elaboradas por Inegi entre los años 1980-1991 con base en fotografías aéreas de 1968-1986. http://www.conabio.gob.mx/informacion/metadata/gis/usv250kcs1agw.xml?_httpcache=yes&_xsl=/db/metadata/xsl/fgdc_html.xsl&_indent=no (15 de enero de 2020). [ Links ]
Instituto Nacional de Estadística y Geografía (Inegi). 1992. 'Uso del suelo y vegetación, escala 1:250000, serie II (continuo nacional)', escala: 1:250 000. http://www.conabio.gob.mx/informacion/metadata/gis/usv250ks2gw.xml?_httpcache=yes&_xsl=/db/metadata/xsl/fgdc_html.xsl&_indent=no (15 de enero de 2020). [ Links ]
Instituto Nacional de Estadística y Geografía (Inegi). 1995. Conjunto de datos vectoriales. Espacios y Datos de México INEGI. Aguascalientes, Ags., México. https://www.inegi.org.mx/datos/ (15 de enero de 2020). [ Links ]
Instituto Nacional de Estadística y Geografía (Inegi). 2002. 'Uso del suelo y vegetación, escala 1:250000, serie II (continuo nacional)', escala: 1:250 000. http://www.conabio.gob.mx/informacion/metadata/gis/usv250ks3gw.xml?_httpcache=yes&_xsl=/db/metadata/xsl/fgdc_html.xsl&_indent=no (15 de enero de 2020). [ Links ]
Instituto Nacional de Estadística y Geografía (Inegi). 2004. Síntesis de la información geográfica del estado de Oaxaca. Inegi. Aguascalientes, Ags., México. 180 p. http://internet.contenidos.inegi.org.mx/contenidos/productos/prod_serv/contenidos/espanol/bvinegi/productos/historicos/2104/702825224394/702825224394_1.pdf (3 de enero de 2020). [ Links ]
Instituto Nacional de Estadística y Geografía (Inegi). 2017. Conjunto de datos vectoriales de Uso de Suelo y Vegetación. Escala 1:250 000. Serie VI. Escala: 1:250 000. edición: 1. INEGI. Aguascalientes, Ags., México. https://www.inegi.org.mx/app/biblioteca/ficha.html?upc=889463598459 (12 de marzo de 2019). [ Links ]
Inventario Nacional Forestal. 2000. Sistema Nacional de Información y Gestión Forestal. CONAFOR. https://snigf.cnf.gob.mx/ (15 de febrero de 2020). [ Links ]
Jumb, V., M. Sohani and A. Shrivas. 2014. Color image segmentation using K-means clustering and Otsu’s adaptive thresholding. International Journal of Innovative Technology and Exploring Engineering 3(9): 72-76. http://www.ijitee.org/wp-content/uploads/papers/v3i9/I1495023914.pdf (3 de febrero de 2019). [ Links ]
Lloyd, S. 1982. Least squares quantization in PCM. IEEE Transactions on Information Theory 28(2): 129-137. Doi: 10.1109/TIT.1982.1056489. [ Links ]
Mendoza G., E. 2002. El ganado comunal en la Mixteca Alta: de la época colonial al siglo XX. El caso de Tepelmeme. Historia Mexicana 51(4): 749-785. https://historiamexicana.colmex.mx/index.php/RHM/article/view/1462/1310 (10 de abril de 2018). [ Links ]
Oliver, A., X. Munoz., J. Batlle., L. Pacheco and J. Freixenet. 2006. Improving clustering algorithms for image segmentation using contour and region information. In: Proceedings of the IEEE International Conference on Automation, Quality and Testing, Robotics 2: 315-320. Doi: 10.1109/AQTR.2006.254652. [ Links ]
Palacio-Prieto, J. L., M. T. Sánchez-Salazar, J. M. Casado I., E. Propin F., J. Delgado C., A. Velázquez M., L. Chias B., M. I. Ortiz Á., J. González S., G. Negrete F., J. Gabriel M. y R. Márquez H. 2004. Indicadores para la caracterización y ordenamiento del territorio. Instituto Nacional de Ecología-Semarnat, Instituto de Geografía de la UNAM y Secretaría de Desarrollo Social. Convenio Sedesol-Instituto de Geografía, UNAM. México, D. F., México. 161 p. http://cambioclimatico.gob.mx:8080/xmlui/bitstream/handle/publicaciones/174/434_2004_Indicadores_caracter_orden_territorio.pdf?sequence=1&isAllowed=y (26 de febrero de 2020). [ Links ]
Pham, L. T., L. Brabyn and S. Ashraf. 2016. Combining QuickBird, LiDAR, and GIS topography indices to identify a single native tree species in a complex landscape using an object-based classification approach. International Journal of Applied Earth Observation and Geoinformation 50: 187-197. Doi: 10.1016/j.jag.2016.03.015. [ Links ]
QGIS Development Team. 2020. QGIS Geographic Information System. Open Source Geospatial Foundation Project. https://qgis.org (12 de enero de 2020) [ Links ]
Rashmi, C., S. Chaluvaiah and G. H. Kumar. 2016. An efficient parallel block processing approach for K-means algorithm for high resolution orthoimagery satellite images. Procedia Computer Science 89: 623-631. Doi: 10.1016/j.procs.2016.06.025. [ Links ]
Santiago-Mejía, B. E., M. R. Martínez-Menez, E. Rubio-Granados, H. Vaquera-Huerta y J. Sánchez-Escudero. 2018. Variabilidad espacial de propiedades físicas y químicas del suelo en un sistema lama-bordo en la Mixteca Alta de Oaxaca, México. Agricultura, Sociedad y Desarrollo 15(2): 275-288. http://www.scielo.org.mx/pdf/asd/v15n2/1870-5472-asd-15-02-275-en.pdf (26 de febrero de 2019) [ Links ]
SASPlanet, 2020. SASPlanet Software. Versión 181221. SASPlanet Development Team. https://www.sasgis.org (26 de enero de 2020). [ Links ]
Secretaría de Agricultura y Desarrollo Rural (Sader). 2020. Programa Sembrando Vida. https://www.gob.mx/bienestar/acciones-y-programas/programa-sembrando-vida (8 de noviembre 2020). [ Links ]
Servicio Meteorológico Nacional (SMN). 2010. Normales climatológicas, estación 20102 San Agustina Tlacotepec, periodo 1951-2010. https://smn.conagua.gob.mx/tools/RESOURCES/Normales5110/NORMAL20102.TXT (12 de enero 2019) [ Links ]
Singh, A. 1989. Review article digital change detection techniques using remotely-sensed data. International journal of remote sensing 10(6): 989-1003. Doi: 10.1080/01431168908903939. [ Links ]
Steinhausen M. J., P. D. Wagnerc., B. Narasimhand and B. Waskea. 2018. Combining Sentinel-1 and Sentinel-2 data for improved land use and land cover mapping of monsoon regions. International Journal of Applied Earth Observation and Geoinformation 73: 595-604. Doi: 10.1016/j.jag.2018.08.011. [ Links ]
Trucíos C, R., M. Rivera G., G. Delgado R., J. E. Ávalos y J. Cerano P. 2013. Análisis sobre cambio de uso de suelo en dos escalas de trabajo. Terra Latinoamericana, 31: 339-346. http://www.scielo.org.mx/scielo.php?script=sci_arttext&pid=S0187-57792013000500339&lng=es&nrm=iso (11 de noviembre 2020) [ Links ]
US Geological Survey (USGS). 2020. Landsat-8 and Sentinel 2A image the Earth Explorer. https://earthexplorer.usgs.gov/ (15 de febrero de 2019). [ Links ]
Valencia M., S., M. V. Velasco G., M. Gómez C., M. Ruiz M. y M. Á. Capó A. 2006. Ensayo de procedencias de Pinus greggii Engelm. en dos localidades de la Mixteca Alta de Oaxaca, México. Revista Fitotecnia Mexicana 29 (1). http://www.redalyc.org/articulo.oa?id=61029104 (15 de febrero de 2020). [ Links ]
Vega G, A., J. López-García y L. de L. Manzo Delgado. 2008. Análisis espectral y visual de vegetación y uso del suelo con imágenes Landsat ETM+ con apoyo de fotografías aéreas digitales en el Corredor Biológico Chichinautzin, Morelos, México. Investigaciones Geográficas, Boletín del Instituto de Geografía, UNAM 67: 59-75. Doi:10.14350/rig.17990. [ Links ]
Velasco-Velasco, V., J. Enríquez-del Valle, G. Rodríguez-Ortiz, G. Campos-Ángeles, M. Gómez-Cárdenas y M. García-García. 2012. Evaluación de procedencias de Pinus greggii Engelm. Ex Parl. en plantaciones de la Mixteca Oaxaqueña. Revista Mexicana de Ciencias Forestales, 3(9):41-50. Doi: 10.29298/rmcf.v3i9.534. [ Links ]
Velázquez, A., E. Durán., I. Ramírez., J. F. Mas, G. Bocco, G. Ramírez and J. L Palacio. 2003. Land use-cover change processes in highly biodiverse areas: the case of Oaxaca, Mexico. Global Environmental Change 13: 175-184. Doi: 10.1016/S0959-3780(03)00035-9. [ Links ]
World Imagery. 2013. ArcGIS. Imagery. Maps/ESRI, SASPlanet Development Team. https://www.arcgis.com (26 de enero de 2020). [ Links ]
Received: June 22, 2020; Accepted: January 20, 2021
 Este es un artículo publicado en acceso abierto bajo una licencia Creative Commons
