


Servicios Personalizados
Revista
Articulo
 texto en
  Inglés (pdf)
 Artículo en XML
 Referencias del artículo
 Enviar artículo por email
Indicadores
-
 Citado por SciELO
 -
 Accesos
Links relacionados
-
 Similares en
SciELO
Similares en
SciELO
Compartir

 Permalink
Revista mexicana de ciencias forestales
versión impresa ISSN 2007-1132
Rev. mex. de cienc. forestales vol.12 no.64 México mar./abr. 2021 Epub 21-Mayo-2021
https://doi.org/10.29298/rmcf.v12i64.793
Scientific article
Site index for commercial tree plantations of Cedrela odorata L. in Quintana Roo, Mexico
1
 http://orcid.org/0000-0002-2481-6704
2
http://orcid.org/0000-0001-5909-7941
1Instituto Nacional de Investigaciones Forestales, Agrícolas y Pecuarias. Campo Experimental Chetumal. México.
2Instituto Tecnológico Superior de Jesús Carranza. México.
3Secretaría de Ecología y Medio Ambiente (SEMA)-Gobierno del Estado de Quintana Roo. México.
4Instituto Nacional de Investigaciones Forestales, Agrícolas y Pecuarias. Campo Experimental Saltillo. México.
For a sustainable management of commercial forest plantations (CFP), it is
essential to know the productive capacity of the site to estimate its
profitability. Site quality, hereafter, Site Index (SI) is a
reliable way to classify forest areas according to productivity. However, in
Quintana Roo, the most of CFP do not have such information,
so the aim of this study was to fit SI equations of CFP of
Cedrela odorata in Quintana Roo State. For
this purpose, 1 943 dominant height-age (Dh-E)
data pairs were collected from temporary plots on plantations from 1 to 28 years
old, three growth models were fitted to data in SAS 9.4®. According
to the analysis, we used of the adjustment in the values of the root of the mean
square of the error (RMSE), adjusted coefficient of determination
(R
2
adj.
) and parameters significance, in addition to the bias (
Key words Station quality; red cedar; anamorphic curves; polymorphic curves; forest management; state of Quintana Roo
Para un manejo sostenible de las plantaciones forestales comerciales (PFC), es
fundamental conocer la capacidad productiva del sitio para estimar su
rentabilidad. La calidad de estación expresada en función del Índice de Sitio
(IS) es una metodología confiable para clasificar las áreas
forestales de acuerdo con su productividad. La mayoría de las PFC de Quintana
Roo no tienen esa información, por lo que el objetivo del presente estudio fue
ajustar y comparar ecuaciones de IS para PFC de Cedrela
odorata en el estado de Quintana Roo. Con 1 943 pares de datos de
altura dominante-edad (Ad-E) de entre uno y 28 años, se
ajustaron tres modelos de crecimiento en el paquete estadístico SAS
9.4®. De acuerdo a los valores de la raíz del cuadrado medio del
error (RCME), coeficiente de determinación ajustado
(R
2
adj.
) y significancia de los parámetros, además, del sesgo (
Palabras clave Calidad de estación; cedro rojo; curvas anamórficas; curvas polimórficas; manejo forestal; Quintana Roo
Introduction
The classification of the productivity of forest areas is the basis for planning the establishment and management of commercial forest plantations (PFC, for its acronym in Spanish) (Carrero et al., 2008), since the difference in productivity within the localities determines critical aspects of management, such as age (E) to apply forestry treatments, harvest shift, harvesting techniques or profitability indicators (Andenmatten and Letourneau, 1998; Gaillard et al., 2002). Given this scenario, it is essential to know the growth rate of the species planted for market purposes (Aguirre-Calderón, 2015).
The most widely used methodology to classify the station quality of forest stands is the site index (IS, for its acronym in Spanish) (Álvarez et al., 2004; Cornejo et al., 2005; Madrigal et al., 2005; Hernández-Ramos et al., 2014), defined as the dominant height (Ad) that the stand reaches at a base (E 0 ) or reference age. Ad in a monospecific and contemporary stand is little affected by density, follows a certain pattern and has a high correlation with the production of timber volume (Clutter et al., 1983; Torres and Magaña, 2001).
To represent the IS, Ad curves are used that express the average growth pattern of the trees through non-linear equations, from which season quality or productivity curves are constructed, which can be proportional to each other (anamorphic) or possess particular growth patterns for each IS (polymorphic) (Clutter et al., 1983; Torres and Magaña, 2001; Hernández-Ramos et al., 2015).
Until 2014, there was an area of 2 722 ha in the state of Quintana Roo covered with PFC, where Cedrela odorata L. was established in 2 155 ha as a priority species (Conafor, 2016). The lack of information on the productivity of the plantations and on biometric tools for their management, has caused that the maximum potential yield and profitability are not reached. Therefore, and due to the importance of the calculation of the IS for the planning of forest management of the wooded areas under cultivation, and from the hypothesis that there is a differential in the growth potential between localities and given that equations can be adjusted that model the functional relationships between the Ad and the E of the trees, the objective of adjusting and comparing IS equations for PFC of C. odorata in Quintana Roo, Mexico was stated.
Materials and Methods
The study was carried out with data from the C. odorata PFCs located in the municipalities of Bacalar, Felipe Carrillo Puerto, José María Morelos and Othón P. Blanco, Quintana Roo, Mexico. The predominant climate is warm subhumid with rains in summer and part of winter, the thermal oscillation is less than 5 °C (Aw (x') i (García, 1983). The average annual temperature is 25.5 °C and the average precipitation annual of 1 260 mm, with a pronounced dry season between December and May (INEGI, 2016).
The PFCs are located in semi-flat lands, in soils that according to the Mayan terminology and its equivalent according to the IUSS Working Group WRB (2007) correspond to: Tzek’el (Leptosol), Kakab (Rendzina); K’ankab (Chromic Luvisol), Yax-hoom (Pelic Vertisol) and Ak’alche (Vertisol gleyco).
24 PFCs from one to 28 years of age were evaluated (Figure 1) using 400 m2 temporary plots, in which the dominant trees in height were selected and 1 941 pairs of Ad-E data were obtained. Individuals without damage caused by pests, diseases or mechanical effects were chosen. A SunntoTM clinometer was used to measure Ad, and age was calculated based on the owners' information on the year of establishment.

The growth models of Schumacher (1), Champan-Richards (2) and Weibull (3) reported in the specialized literature (Kiviste et al., 2002; Burkhart and Tomé, 2012; Panik, 2013) were adjusted to the refined database and which have shown satisfactory results in some studies to describe growth in Ad-E and IS (García et al., 1992; García et al., 2007; Hernández-Ramos et al., 2014; Murillo-Brito et al., 2017)(Table 1).
Table 1 Growth models for dominant height (Ad), curves and site index classification (IS) for commercial forest plantations of Cedrela odorata L. in Quintana Roo, Mexico.
| Model | Equation | IS Curves | IS Classification |
|---|---|---|---|
| Schumacher(anamorphic) |
|
|
|
| Schumacher(polymorphic) |
|
|
|
| Chapman-Richards (anamorphic) |
|
|
|
| Chapman-Richards (polymorphic) |
|
|
|
| Weibull (anamorphic) |
|
|
|
| Weibull(polymorphic) |
|
|
E 0 = Basic age; β’s = Estimation parameters; E = Age (years).
The information was processed in the SAS 9.4® statistical package with
the Model procedure and the maximum likelihood technique (SAS, 2016). The determination of the goodness of fit of the
models was based on the results of quantitative analysis, used in modeling
studies and forest biometrics (Corral-Riva
et al., 2007). The lowest value of the root of
the mean square of the error (REMC) and the highest value in
the adjusted determination coefficient (R
2
aj.
) Were considered; while, the average bias indicators (
Since the quality of fit does not necessarily reflect the adherence of the estimates to the observed data (Kozak and Kozak, 2003; Quevedo et al., 2004; Hernández-Ramos et al., 2015), to reinforce the selection criteria of the best equation, a graphical comparison of the guide curves superimposed on the observed data was made and the one with the best fidelity was chosen. In addition, the model that showed a sigmoid trend was selected, a point of inflection in which the current (ICA) and average (IMA) increases become equal, since some do not usually adequately describe the growth of the trees and an asymptote or maximum possible growth at an infinite age. The crossing point at which ICA = IMA, was obtained according to the methodology of Kiviste et al. (2002).
With the base equation selected for its adjustment and prediction, the guide curve in Ad was generated, considering that when E is equal to the base age (E0), then Ad is equal to IS. From the IS equation, the parameter referring to the asymptote was cleared and the expression was replaced in the basic equation, with which the asymptotic parameter is considered implicit and the shape parameters were common for all sites (Clutter et al., 1983); thus, by varying the E and the IS classes, and keeping the E 0 constant, the anamorphic curves were generated. For the polymorphic curves, some of the parameters of the exponents were cleared from the IS equations, either the one associated with the growth rate or the site and they were substituted in the base equation. In a similar way, by varying the E and IS classes, and keeping E 0 constant, the polymorphic curves were generated (García et al., 2007).
By establishing an E 0 equivalent to the shift established in 25 years and according to the observed data dispersion interval, IS classes were assigned for the station quality curves, while the values of the IS classes were substituted in the model and E 0 (Clutter et al., 1983; Carrero et al., 2008; Tamarit-Urías et al., 2014; García-Espinoza et al., 2019).
Results and Discussion
The dispersal trend of the 1 943 pairs of data used Ad-E of C. odorata trees show a sigmoid trend, where an increase in the growth of Ad in the PFCs can be observed as age increases (Figure 2).
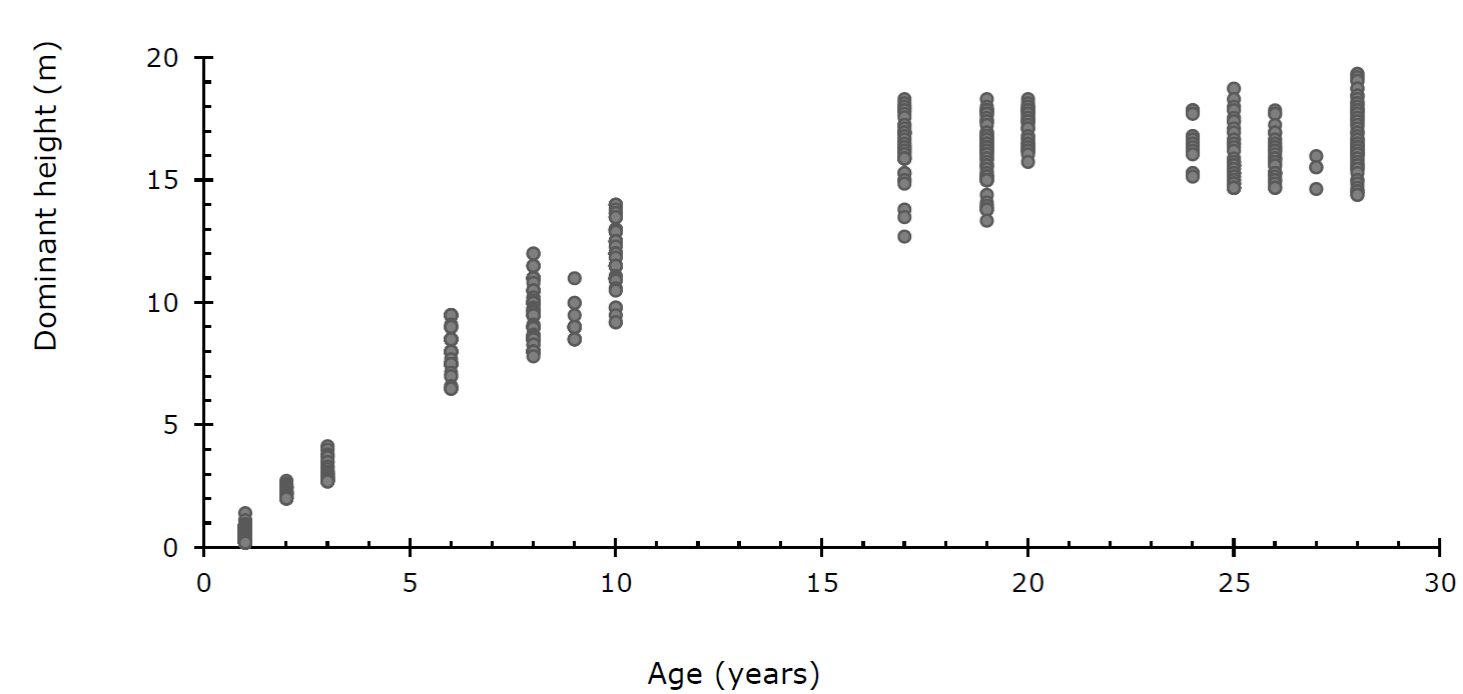
Figure 2 Dispersion of the observed dominant height-age data of trees established in commercial forest plantations of Cedrela odorata L. in Quintana Roo, Mexico.
The age interval ranged from one to 28 years and the Ad from 0.49 to 17.66 m, with minimum and maximum values between 0.22 and 19.35 m, respectively. The variation in Ad of the trees for each age is low, since they fluctuate around 0.71 % to 42.26 %, but most of the plantations vary between 2 % to 11 % (Table 2).
Table 2 Basic statistics of the dominant trees in commercial forest plantations of Cedrela odorata L. in Quintana Roo, Mexico.
| No. | Location | Municipality | Age (years) | Soil | Dominant height (m) | ||||
|---|---|---|---|---|---|---|---|---|---|
| Prom | Min | Max | STD | CV (%) | |||||
| 1 | S.F. Bacalar | Bacalar | 1 | Yax-hoom | 0.83 | 0.72 | 0.95 | 0.06 | 7.31 |
| 2 | S.F. Bacalar | 1 | K’ankab | 0.49 | 0.22 | 1.42 | 0.21 | 42.26 | |
| 3 | S.F. Bacalar | 2 | Yax-hoom | 2.16 | 2.00 | 2.6 | 0.20 | 9.08 | |
| 4 | S.F. Bacalar | 2 | K’ankab | 2.32 | 2.10 | 2.73 | 0.16 | 6.79 | |
| 5 | S.F. Bacalar | 3 | Yax-hoom | 3.88 | 3.70 | 4.15 | 0.19 | 4.87 | |
| 6 | S.F. Bacalar | 3 | K’ankab | 2.96 | 2.70 | 3.50 | 0.22 | 7.54 | |
| 7 | S.F. Bacalar | 6 | Puslum Yax-hoom | 6.84 | 6.50 | 8.00 | 0.48 | 7.02 | |
| 8 | S.F. Bacalar | 6 | Puslum | 8.30 | 7.50 | 9.50 | 0.75 | 9.01 | |
| 9 | S.F. Bacalar | 8 | T’zekel | 9.24 | 8.30 | 11.00 | 0.71 | 7.71 | |
| 10 | S.F. Bacalar | 8 | Puslum Yax-hoom | 8.45 | 7.80 | 10.00 | 0.65 | 7.69 | |
| 11 | S.F. Bacalar | 8 | Puslum | 10.5 | 9.50 | 12.00 | 0.72 | 6.84 | |
| 12 | S.F. Bacalar | 9 | Puslum | 9.15 | 8.50 | 11.00 | 0.66 | 7.17 | |
| 13 | S.F. Bacalar | 10 | Puslum | 12.14 | 11.00 | 14.00 | 0.91 | 7.49 | |
| 14 | Puerto Arturo | José María Morelos | 10 | K’ankab | 12.30 | 9.80 | 13.8 | 1.41 | 11.47 |
| 15 | San Felipe III | 10 | Yax-hoom | 9.95 | 9.20 | 11.10 | 0.85 | 8.50 | |
| 16 | S.F. Bacalar | 17 | Puslum | 16.83 | 15.90 | 18.30 | 0.72 | 4.29 | |
| 17 | Sabana San Fco. | 17 | Ak’alche | 14.43 | 12.70 | 15.30 | 0.97 | 6.73 | |
| 18 | S.F. Bacalar | 19 | Puslum | 16.44 | 15.00 | 18.30 | 0.92 | 5.57 | |
| 19 | Nuevo Tabasco | 19 | K’ankab | 14.05 | 13.35 | 15.30 | 0.55 | 3.89 | |
| 20 | S.F. Bacalar | Bacalar | 20 | Puslum Yax-hoom | 16.79 | 15.75 | 17.85 | 0.65 | 3.89 |
| 21 | S.F. Bacalar | 20 | Puslum | 17.66 | 17.10 | 18.30 | 0.39 | 2.18 | |
| 22 | S.F. Bacalar | 24 | yax-hoom | 16.59 | 15.15 | 17.85 | 0.87 | 5.22 | |
| 23 | S.F. Bacalar | 25 | Puslum | 15.79 | 14.70 | 18.75 | 1.06 | 6.72 | |
| 24 | S.F. Bacalar | 26 | Yax-hoom | 15.94 | 14.70 | 17.85 | 0.87 | 5.48 | |
| 25 | S.F. Bacalar | 26 | Puslum | 16.00 | 14.70 | 17.70 | 0.87 | 5.41 | |
| 26 | S.F. Bacalar | 27 | Puslum | 15.43 | 14.64 | 15.99 | 0.57 | 3.67 | |
| 27 | Chunhuhub | Felipe Carrillo Puerto | 28 | Ak’alche | 15.79 | 14.4 | 17.7 | 1.03 | 6.56 |
| 28 | S.F. Bacalar | Bacalar | 28 | Puslum | 17.23 | 15.45 | 19.35 | 1.15 | 6.68 |
| 29 | S.F. Bacalar | 28 | Puslum | 14.93 | 14.85 | 15.00 | 0.11 | 0.71 | |
Prom = Average; Min = Minimum; Max = Maximum; STD = Standard deviation; CV = Coefficient of variation.
Table 3 shows the goodness of fit criteria and in which models (3) and (2) reached the highest values in the adjusted coefficient of determination (R 2 adj .). The lowest RCME and all their parameters were significant ( α <0.05). In this regard, Gujarati (2010) argues that values higher than 0.7 and 0.8 are acceptable, so it can be said that the three models explain in a good way the variability of the data.
Table 3 Statistics of goodness of fit and values of the parameters of the growth models for commercial forest plantations of Cedrela odorata L. in Quintana Roo, Mexico.
| Model | RCME | R 2 adj. | Parameter | Estimation | Eea | Value t | Pr>|t| |
|---|---|---|---|---|---|---|---|
| (1) | 0.8784 | 0.9807 | β0 β 1 |
20.79999 -5.65107 |
0.0724 0.05 |
287.44 112.99 |
<0.0001 <0.0001 |
| (2) | 0.731 | 0.9866 | β
0 β 1 β 2 |
17.03809
0.173224 1.882571 |
0.0416
0.00306 0.0469 |
410.05
56.69 40.13 |
<0.0001
<0.0001 <0.0001 |
| (3) | 0.7185 | 0.9871 | β
0 β 1 β 2 |
16.63671
0.035244 1.552455 |
0.032
0.00124 0.0173 |
519.18
28.43 89.8 |
<0.0001
<0.0001 <0.0001 |
RCME = Root-mean-square error; R 2 adj. = Coefficient of determination; Eae = Approximate standard error; Pr>|t| = reliability level.
The values in the determination coefficients are similar to those found by García et al. (1998) for Swietenia macrophylla King, with a R 2 aj value equal to 0.99 when using the same models, but higher than that calculated by García et al. (2007) of 0.84 in this criterion for C. odorata when using the Schumacher model as the one that best explains the variability of the information, as indicated by both authors when modeling the SI in PFC of the state of Quintana Roo, Mexico.
Several investigations record interesting results. Thus, Minoche et al. (2017) obtained different values when adjusting five models for dominant height and generating anamorphic IS curves using the algebraic difference technique in Tectona grandis L. plantations in the state of Tabasco, Mexico, where the best adjusted model was that of Sloboda, when determining an R 2 of 0.998. Galán et al. (2008) adjusted and established an R 2 of 0.870 and 919 in the Chapman-Richards model to predict and explain the dominant height growth and generate anamorphic IS curves of C. odorata and Tabebuia donnell-smithii Rose at a base age of 10 years that would cover the age ranges of 3 to 10 years. Pérez-González et al. (2012), when adjusting seven IS models for S. macrophylla plantations of seven to 16 years in Tabasco, Mexico, concluded that the Korf model was statistically better to estimate growth in Ad at the E 0 of 10 years in trees of the studied species (R 2 = 0.80). Martínez-Zurimendi et al. (2015) calculated a value of 0.58 for the Chapman-Richards function and 0.59 for the Weibull model in Gmelina arborea Roxb. plantations. Murillo-Brito et al. (2017) reached a value of 0.50 in the Schumacher model for C. odorata plantations, both in Tabasco, Mexico.
Figure 3 shows the distribution of residuals, defined as the difference between the real observed value and the estimated value through the generated equation, in which the analysis shows that the three models have a good fit and a regular distribution around zero.

Figure 3 Distribution of residuals of growth models to generate site index for Cedrela odorata L. in Quintana Roo, Mexico.
Model (3) had the highest adjustment because the deviation of the predicted and
observed values (
Table 4 Evaluation statistics of the predictive ability of the models in commercial forest plantations of Cedrela odorata L. in Quintana Roo, Mexico .
| Model | Prediction | Normality | ||
|---|---|---|---|---|
|
|
DA % | SW | ||
| (1) | 0.2987 | 6.42 | 0.88 | <0.0001 |
| (2) | 0.0043 | 9.35 | 0.89 | <0.0001 |
| (3) | -0.0131 | -0.28 | 0.89 | <0.0001 |
When verifying the Shapiro-Wilk test to evaluate normality, the best models were (2) and (3), since they presented a value of SW = 0.89 close to 1. The Schumacher model obtained a lower value of SW = 0.88, but despite this, it can be said that it showed normality of the errors. These results are lower than those obtained by García et al. (2007), obtaining a value of SW = 0.97 for C. odorata forest plantations in Quintana Roo, but despite having lower values, in the functions used the regression assumption is not being violated and therefore they are acceptable. The three models fulfilled the assumption of a homogeneous distribution of the residuals (Figure 3).
These results are higher than those of Martínez-Zurimendi et al. (2015) in the referred investigation with G. arborea in Tabasco, when they used the Chapman-Richards and Weibull models, in which the bias values were 4.05 m and 4.13 m, respectively; in the case of DA %, the numbers were higher too, 16.84 % for the Chapman - Richards model and 16.83 % for the Weibull model. In the aforementioned study carried out by Murillo-Brito et al. (2017) with the Schumacher model for forest plantations of C. odorata also in Tabasco, the figures were lower, the bias was -0.0398 m and the DA % of 1.9678 %, which resulted in a better fit than that obtained in this research with the same model. The equations obtained to estimate the guide curve were the following:
In equation (3), the parameter β 0 represents the asymptotic value or maximum height that trees can reach (theoretically at an infinite age), in this case at 28 years of age, when they measure up to 16.63 m, since it represents the universe of Ad-E data used to fit the equation. For its part, the parameter β 1 is considered a site-dependent parameter and represents the growth rate or the number of units that β0 increases when we vary one unit in β 1 , adjusting the scales by the exponential expression. The parameter β 2 is associated with the site.
The guide curves and the observed values were plotted to analyze the fidelity of the models, which is observed in Figure 4a, where the guide curve of the model (3) exhibits a better trend since it tends to pass in the middle of the cloud of observations, so it more precisely describes the database used in its adjustment. In the case of model (1), the guide curve at younger ages tends to underestimate and at older ages to overestimate, while model (2) overestimates on a large scale at younger ages. In this sense, the research by García et al. (2007) for the same species indicated that the best model that showed an adequate trend in the guide curve was that of Schumacher, and in the study by Murillo-Brito et al. (2017), the models that showed the best fidelity of the guide curves graphically with the observed data were Hosfeld IV, Monomolecular, Logistic and Gompertz.

Figure 4 Growth and increment of curves to generate the site index for Cedrela odorata L. in Quintana Roo, Mexico.
According to the above statements, the best model is (3), since the guide curve represents the average of the observed data, it presents an inflection point where ICA = IMA, according to this it can be said that it adequately describes the growth in tree height as a function of age (Figure 4b). Model (1) also has a culmination point, but the trend of the guide curve is not suitable for this study. In the case of model (2), it does not present an inflection point, which means that it does not adequately describe the database used in its adjustment and cannot be used to carry out the IS curves.
In order to calculate the age at which ICA = AMI, the formula proposed by Kiviste et al. (2002) was used; therefore, a technical growth shift in Ad of eight years was obtained for this species (Figure 4b). This is similar to what was obtained by García et al. (2007) for C. odorata in the southern region of the state of Quintana Roo, defining a culmination of growth in Ad of 6.38 years. On the other hand, the results differ from those obtained by García et al. (1998) who determined five IS (12 m, 14 m, 16 m, 18 m and 20 m) at an E 0 of 30 years in S. macrophylla plantations in Quintana Roo, with the Chapman and Richards and Weibull models, which in their polymorphic version overestimate height at young ages and underestimate it at older ages, however, this is possible due to the growth habits and ages of the plantations.
With equation (3), IS curves were constructed at an E 0 of 25 years (Figure 5), three IS classes were used (14 m, 17 m and 20 m). The anamorphic (a) and polymorphic (b) expressions using the guide curve method are expressed below:
(a) Anamorphic:
(b) Polymorphic:
Figure 5 Anamorphic (a) and polymorphic (b) growth curves of site index (IS, m) at the base age of 25 years in commercial forest plantations of Cedrela odorata L. in Quintana Roo, Mexico.
In Figure 5, the anamorphic (5a) and polymorphic (5b) -type IS curves can be seen superimposed with the observed data. These curves make it possible to classify C. odorata plantations according to their productivity and thus clearly differentiate their seasonal quality.
The curves are different in the growth trend of the curves generated by García et al. (1992) for S. macrophylla, since they obtained five classes of IS curves with the Chapman-Richards model, and by García et al. (2007) for C. odorata in Quintana Roo with the Schumacher model, which has a different geometry. For their part, Murillo-Brito et al. (2017) for C. odorata in the state of Tabasco, generated three IS curves with the Hossfeld IV model, resulting in site indexes of 11 to 19 m.
Figure 5 indicates that the anamorphic curves cover the trend of the dispersion interval of the data, which shows that the proposed method is correct to satisfy the aim of this study, although the IS curve of 20 slightly overestimates at older ages. In the case of the polymorphic growth curves (Figure 5b), they were assigned other labels different from IS, since with the 14 m, 17 m and 20 m values of the curves, they tend to overestimate the observed data on a large scale. The values of the 14 m, 15 m and 16 m labels used to construct the polymorphic curves vastly underestimate the observed data from Ad-E. With these results it can be asserted that the curves that presented the best degree of association with the observed data were those of the anamorphic type.
From the guide curve, the E 0 defined at 25 years and the three IS values, established at 14 m, 17 m and 20 m, it was possible to develop a system of anamorphic curves that represent the growth pattern for C. odorata in the central and southern region of Quintana Roo, Mexico.
With the expressions obtained, the IS of any plantation growing in the study area can be qualified. Assume a 23-year-old plantation with 14.55 m of average Ad and that the cutting shift in the region is 25 years, which will be defined as the reference age. These data are substituted in the expression and will indicate that the IS of that plantation is 16.57 m at the age of 25 years.
Conclusions
The Weibull model was the best fit for dominant height-age (Ad-E) data and for generating anamorphic and polymorphic site index curves of C. odorata in Quintana Roo, Mexico.
The polymorphic curves underestimate the growth in height of the dominant trees of the stands with the three site index labels (IS) used, while the anamorphic curves represent greater fidelity with the observed values, since they cover the trend of the interval of dispersion of data. For this reason, they are considered the most appropriate to qualify the IS in commercial forest plantations of C. odorata in Quintana Roo.
The information generated serves to form part of the planning methods for forest managers and technicians in forest management and exploitation activities, but the values obtained should be applied within the range of the variables Ad-E, which is from one to 28 years old.
Acknowledgements
To the Instituto Nacional de Investigaciones Forestales, Agrícolas y Pecuarias (INIFAP) for the support provided to carry out this work through the SIGI project number 3-0.8-87582501-F-E.1-1.
REFERENCES
Andenmatten E. y F. Letourneau. 1998. Curvas de índice de sitio y crecimiento en altura para pino oregón (Pseudotsuga menziesi Mirb. Franco) de aplicación en la región andino patagónica de las provincias de Río Negro y Chubut, Argentina. Revista de la Facultad de Agronomía. La Plata. 103: 69-75. http://revista.agro.unlp.edu.ar/index.php/revagro/article/view/239/156 (13 de marzo de 2020). [ Links ]
Álvarez G., J. G., M. Barrio A., U. Diéguez A. y A. Rojo A. 2004. Metodología para la construcción de curvas de calidad de estación. Cuadernos de la Sociedad Española de Ciencias Forestales 18(1):303-309. http://www.secforestales. org/web/images/stories/c18.pdf (23 de febrero de 2020). [ Links ]
Aguirre-Calderón, O. A. 2015. Manejo forestal en el siglo XXI. Madera y Bosques 21 (Núm. esp.): 17-28. Doi:10.21829/myb.2015.210423. [ Links ]
Burkhart, H. E. and M. Tomé. 2012. Modeling forest trees and stands. Springer Science & Business Media. New York, NY, USA. 458 p. [ Links ]
Carrero, O., M. Jerez, R. Macchiavelli, G. Orlandoni y J. Stock. 2008. Ajuste de curvas de Índice de Sitio mediante modelos mixtos para plantaciones de Eucalyptus urophylla en Venezuela. Interciencia 33(4): 265-272. http://ve.scielo.org/scielo.php?script=sci_arttext&pid=S0378-18442008000400007 (13 de febrero de 2020). [ Links ]
Clutter, J., J. Forston, L. Pienaar, G. Brister and R. Bailey. 1983. Timber management: a quantitative approach. John Wiley & Sons. New York NY, USA. 333 p. [ Links ]
Comisión Nacional Forestal (Conafor). 2016. Precios de productos forestales maderables: Reporte trimestral Enero/Marzo de 2016. Sistema Nacional de Información Forestal y Gerencia de Fomento a la Producción Forestal Sustentable. Guadalajara, Jal. México. http://www.cnf.gob.mx:8090/snif/portal/economica/sipre (13 de febrero de 2020). [ Links ]
Cornejo O., E. H., J. A. Pereyra G., O. Mares A., S. Valencia M. y C. Flores L. 2005. Índice de sitio para Pinus montezumae Lamb. en la región de Cd. Hidalgo, Michoacán. Revista Fitotecnia Mexicana 28(3): 213-219. http:// www.redalyc.org/articulo.oa?id=61028305 (21 de marzo de 2020). [ Links ]
Corral-Rivas, J. J., M. Bario-Anta, O. A. Aguirre-Calderón and U. Diéguez-Aranda. 2007. Use of stump diameter to estimate diameter at breast height and tree volume for major pine species in El Salto, Durango (México). Forestry 80 (1): 29-40. Doi: 10.1093/forestry/cpl048. https://academic.oup.com/forestry/article/80/1/29/634526 (18 de marzo de 2020). [ Links ]
Galán L., R., H. M. De los Santos P. y J. I. Valdez H. 2008. Crecimiento y rendimiento de Cedrela odorata L. y Tabebuia donnell-smithii Rose en San José Chacalapa, Pochutla, Oaxaca. Madera y Bosques 14(2):65-82. Doi: 10.21829/myb.2008.1421213. [ Links ]
Gaillard B., C., M. Pece, M. Juárez G. y N. Ríos. 2002. Estimación del crecimiento y producción de una plantación de paraíso gigante (Melia azedarach var. gigantea) sin riego en la provincia de Santiago del Estero, Argentina. Quebracho 9: 127-140. https://www.redalyc.org/pdf/481/48100912.pdf . (16 de marzo de 2020). [ Links ]
García, E. 1983. Modificaciones al sistema de clasificación climática de Köppen (para adaptarlo a las condiciones de la República Mexicana). Offset Larios S.A. México, D.F., México. 252 p. [ Links ]
García C., X., C. Parraguirre L. y B. Rodríguez S. 1992. Modelos de crecimiento para una plantación de caoba (Swietenia macrophylla King). Ciencia Forestal en México 17(71): 87-102. http://revistas.inifap.gob.mx/ index.php/Forestales/article/view/1184/1182 . (12 de febrero de 2020). [ Links ]
García C., X., H. Ramírez M., C. Rodríguez F., J. Jasso M. y C. Ortiz S. 1998. Índice de sitio para caoba (Swietenia macrophylla King) en Quintana Roo. Ciencia Forestal en México. 23(84): 9-18. http://www.inifap.gob.mx/revistas/ciencia_forestal_numeros.html 2009 (12 de febrero de 2020) [ Links ]
García C., X., J. G. Flores G. y J. D. Benavides S. 2007. Índice de sitio para Cedrela odorata L. (cedro rojo) en Quintana Roo. Ciencia Forestal en México 4(32): 101-148. http://www.inifap.gob.mx/revistas/ciencia_forestal_numeros.html y el año 2007 (12 de febrero de 2020). [ Links ]
García-Espinoza, G. G., O. A. Aguirre-Calderón, G. Quiñonez-Barraza, E. Alanís-Rodríguez, M. A. González-Tagle and J. J. García-Magaña. 2019. Global-local and fixed-random parameters to model dominant height growth of Pinus pseudostrobus Lindley. Revista Chapingo Serie Ciencias Forestales y del Ambiente 25(1): 141-156. Doi: 10.5154 / r.rchscfa.2018.06.047. [ Links ]
Gujarati, D. N. 2010. Econometría. 5ª edición. Editorial Mc Graw-Hill/ Interamericana. México, D.F., México. 921 p. [ Links ]
Hernández-Ramos, J., J. J. García-Magaña, E. H. Olvera-Delgadillo, J. C. Velarde-Ramírez, X. García-Cuevas y H. J. Muñoz-Flores. 2014. Índice de sitio para plantaciones de Pinus greggii Engelm: en Metztitlán, Hidalgo, México. Revista Chapingo, Serie Ciencias Forestales y del Ambiente 20(2): 167-176. Doi: 10.5154/r.rchscfa.2013.04.016. [ Links ]
Hernández-Ramos, J., J. J. García-Magaña, X. García-Cuevas, A. Hernández-Ramos, H. J. Muñoz-Flores y M. Samperio-Jiménez. 2015. Índice de sitio para bosques naturales de Pinus teocote Schlecht. & Cham., en el oriente del estado de Hidalgo. Revista Mexicana de Ciencias Forestales 6(27): 24-37. Doi: 10.29298/rmcf.v6i27.278. [ Links ]
Hernández-Ramos, J., J. I. Valdez-Hernández, X. García-Cuevas, A. E. Tadeo-Noble y V. J. Reyes-Hernández. 2020. Estimación de la edad de Swietenia macrophylla (Meliaceae) a partir del diámetro normal en poblaciones del sureste mexicano. Revista de Biología Tropical 68(1): 200-217. Doi: 10.15517/RBT.V68I1.37725. [ Links ]
Instituto Nacional de Estadística, Geografía e Informática (INEGI). 2016. Anuario estadístico y geográfico de Quintana Roo 2016. Aguascalientes, Ags., México. 385 p. [ Links ]
IUSS Grupo de trabajo WRB. 2007. Base referencial mundial del recurso suelo: Primera actualización. Informe sobre los recursos mundiales de suelos. Núm. 103. FAO. Roma, Italia. 117 p. [ Links ]
Kiviste A., J. G. Álvarez-González, A. Rojo-Alboreca y A. D. Ruiz G. 2002. Funciones de crecimiento de aplicación en el ámbito forestal. Instituto Nacional de Investigación y Tecnología Agraria y Alimentaria. Ministerio de Ciencia y Tecnología. La Coruña, España. 190 p. [ Links ]
Kozak, A. and R. Kozak. 2003. Does cross validation provide additional information in the evaluation of regression models? Canadian Journal of Forest Research 33: 976-987. Doi: 10.1139/x03-022. [ Links ]
Lencinas, J. D. y D. Mohr-Bell. 2007 Estimación de clases de edad de las plantaciones de la provincia de Corrientes, Argentina, con base en datos satelitales Landsat. Bosque 28(2): 106-118. Doi: 10.4067 / S0717-92002007000200003. [ Links ]
Madrigal H., S., C. J. Moreno y C. I. Vázquez. 2005. Comparación de dos métodos de construcción de curvas de índice de sitio para Pinus pseudostrobus Lindl. Región Hidalgo-Zinapécuaro, Michoacán. Revista Ciencia Nicolaita 40(1): 157–172. http://www.cic.umich.mx/documento/ciencia_ nicolaita/2005/40/Cn40-157.pdf . (16 de marzo de 2020). [ Links ]
Martínez-Zurimendi, P., M. Domínguez-Domínguez, A. Juárez-García, L. M. López-López, V. de-la-Cruz-Arias y J. Álvarez-Martínez. 2015. Índice de sitio y producción maderablee en plantaciones forestales comerciales de Gmelina arborea en Tabasco, México. Revista Fitotecnia Mexicana. 38(4): 415-425. Doi: 10.35196/rfm.2015.4.415. http://www.scielo.org.mx/pdf/rfm/v38n4/v38n4a10.pdf (15 de abril de 2020). [ Links ]
Minoche, D., C. Herrero, M. Domínguez D. and P. Martínez Z. 2017. Determining the site index of Teak (Tectona grandis L.) plantations in Tabasco, Mexico. Ciencia e Investigación Agraria 44(2):154-167. [ Links ]
Murillo-Brito, Y., M. Domínguez-Domínguez, P. Martínez-Zurimendi, L. del C. Lagunes-Espinoza y A. Aldrete. 2017. Índice de sitio en plantaciones de Cedrela odorata en el trópico húmedo de México. Revista de la Facultad de Ciencias Agrarias 49(1): 15-30. https://www.redalyc.org/articulo.oa?id=382852189002 (15 de abril de 2020). [ Links ]
Panik, M. J. 2013. Growth curve modelling: theory and applications. John Wiley & Sons, Incorporated. Somerset, NJ, USA. 413 p. [ Links ]
Pérez-González, G., M. Domínguez-Domínguez, P. Martínez-Zurimendi y J. D. Etchevers B. 2012. Caracterización dasométrica e índice de sitio en plantaciones de caoba en Tabasco, México. Madera y Bosques 18(1):7-24. Doi:10.21829/myb.2012.181511. [ Links ]
Prodan, M., R. Peters, F. Cox y P. Real. 1997. Mensura Forestal. Serie Investigación y Educación de Desarrollo Sostenible. Instituto Interamericano de Cooperación para la Agricultura. San José, Costa Rica. 561 p. [ Links ]
Quevedo R., A. M., M. Jerez y A. Y. Moret. 2004. Selección de modelos para predecir distribuciones diamétricas en plantaciones de teca a partir de variables del rodal con la función de Weibull. Revista Forestal Venezolana 48: 68-74. http://www.saber.ula.ve/handle/123456789/24286 . (18 de febrero de 2020). [ Links ]
Statistic Analysis System (SAS) 2016. SAS/STAT® 14.1 User´s Guide. SAS Institute Inc. Cary, NC, USA. https://support.sas.com/documentation/onlinedoc/stat/141/nlmixed.pdf (2 de febrero de 2020). [ Links ]
Tamarit-Urias, J. C., H. M. De los Santos-Posdas, A. Aldrete, J. R. Valdez-Lazalde, H. Ramírez-Maldonado y V. Guerra-De la Cruz. 2014. Ecuaciones dinámicas de índice de sitio para Tectona grandis en Campeche, México. Agrociencia 48(2): 225-238. http://www.scielo.org.mx/pdf/agro/v48n2/v48n2a8.pdf (10 de marzo de 2020). [ Links ]
Torres R., J. M. y O. S. Magaña T. 2001. Evaluación de plantaciones forestales. Ed. Limusa. México, D. F., México. 472 p. [ Links ]
Received: June 06, 2020; Accepted: October 28, 2020
 Este es un artículo publicado en acceso abierto bajo una licencia
Creative Commons
Este es un artículo publicado en acceso abierto bajo una licencia
Creative Commons
