


Services on Demand
Journal
Article
 text in
  English (pdf)
 Article in xml format
 Article references
 Send this article by e-mail
Indicators
-
 Cited by SciELO
 -
 Access statistics
Related links
-
 Similars in
SciELO
Similars in
SciELO
Share

 Permalink
Revista mexicana de ciencias forestales
Print version ISSN 2007-1132
Rev. mex. de cienc. forestales vol.12 n.63 México Jan./Feb. 2021 Epub Mar 26, 2021
https://doi.org/10.29298/rmcf.v12i63.808
Scientific article
Measurement of the leaf area index and its seasonal dynamics in Eucalyptus urophylla S. T. Blake plantations
1
 http://orcid.org/0000-0003-4058-1316
2
*
http://orcid.org/0000-0003-1888-6914
2
http://orcid.org/0000-0002-9550-2825
1Campo Experimental Saltillo. INIFAP. México.
2Posgrado en Ciencias Forestales. Colegio de Postgraduados. Campus Montecillo. México.
3Campo Experimental Chetumal, INIFAP. México.
4Woods Hole Research Center. Gilman Ordway Campus. USA.
Leaf area index (IAF, m2 m-2) is an indicator of productivity in forest plantations and can be used to describe the response of trees to the application of silvicultural practices. The objective of the study was to identify a precise and efficient method to estimate the IAF in commercial forest plantations of Eucalyptus urophylla. At the same time, the seasonal dynamics of the IAF was analyzed for one year. 28 sampling units were established in which monthly IAF measurements were made using the litter (IAF Hojarasca ) and optical (IAF Óptico ) collection methods. Additionally, a destructive sampling of 93 trees was implemented to estimate the IAF through allometry (IAF Alométrico ). The estimated average values of IAF were 2.7, 2.6 and 1.6 for the allometric, litter collection, and optical methods, respectively. This implied an average underestimation of 39 and 37 % of the optical method compared to the allometric and litter collection methods, respectively. A correlation analysis of the IAF estimates, obtained through the three methods applied, allowed to identify a high association (r = 0.75, Pearson's correlation coefficient) between the values estimated with the litter collection and optical methods. Based on this result (association), a regression model was adjusted to calibrate IAF Óptico values (indirect measurements) to more precise estimates, IAF Calibrado . The maximum value of IAF was recorded during July and August, months of greatest growth for E. urophylla under commercial plantation conditions in Mexico.
Key words: Allometry; leaf area; hemispheric photography; gaps fraction; leaf litter; commercial forest plantations
El índice de área foliar (IAF, m2 m-2) es un indicador de productividad en las plantaciones forestales y puede usarse para describir la respuesta de los árboles a la aplicación de prácticas silvícolas. El objetivo del estudio fue identificar un método preciso y eficiente para estimar el IAF en plantaciones forestales comerciales de Eucalyptus urophylla. Paralelamente, se analizó la dinámica estacional del IAF durante un año. Se establecieron 28 unidades de muestreo en las que se realizaron mediciones mensuales de IAF, con los métodos de recolección de hojarasca (IAF Hojarasca ) y óptico (IAF Óptico ). Además, se implementó un muestreo destructivo de 93 árboles para estimar el IAF mediante alométria (IAF Alométrico ). Los valores promedio estimados de IAF fueron 2.7, 2.6 y 1.6 para el método alométrico, recolección de hojarasca y óptico, respectivamente. Esto implicó una subestimación promedio de 39 y 37 % del método óptico, en comparación con los métodos alométrico y de recolección de hojarasca. Un análisis de correlación de las estimaciones de IAF, obtenidas con los tres métodos aplicados, permitió identificar una alta asociación (r= 0.75, coeficiente de correlación de Pearson) entre los valores estimados con los métodos de recolección de hojarasca y óptico. Con base en este resultado (asociación) se ajustó un modelo de regresión, a fin de calibrar las mediciones indirectas (IAF Óptico ) a un valor más preciso, IAF Calibrado . El valor máximo de IAF se registró en julio y agosto, meses del mayor crecimiento para E. urophylla en condiciones de plantación comercial en México.
Palabras clave Alometría; área foliar; fotografía hemisférica; fracción de huecos; hojarasca; plantaciones forestales comerciales
Introduction
Leaf area (AF, for its acronym in Spanish) is the surface in which energy and matter are exchanged between a plant and the atmosphere; it is considered a key variable to model the growth of trees and the conditions of a forest (Guangjian et al., 2019). Its dynamics can be analyzed by parameters such as the leaf area index (IAF, for its acronym in Spanish), defined as the number of leaves present per unit area (m2 m-2) (Sun et al., 2019). IAF is used as an indicator to assess the productivity of ecosystems and forest plantations (Papamija and García, 2012).
The methods to estimate the IAF are direct or indirect. The former require destructive sampling and involve the direct measurement of the tree's foliage or the collection of litter over a period, which makes them costly and slow to apply (Muñoz et al., 2008), which limits their use to large scale. Indirect methods can be based on the measurement of solar radiation that penetrates the forest floor through the canopy of the trees (Hu et al., 2014). These methods are an efficient alternative for measuring IAF in different types of forest vegetation (Martínez et al., 2006; Chen et al., 2018). However, despite their efficiency, indirect methods tend to present bias in the estimates, so it is common to turn to the use of mixed methods that establish precise mathematical relationships between allometric estimates (direct) and optical measurements (indirect) (Aguirre-Salado et al., 2011; Guangjian et al., 2019).
The estimation of IAF in commercial forest plantations (PFC) is important to determine their productive potential and to establish possible growth responses due to forestry management (Papamija and García, 2012). For this reason, it is justified to determine the most efficient and precise method to estimate this index for each species used in plantations. In Mexico, the Eucalyptus genus is the second most frequent in PFC (Conafor, 2014), in particular E. urophylla S. T. Blake, a well-adapted and fast-growing species in tropical regions (Wright, 1997).
The main objective of this study was to estimate IAF by direct and indirect methods in E. urophylla commercial forest plantations, based on the hypothesis that indirect measurements of IAF can provide reliable information and with less effort to measure the dynamics of growth and status of forest plantations. At the same time, it was sought to analyze the seasonal dynamics of IAF for one year.
Materials and Methods
Study area
The study was carried out in commercial forest plantations of E. urophylla established in Huimanguillo, Tabasco, Mexico (17°55' N, 94°06' W) (Figure 1), where the average altitude is 30 m. The climate is warm humid (Am (f)), with rains in summer, 2 500 mm average annual rainfall and average annual temperature around 26 °C (García, 1998). Soils are of the Feozem type (INEGI, 2005). The surrounding vegetation is composed of remnants of high evergreen forest and secondary vegetation (Conafor, 2012). The plantations are between one and seven years old and were established at an average spacing of 2.5 m × 3.5 m between plants and rows, at an average density of 1 367 trees ha-1 with E. urophylla clonal plants.

Data collection in the field. Through selective sampling, with special attention to respecting the original plantation density or with the least possible loss of trees, four rectangular sites of 500 m2 per plantation were demarcated. In total, 28 sampling sites were established distributed in seven plantations, each one with a different age - from one to seven years old. At the beginning and end of the study (July 2014 and August 2015, respectively) the normal diameter (Dn, cm) was measured with a 95 cm Mantax Black caliper and the total height (At, m) with a SUUNTO clinometer of all trees within the sampling sites.
To estimate the IAF by means of the litter collection method, circular capture traps of 1 m2 of surface were placed, 1 m above the ground. In total, 112 traps were placed (16 per plantation, 4 per sampling site). On a monthly basis, from August 2014 to July 2015, the litter present in the traps was collected and dehydrated until reaching constant weight (about 72 hrs) in a drying SHEL LAB SMO14-2 oven at 70 °C. Subsequently, dry weight (g) was obtained by a 0.01 g precision OHAUS NavigatorTM scale.
The optical method involved obtaining five hemispheric photographs (FH, for its acronym in Spanish) at each sampling site by using a Nikon Coolpix D3100 camera (Figure 2), equipped with a 5 mm “fish eye” type lens. The FHs were obtained according to the minimum sample size defined by Whitford et al. (1995). Each sampling site was divided into four sections to take one FH per section and one more in the center. The monthly sample was 140 FH, which were analyzed with the Hemisfer© Patrick Schleppi version 2.13 application, an application that integrates a wide variety of methodologies to estimate the IAF (Schleppi et al., 2007).
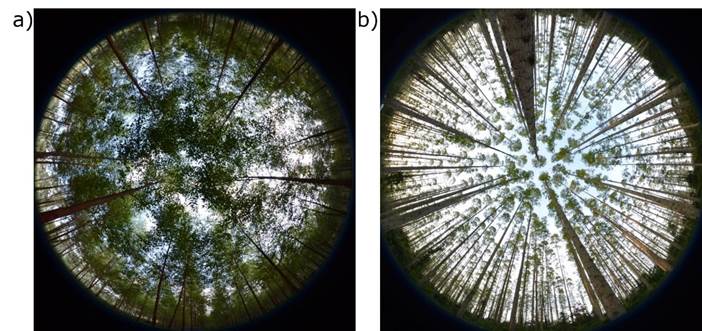
Figure 2 Examples of hemispheric photographs taken in one-year (a) and seven-year (b) old plantations.
The IAF allometric estimation involved the destructive sampling of 93 trees selected from seven plantations of different age (15, 13, 12, 12, 12, 15 and 14 individuals in the plantations of one to seven years, respectively), distributed in a 7.8 to 33.2 cm interval of normal diameter and in total height between 8.5 and 33.3 m. According to Jonckheere et al. (2004), the sample obtained is representative to estimate the specific leaf area (AFE, for its acronym in Spanish, m2 kg-1) and the projected leaf area (AFP, for its acronym in Spanish, m2). The total weight of the green foliage of each felled tree was recorded and a sample (0.5 kg) of foliage was extracted from different parts of the crown per tree, which was dehydrated at 72 °C to determine its dry weight on a 0.01g OHAUS NavigatorTM precision scale. The felled trees were measured for stump diameter (Dt, cm) and normal diameter (Dn, cm) with a 95 cm Mantax BlackTM caliper; in addition to the total height (At, m) with a 30 m Truper 12639 measuring tape. With these data, allometric equations were generated to estimate AFE and AFP.
Estimation of the specific leaf area. The AFE was estimated at the tree level (AFE Individual , m2 kg-1) by the arithmetic calculation used by Cano et al. (1996) and Muñoz et al. (2008). In a subsample of 60 leaves, of the initial sample of foliage collected from each felled tree, the adaxial leaf area of each leaf (AF Hoja ) (m2) was measured with a foliar integrator (Li-COR 3000C). They were then dried and weighed to obtain the dry biomass per leaf (BS Hoja ) (kg). Through the quotient of AF Hoja and BS Hoja (Equation 1) the individual AFE of each tree was obtained. After that, the values were averaged to obtain a value by plantation age:
Estimation of the projected leaf area. The AFP Individual (m2) per tree was estimated as a result of AFE Individual and the dry leaf biomass (BFS Total ) (kg) (Equation 2). BFS Total was calculated by the methodology recommended by Muñoz et al. (2008), which comes from multiplying the green leaf weight (PFV individual ) by the dry weight/green weight quotient (R Muestra ) of leaves from the foliage simple per felled tree (Equation 3).
Estimation of the leaf area index. The IAF was estimated by the allometric, litter collection and optic methods. For the first one, the BFS Total for each tree at the sampling sites was initially calculated with the equations suggested by Hernández-Ramos et al. (2017) for the species, using the allometric variables. After that, with the calculated BFS Total , the AFP Individual was estimated for each tree in the site, from the model adjusted in this document and described in the results. These estimations allowed to obtain IAFAlométrico (m2 m-2) (Equation 4) to the site level for the two measurement dates (Initial: July, 2014 and final: August, 2015).
Where:
IAF Alométrico = Leaf area index per site calculated through allometric relations
AFP Individual = Projected leaf area estimated per tree (m2)
AS = Area of the site (m2)
n = Number of trees at the site
The IAF estimation by means of litter collection (IAF Hojarasca ) for each sampling site resulted from the weight of the dry litter accumulated during a year in a trap and the value of the average AFE Individual for a plantation of the same age; at the end, the four values obtained per trap were averaged to obtain an IAF value per site (Liu et al., 2015).
The optical IAF (IAF Óptico ) was estimated monthly with the Hemisfer© Patrick Schleppi version 2.13 program, from the individual processing of the FHs taken at each site, with the Thimonier et al. (2010) method, which consists of weighting the IAF values estimated from the Norman and Campbell Ellipsoidal method with a regression model that integrates the leaf insertion angle and the solar radiation under the canopy as predictive variables (Lang and Yueqin, 1986). The result of the previous process was applied a correction factor for clustering of the canopy and foliage not randomly distributed, to reduce the underestimation of the IAF caused by a greater input of solar radiation (Chen and Cihlar, 1995; Liu et al., 2015). The IAF Óptico value per site corresponds to the average of the values calculated for the five FHs taken at the site.
In spite of the corrections made to the optical method, the calculated values tend to underestimate the real IAF values (Weiss et al., 2004). To reduce this bias, the calibration proposed by Aguirre-Salado et al. (2011) was made, which consists of adjusting regression models in which the IAF Alométrico or IAF Hojarasca are dependent variables and the IAF Óptico is the independent variable. The result is a calibrated IAF value (IAF Calibrado ).
Statistical analysis. The values of AFE Individual and AFP Individual obtained from destructive sampling data were analyzed using an ANOVA, defining the planting age as the primary factor. Differences between means were evaluated with the Tukey test. The correlation between the AFP and AFE variables with the Dn, At and BFS Total variables was analyzed with the Pearson's correlation coefficient. The variables related to a greater degree with the AFP and the AFE served as the basis to adjust the non-linear regression models (Table 1) (Cano et al., 1996; Aguirre-Salado et al., 2011).
Table 1 Adjusted models to estimate the projected leaf area (AFP) and the calibrated leaf area index in Eucalyptus urophylla S. T. Blake.plantations.
| Model | Type of model | Structure |
|---|---|---|
| 1 | Chapman-Richards |
|
| 2 | Monserud y Sterba |
|
| 3 | Power |
|
| 4 | Schumacher Cobb-Webb |
|
| 5 | Schumacher´s exponential |
|
y = Dependient variable; χ n = Normal diameter (Dn); At = Total height; Ab = Basimetric area; Vt = Total volume; BFS Total = Dry leaf biomass; B n = Parameters of the model.
For IAF, the estimated values by the three methods used were plotted and compared by means of a Pearson correlation analysis. It should be noted that for the comparison of the allometric and optical IAF, the values and FH corresponding to the same measurement date were used to avoid a temporality error. The direct and indirect methods mostly related were used to generate a calibrated IAF Calibrado from a non-linear regression model, with the models in Table 1. The selection of the models with the best fit was made considering the highest adjusted R 2 value and the lowest value of the root mean square error (RECM), in addition to the significance of its parameters. The selected models were analyzed to corroborate compliance with the regression assumptions using the Shapiro-Wilk test for normality and the White test to detect heteroskedasticity (p≥0.05). Given that the data presented this last problem, specifically the IAF, a residual correction was applied using the AFP/ROOT variable (BFS 2 ). Finally, the Durbin-Watson test was applied to detect collinearity between variables. The analysis was carried out using the PROC MODEL procedure of SAS 9.4 Institute Inc. (SAS, 2014).
Results and Discussion
Specific leaf area and projected leaf area. The average value of AFE Individual and AFP was 8.024 m2 kg-1 and 35.995 m2, respectively, for the sample. Both variables showed significant differences (P = 0.0001) between the averages of the trees with different ages (Figure 3). The comparison of means showed a higher value of AFE (8.56 m2 kg-1) in the one-year-old plantation. In contrast, the four-year plantation yielded the lowest value (7.36 m2 kg-1). The highest value of individual AFP was presented by the seven-year plantation (52.23 m2) and the lowest value (14.18 m2) was calculated for four-year plantations, coinciding with the lowest value of AFE. The AFE is lower at the age of four and five years of planting (Figure 3A). This tendency can be explained by the adaptation of the leaves to competition for light, water stress and management practices at intermediate ages of growth (Vega et al., 2010). Other species show a similar trend. For example, Pinus patula Schiede ex Schltdl. et Cham. showed a 6 % reduction when going from one to two years of age, which was attributed to the increase in structural components and substances in the older foliage, making it heavier (Cano et al., 1996). On the other hand, the AFE values obtained in this study that vary between 7.36 and 8.56 m2 kg-1 are high, which may be related to the high density of the plantations (1 367 trees ha-1), as demonstrated by Muñoz et al. (2008) for Eucalyptus nitens H. Deane & Maiden, who calculated the highest AFE values in plantations with higher densities.
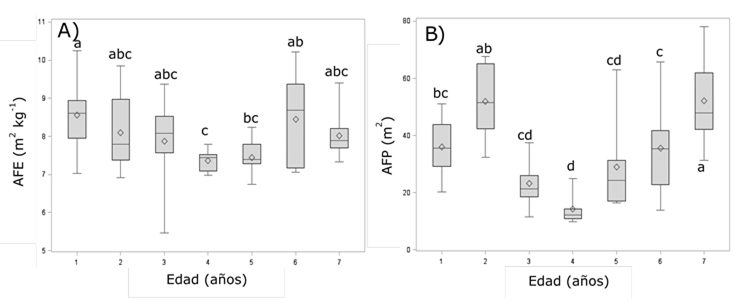
Different letters indicate statistical difference (Tukey, p≤0.05) in their mean.
Figure 3 Trend of (A) specific leaf area (AFE, m2 kg-1) and (B) projected leaf area (AFP, m2) in regard to the age of the plantation.
In the AFP an irregular behavior was observed, since it increased in the first years of growth, later it decreased and then increased again (Figure 3B). This variation is due to the mortality that is registered in the plantations, in which, by losing individuals, the AFP decreases in the short term and then increases due to the increase in the availability of nutrients, water and light, which allows generating more foliage per unit area (Rodríguez-Ortiz et al., 2011), which favors capturing more solar radiation to increase the photosynthetic rate.
Relationship of the AFE and AFP with structural variables of the plantation. In the case of AFE, this relationship is negative and not significant, so no regression models were adjusted. For AFP, the correlation is positive (BFS Total [0.97] and Dn [0.50]), which indicates a greater amount of leaves as the dimensions of the tree increase, especially the width of the normal diameter and, consequently, the crown diameter (Rodríguez-Ortiz et al., 2011).
Model 3 exhibited R
2
ajustada
high values, low for RCME, highly significant
parameters, normality (Shapiro-Wilk with a 0.95 value), inexistence of
collinearity (Durbin-Watson test (1.67) and logical estimations of
AFP for the low study sites (Table 2). However heterocedasticity problems occurred, which
were solved by correction for weighting residuals with the
AFP/RAÍZ (BFS
2
) variable. The correction of the model improved the fit statistics
(R
2
ajustada
= 0.9526, RECM= 0.9077 and its structure:
Table 2 Statistics and values of the statistical parameters of the adjusted models to estimate the projected leaf area.
| Mo | RECM | R 2 ajustada | Parameter | Estimator | EE | t value | Pr > |t| |
|---|---|---|---|---|---|---|---|
| 1 | 4.2141 | 0.943 | B 0 | 163.6677 | 78.6830 | 2.08 | 0.0410 |
| B 1 | 0.072823 | 0.0512 | 1.42 | 0.1591 | |||
| B 2 | 1.169669 | 0.1657 | 7.06 | <0.0001 | |||
| 2 | 8.1996 | 0.784 | B 0 | 3.972913 | 0.8064 | 4.93 | <0.0001 |
| B 1 | -1.14553 | 0.0731 | -15.67 | <0.0001 | |||
| 3 | 4.2394 | 0.942 | B 0 | 8.508989 | 0.4954 | 17.18 | <0.0001 |
| B 1 | 0.964571 | 0.0320 | 30.19 | <0.0001 | |||
| 4 | 4.2404 | 0.942 | B 0 | 9.244596 | 0.9333 | 9.91 | <0.0001 |
| B 1 | -0.03867 | 0.0389 | -0.99 | 0.3238 | |||
| B 2 | 0.982786 | 0.0367 | 26.76 | <0.0001 | |||
| 5 | 5.2332 | 0.912 | B 0 | 103.333 | 4.1930 | 24.64 | <0.0001 |
| B 1 | 4.322394 | 0.2083 | 20.75 | <0.0001 |
RECM = Root of the mean square error; R 2 ajustada = Adjusted coefficient of determination; EE = Standard error; B n = Parameters of the model; Valor t = Value of the Student t distribution; Pr>|t| = Significance.
Leaf area index. The estimated values of average IAF that include the seven plantations are 2.7, 2.6 and 1.6 m2 m-2, within the ranges 1.8 to 3.7, 1.3 to 4.2 and 1.0 to 2.6 m2 m-2, for IAF Alométrico , IAF Hojarasca e IAF Óptico , respectively. The allometric method estimated the highest value of IAF in the one-year plantation and the lowest was recorded for the three-year old (Figure 4). The highest IAF Hojarasca value was recorded in the seven-year-old plantation and the lowest in the four-year-old. The IAF Óptico value was higher in the seven- and one-year-old plantations and the rest presented homogeneous values of less than 1.7 m2 m-2.
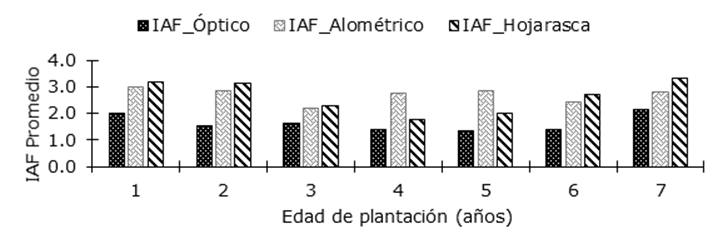
Figure 4 Leaf area index (IAF) estimated by direct and indirect methods for Eucalyptus urophylla S.T. Blake plantations.
If the direct methods are considered as a reference, the IAF Óptico presented an average underestimation of -39 and -37 % in the evaluated plantations, with the IAF Alométrico and the IAF Hojarasca , respectively. Although an average percentage difference of 8 % was verified between the direct methods, for all plantations, the IAF Hojarasca value was taken as a reference parameter since, in addition to estimating the IAF with precision; it allows describing its dynamics during a growth cycle. In addition, its measurement is not destructive of the trees, as demonstrated by Castellanos and León (2010) when modeling the monthly foliar production of Acacia mangium Willd. In other words, the IAF Hojarasca value was considered the basis for the comparisons between methods and for the calibration of the values obtained using the indirect method (IAF Óptico ), since this method predicts the mean and spatial variability of IAF with greater precision (Iwamoto and Hiura, 2011).
The correlation of the IAF Alométrico values with the IAF Óptico and the IAF Hojarasca is 0.30 and 0.33 respectively, which are inadequate to fit a regression model. However, the correlation between the IAF Óptico and IAF Hojarasca is 0.75. Therefore, the models presented in Table 1 were adjusted to calibrate the IAF Óptico using the IAF Hojarasca . The time of measurement of the allometric method corresponded to the beginning of leaf production, which surely influenced the low values of the IAF Alométrico compared to the IAF Hojarasca .
Except for the power type model (Table 1, model 3), the models tested to calibrate the IAF presented low adjustments. Model 3 had a reasonable adjustment in the calibration of the IAF Óptico in regard to the IAF Hojarasca (Table 3). These two techniques can be compared at the site level since the litter collection and hemispheric photographs were made without spatial difference (Figure 5). The selected model showed normality with a statistic of W = 0.94, the White test indicated homoscedasticity and the Durbin-Watson statistic was 1.78, which means there is non-collinearity between variables.
Table 3 Adjustment statistics of the power model (model 3) to calibrate the estimates of the leaf area index of Eucalyptus urophylla S.T. Blake.
| IAF | Mo | B 0 | B 1 | B 2 | RECM | R 2 ajustada |
|---|---|---|---|---|---|---|
| Litter vs Optical | 3 | 1.650636 | 0.956617 | - | 0.428 | 0.55 |
RECM = Root of the mean square error; R 2 ajustada = Adjusted coefficient of determination; B n = Parameters of the model.
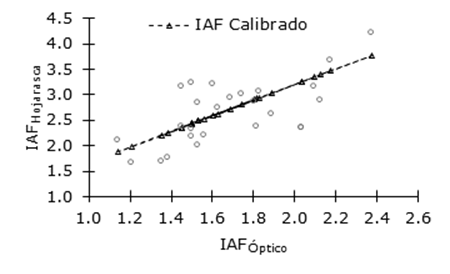
Figure 5 Scatter diagram of the leaf area index, real data (litter
collection) and estimates (IAF
Calibrado
) (
The estimated IAF values are similar to those of E. nitens plantations in the Central Zone of Chile, with + values between 1.63 and 2.55 m2 m-2 for densities of 1 100 trees ha-1. At the same time, these values are low compared to lower density plantations due to the competition for space among the trees for the development of the crown (Muñoz et al., 2008). Papamija and García (2012) recorded IAF Alométrico values of 2.30 to 3.20 m2 m-2 for Eucalyptus grandis W. Hill ex Maiden plantations established in Colombia and even higher with the optical method, from 2.42 to 3.64 m2 m-2, which differs from that calculated in this study, in which the IAF Óptico underestimates the value obtained by allometry, in addition to obtaining a correlation coefficient between the two methods equal to 0.011.
Macfarlane et al. (2007) determined an IAF of 3.0 m2 m-2 for Eucalyptus marginata Donn ex Sm. plantations of 12-years old using the allometric method and 1.77 m2 m-2 using the optical method with correction for FH agglutination, which represents a 41 % underestimation. In a similar way, Chen and Cihlar (1995) determined underestimations of the IAF in a range of 15 to 25 % by means of the optical method due to the agglutination of the foliage, for which they recommended applying a correction to reduce the error by integrating a parameter of branch area index. This variation in the low estimates of the IAF Óptico is due to factors such as the automatic exposure of the lens towards the light (Thimonier et al., 2010); the clumping effect of the tree canopies (Weiss et al., 2004) and the subjective choice of threshold when analyzing images with any program (Coops et al., 2004).
Monthly dynamics of the leaf area index. With the adjusted model (IAF Calibrado ) and the IAF Óptico measurements, the monthly IAF values were calculated (Figure 6). As expected, these values presented a negative relationship with the fall of litter, that is, the maximum peaks of leaf collection agree with low values of IAF in the plantations. During the months of February to May, there was an increase in the fall of litter and consequently a decrease in the IAF in E. urophylla (Figure 6), the values varied between 2.14 and 2.20 m2 m-2 in the season of lower production. In June and July an increase in the IAF was observed, corresponding to the time of maximum leaf production and the beginning of the growth stage, when they reached maximum values from July to September of 2.65 to 2.71 m2 m-2.
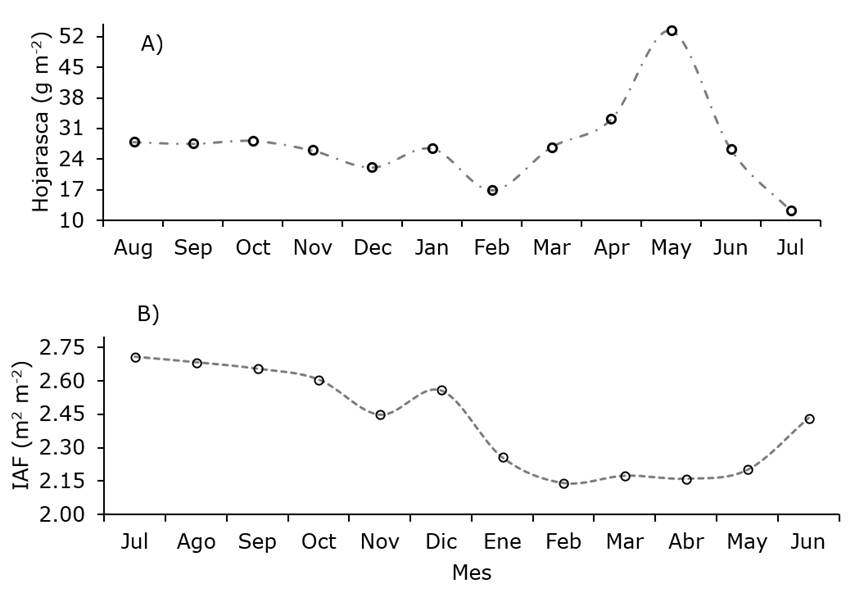
Figure 6 Monthly dynamics of litter fall (A) and leaf area index (B) for Eucalyptus urophylla S. T. Blake plantations.
In November took place a steep decline in the IAF value from an increment in litter fall in October; however, the following month a foliar recovery was observed, indicating that during the rainy or growing season E. urophylla presents a continuous replacement of foliage according to water availability. This behavior is similar to that described by Castellanos and León (2010) for Acacia mangium forest plantations, in which the highest peak of foliar production occurred at the beginning and during the rainy season (July to October).
Theoretically, older plantations should have a high IAF, however, for the case studied, the highest IAF value was presented in younger plantations, with a decreasing trend as age increases. If the mentioned by Peduzzi et al. (2010) regarding that the IAF is an indicator of the productivity of the land, the values found indicate that the evaluated plantations of four and five years are the ones with the lowest production by registering the lowest values of IAF in comparison with the plantations of other ages. Greater efficiency in activities such as fertilization, weed control and thinning is expected when carried out in young plantations due to the greater amount of foliage they have.
Conclusions
The litter collection method (IAF Hojarasca ) was considered the most accurate for the purpose because it involved the monthly collection of litter during an annual growth cycle of the species, which also allowed a detailed description of the dynamics of the index of leaf area. Based on the results obtained by this method, and in order to recommend an alternative to estimate the IAF efficiently and accurately, a regression model was generated that calibrates initial measurements of IAF obtained through an indirect method (IAF Óptico ), easy to obtain but with low precision, to make a more adequate and efficient estimation of the leaf area index (IAF Calibrado ).
In regard to the dynamics of IAF, the analysis carried out allows to conclude that the highest production of leaves occurs in the rainy season (from June to October), which corresponds to the season of greatest growth of E. urophylla. Therefore, it is reasonable to assume that the application of forestry management practices such as fertilization and weeding would be more effective if applied at this time.
Acknowledgements
This research was supported in part by the US Department of Agriculture, Office of International Programs, Forest Service, through the Northern Research Station and the Sustainable Landscapes Program of the US Agency for International Development, and by PROTEAK company, owner of the studied plantations.
REFERENCES
Aguirre-Salado, C. A., J. R. Valdez-Lazalde, G. Ángeles-Pérez, H. M. Santos-Posadas and A. l. Aguirre-Salado. 2011. Mapping leaf area index and canopy cover using hemispherical photography and spot 5 HRG data: regression and k-nn. Agrociencia 45(1): 105-119. https://agrociencia-colpos.mx/index.php/agrociencia/article/view/863 (10 de julio de 2020). [ Links ]
Cano M., E. E., A. Velázquez M., J. J. Vargas H., C. Rodríguez F. y A. M. Fierros G. 1996. Área foliar específica en Pinus patula: efecto del tamaño del árbol, edad del follaje y posición de la copa. Agrociencia 30(1): 117-122. https://agrociencia-colpos.mx/index.php/agrociencia/article/view/1350 (10 de julio de 2020). [ Links ]
Castellanos B., J. y J. D. León P. 2010. Caída de hojarasca y dinámica de nutrientes en plantaciones de Acacia mangium (Mimosaceae) de Antioquia, Colombia. Acta Biológica Colombiana 15(2): 8 p. https://www.redalyc.org/pdf/3190/319027885020.pdf (17 de septiembre de 2020). [ Links ]
Chen, Y., W. Zhang, R. Hu, J. Qi, J. Shao, D. Li, P. Wan, C. Qiao, A. Shen and G. Yan. 2018. Estimation of forest leaf area index using terrestrial laser scanning data and path length distribution model in open-canopy forests. Agricultural and Forest Meteorology 263: 323-333. Doi: 10.1016/j.agrformet.2018.09.006. [ Links ]
Chen, J. M. and J. Cihlar. 1995. Quantifying the effect of canopy architecture on optical measurements of leaf area index using two gap size analysis methods. Transactions on Geoscience and Remote Sensing 33: 777-787. Doi: 10.1109/36.387593. [ Links ]
Comisión Nacional Forestal (Conafor). 2012. Situación actual y perspectivas de las plantaciones forestales comerciales en México. http://www.conafor.gob.mx:8080/biblioteca/ver.aspx?articulo=434 (10 de julio de 2020). [ Links ]
Comisión Nacional Forestal (Conafor). 2014. Superficies de plantaciones forestales comerciales establecidas por año con apoyos de la Conafor. http://www.conafor.gob.mx/web/temas-forestales/plantaciones-forestales/ (17 de marzo de 2019). [ Links ]
Coops, N. C., M. L. Smith, K. L. Jacobsen, M. Martin and S. Ollinger. 2004. Estimation of plant and leaf area index using three techniques in a mature native eucalypt canopy. Austral Ecology 29: 332-341. Doi: 10.1111/j.1442-9993.2004.01370.x. [ Links ]
García, E. 1998. Climas (clasificación de Köppen, modificado por García). Escala 1:1000000. Comisión Nacional para el Conocimiento y Uso de la Biodiversidad México. http://www.conabio.gob.mx/informacion/gis/ (15 de septiembre de 2020). [ Links ]
Guangjian, Y., H. Ronghail, L. Jinghuil, W. Marie, J. Hailan, M. Xihan, X. Donghui and Z. Wuming. 2019. Review of indirect optical measurements of leaf area index: Recent advances, challenges, and perspectives. Agricultural and Forest Meteorology 265: 390-411. Doi: 10.1016/j.agrformet.2018.11.033. [ Links ]
Hernández-Ramos, J., H. M. Santos-Posadas , J. R. Valdez-Lazalde , J. C. Tamarit-Urias , G. Ángeles-Pérez , A. Hernández-Ramos, A. Peduzzi and O. Carrero. 2017. Aboveground biomass and expansion factors in commercial forest plantations of Eucalyptus urophylla S. T. Blake. Agrociencia 51(8): 921-938. https://agrociencia-colpos.mx/index.php/agrociencia/article/view/1336 (10 de julio de 2020). [ Links ]
Hu, R., G. Yan , X. Mu and J. Lou. 2014. Indirect measurement of leaf area index on the basis of path length distribution. Remote Sensing of Environment 155: 239-247. Doi: 10.1016/j.rse.2014.08.032. [ Links ]
Instituto Nacional de Estadística, Geografía e Informática (INEGI). 2005. Marco Geoestadístico Municipal 2005, versión 3.1. https://www.inegi.org.mx/temas/mg/ (10 de julio de 2020). [ Links ]
Iwamoto I., M. and T. Hiura. 2011. Modeling leaf area index from litter collection and tree data in a deciduous broadleaf forest. Agricultural and Forest Meteorology 151: 1016-1022. Doi: 10.1016/j.agrformet.2011.02.007. [ Links ]
Jonckheere, I., S. Fleck, K. Nackaerts, B. Muys, P. Coppin, M. Weiss and F. Baret. 2004. Review of methods for in situ leaf area index determination, Part I. Theories, sensors and hemispherical photography. Agricultural and Forest Meteorology 121: 19-35. Doi: 10.1016/j.agrformet.2003.08.027. [ Links ]
Lang, A. R. G. and X. Yueqin. 1986. Estimation of leaf area index from transmission of direct sunlight in discontinuous canopies. Agricultural and Forest Meteorology 37: 229-243. Doi: 10.1016/0168-1923(86)90033-X. [ Links ]
Liu, Z., G. Jin and M. Zhou. 2015. Evaluation and correction of optically derived leaf area index in different temperate forests. iForest: Biogeosciences and Forestry 9: 55-62. Doi: 10.3832/ifor1350-008. [ Links ]
Macfarlane, C., M. Hoffman, D. Eamus, N. Kerp, S. Higginson, R. McMurtrie and M. Adams. 2007. Estimation of leaf area index in eucalypt forest using digital photography. Agricultural and Forest Meteorology 143: 176-188. Doi: 10.1016/j.agrformet.2006.10.013. [ Links ]
Martínez, B., F. Camacho C. y F. J. García H. 2006. Estimación de parámetros biofísicos de vegetación utilizando el método de la cámara hemisférica. Revista de Teledetección 26: 5-17. http://www.aet.org.es/revistas/revista26/AET26-01.pdf (10 de julio de 2020). [ Links ]
Muñoz, F., M. Espinosa, J. Cancino, R. Rubilar y M. Herrera. 2008. Efecto de la poda y raleo en el área foliar de Eucalyptus nitens. Bosques 29: 44-51. Doi: 10.4067/S0717-92002008000100005. [ Links ]
Papamija, M. D. y S. C. García. 2012. Estimación del índice de área foliar en plantaciones de Eucalyptus grandis W. Hill. Colombia Forestal 15: 261-271. Doi: 10.14483/udistrital.jour.colomb.for.2012.2.a09. [ Links ]
Peduzzi, A., A. H. Lee and R. H. Wynne. 2010. Leaf area of overstory and understory in pine plantations in the flatwoods. Southern Journal of Applied Forestry 34: 154-160. Doi: 10.1093/sjaf/34.4.154. [ Links ]
Rodríguez-Ortíz, G., V. A. González-Hernández, A. Aldrete, H. M. De Los Santos-Posadas, A. Gómez-Guerrero y A. M. Fierros-González. 2011. Modelos para estimar crecimiento y eficiencia de crecimiento en plantaciones de Pinus patula en respuesta al aclareo. Revista Fitotecnica Mexicana 34(3): 105-212. http://www.scielo.org.mx/scielo.php?script=sci_arttext&pid=S0187-73802011000300012 (17 de septiembre de 2020). [ Links ]
Schleppi, P., M. Conedera, I. Sedivy and A. Thimonier. 2007. Correcting non-linearity and slope effects in the estimation of the leas area index of forests from hemispherical photographs. Agricultural and Forest Meteorology 144: 236-242. Doi: 10.1016/j.agrformet.2007.02.004. [ Links ]
Statistical Analysis System (SAS). 2014. SAS/ETS® 13.2 User’s Guide The MODEL Procedure. SAS Institute Inc. Cary, NC, USA. 1783 p. [ Links ]
Sun, Q., X. Gu, L. Sun, G. Yang, L. Zhou and W. Gou. 2019. Dynamic change in rice leaf area index and spectral response under flooding stress. Paddy and Water Environment. Doi: 10.1007/s10333-019-00776-5. [ Links ]
Thimonier, A., I. Sedivy and P. Schleppi. 2010. Estimating leaf area index in different types of mature forest stands in Switzerland: a comparison of methods. European Journal of Forest Research 129: 543-562. Doi: 10.1007/s10342-009-0353-8. [ Links ]
Vega, M., M. Pizano y S. Barth. 2010. Variación del área foliar específica en Pinus elliottii var. elliottii Engelm. X Pinus caribaea var hondurensis Morelet. y su extrapolación al cálculo del área foliar proyectada. 14as Jornadas Técnias Forestales y Ambientales. Facultad de Ciencias Forestales, UNaM - EEA Montecarlo, INTA. Eldorado, Misiones, Argentina. 8 p. https://inta.gob.ar/sites/default/files/script-tmp-variacion_area_foliar_pinus.pdf (17 septiembre de 2020). [ Links ]
Weiss, M., F. Baret , G. J. Smith, I. Jonckheere and P. Coppin. 2004. Review of methods for in situ leaf area index (LAI) determination Part II. Estimation of LAI, errors and sampling. Agricultural and Forest Meteorology 121: 37-53. Doi: 10.1016/j.agrformet.2003.08.001. [ Links ]
Whitford, K. R., I. J. Colquhoun, A. R. G. Lang and B. M. Harper. 1995. Measuring leaf area index in a sparse eucalypt forest: a comparison of estimates from direct measurement, hemispherical photography, sunlight transmittance and allometric regression. Agricultural and Forest Meteorology 74: 237-249. Doi: 10.1016/0168-1923(94)02189-Q. [ Links ]
Wright, J. A. 1997. A review of the worldwide activities in tree improvement for Eucalyptus grandis, Eucalyptus urophylla and hybrid urograndis. In: White, T., Huber, D., & Powell, G. (comps.). Proceedings of the 24th Biennial Southern Forest Tree Improvement Conference. Orlando, FL, USA. pp. 96-102. [ Links ]
Received: June 26, 2020; Accepted: November 04, 2020
 Este es un artículo publicado en acceso abierto bajo una licencia
Creative Commons
Este es un artículo publicado en acceso abierto bajo una licencia
Creative Commons
