


Servicios Personalizados
Revista
Articulo
 texto en
  Inglés (pdf)
 Artículo en XML
 Referencias del artículo
 Enviar artículo por email
Indicadores
-
 Citado por SciELO
 -
 Accesos
Links relacionados
-
 Similares en
SciELO
Similares en
SciELO
Compartir

 Permalink
Revista mexicana de ciencias forestales
versión impresa ISSN 2007-1132
Rev. mex. de cienc. forestales vol.11 no.61 México sep./oct. 2020 Epub 20-Ene-2021
https://doi.org/10.29298/rmcf.v11i61.703
Scientific article
Diversity, structure and floristic composition of temperate forests of southern Nuevo León state
1Universidad Autónoma de Nuevo León, Facultad de Ciencias Forestales. México.
This paper describes and compares the diversity, structure and composition of the vegetation in four sites of temperate forests at the south of the state of Nuevo León, by means of ecological indicators and mensuration variables. Four sites of 2 500 m2 were measured, where height (h), diameter (d1.30 ≥7.5 cm) and crown cover (d copa ) were recorded. Beta diversity was evaluated by using a Bray-Curtis similarity model. The diversity (Shannon-Weaver [H'] and Simpson [D]) and richness (Margalef [D Mg ] and Menhinick [D Mn ]) indexes were estimated, as well as the horizontal structure (Importance Value Index [IVI]) and the vertical structure (Pretzsch Index A). The Weibull function was used to create a histogram of diameter distributions. Ten species, distributed in four families were identified, from which Fagaceae family had the greatest richness. S4 compiles greater diversity with seven species. In S1, Pinus teocote recorded the highest value of importance, IVI=50.64; followed by Quercus mexicana in S2 IVI=48.61 and S3 IVI=35.78. In relation to the indexes, S4 presented the highest values in H'=1.686, D=0.796, D Mg =1.207, unlike D Mn =0.586 which was presented in S3. S4 registered an A=1.69, with an A max =3.04. The similarity relations indicated that S2 and S3 presented the highest similarity of 48.03 %. The results obtained in this work would serve to have a reference of the changes experienced by the forests in these sampled areas and through time to apply the most convenient forest management.
Key words: Biodiversity; diameter distribution; floristic structure; Pretzsch A index; species richness; permanent sites
El presente trabajo describe y compara la diversidad, estructura y composición de la vegetación en cuatro sitios de bosques templados del sur del estado de Nuevo León, mediante indicadores ecológicos y variables dasométricas. Se midieron cuatro sitios de 2 500 m2, en los que se registró la altura (h), diámetro (d 1.30 ≥7.5 cm) y cobertura de copa (d copa ). Se evaluó la diversidad beta mediante un modelo de similitud de Bray-Curtis. Se estimaron los índices de diversidad [Shannon-Weaver (H') y Simpson (D)] y riqueza [Margalef (D Mg ) y Menhinick (D Mn )], así como la estructura horizontal [Índice de Valor de Importancia (IVI)] y la estructura vertical (índice A de Pretzsch). Se empleó la función Weibull para crear un histograma de distribuciones diamétricas. Se identificaron 10 especies, distribuidas en cuatro familias, de las cuales Fagaceae representó la mayor riqueza. El S4 es el más diverso con siete taxones. En el S1 Pinus teocote registró el valor de importancia más alto, IVI=50.64; seguido de Quercus mexicana en el S2, IVI=48.61; y S3 IVI=35.78. En relación a los índices, el S4 registró valores superiores en H´=1.686, D=0.796, D Mg =1.207, a diferencia de D Mn =0.586 en el S3. En S4 se calculó un A=1.69, con una A max =3.04. Las relaciones de similitud indicaron que los S2 y S3 revisten la similitud más alta (48.03 %). Los resultados obtenidos en este trabajo sirven como una referencia de los cambios que experimentan los bosques en estas áreas de interés, y para a través del tiempo aplicar el manejo forestal más conveniente.
Palabras clave: Biodiversidad; distribución diamétrica; estructura florística; índice A de Pretzsch; riqueza de especies; sitios permanentes
Introduction
Mexico has a privileged diversity of natural ecosystems, made up of xerophilous scrubs (41 %), temperate forests (24 %) and tropical rain forests (23 %) (Conafor, 2009). Temperate zones occupy around 46 million ha, equivalent to 23.4 % of the national territory. They are mainly distributed in four physiographic regions: Sierra Madre Occidental, Sierra Volcánica Transversal, Sierra Madre Oriental and Sierra Madre del Sur (González, 2003). These mountain systems are sites with high diversity of plants distributed among trees and the understory, mainly; in general, temperate forests gather more than half of the pine and oak species, and 33 % of the world's oaks (Rzedowski, 2006; Rodríguez and Myers, 2010; González-Elizondo et al., 2012).
Determining the floristic structure, vertical and horizontal, as well as the density of individuals within a wooded area, allows knowing the nature of the mass, based on its biological diversity, floristic composition, as well as the abundance of spatial distribution, and in the strata altitudinal of the species that form plant communities (Aguirre, 2002). Diversity is a synonym for the richness or variety of species that occur in an ecosystem (Gaines, 1999; Gadow et al., 2007). The tree structure is a key element to assess the stability of forests, which can be modified by applying forestry treatments, which change the structure of stands or forest stands and consequently the forest (Lähde et al., 1999; del Río et al., 2003; Castellanos-Bolaños et al., 2010). Therefore, the quantification of the structural variables of the forests is important to understand the functioning of the ecosystem and thereby contribute to sustainable forest management (Castellanos-Bolaños et al., 2010).
Knowing the horizontal and vertical structure is essential for planning actions that favor the development of forests, which are carried out when selecting the trees that will be used without affecting the original structure (Aguirre-Calderón, 2015). Primarily, the horizontal structure is given by the mensuration distribution (basimetric area and volume by diameter category), as well as abundance, frequency and dominance. The vertical structure uses different height zones to detect changes in tree diversity in different layers of the forest, with the aim of providing basic information on stand dynamics (Pretzsch, 2009).
The floristic composition describes the number of families, genera and species in a forest at the time of making an inventory. The elements considered to achieve this focus on diversity, species richness, and similarity among others (Louman et al., 2001). Vegetation studies are one of the main supports for the planning, management and conservation of any ecosystem. For this reason, a planned floristic inventory must provide information on the specific richness (alpha diversity) (Villarreal et al., 2006), in which only the number of species is considered, not the abundance of each one.
The use of diversity indices that weight species richness and abundance provide scientific validity to establish conservation criteria, since these are frequently used as environmental indicators of ecosystem health (Magurran, 1989). These indices have been applied to guide actions related to the biodiversity of habitats, since they express in numerical values the information from censuses or samples, which contribute to inform decision-making in forest management (Lübbers, 1997).
This is why responsible forest management demands sustainability vision, which is ruled by principles and criteria that assess the preservation of diversity and the conservation of floristic composition. For all forests that are exploited and essentially for those that have good management certification, the characteristics and behavior of the tree layer must be known (Hernández, 2012). Therefore, the objective of the present study was to describe and compare the diversity, structure and composition of the vegetation in temperate forests of the south of the state of Nuevo León, Mexico.
Materials and Methods
Study area and sampling sites
Field work was carried up during the Winter of 2019 in four locations of the mixed pine-oak forest located in the Sierra Madre Oriental mountain system, with a 5 km in-between distance; three are found in Galeana municipality and the fourth one in Aramberri municipality of the state of Nuevo León, between 23°43'51''-25°26'45'' N and 99°28'30''-100°55'48'' W (Figure 1).

The climate in the region is temperate sub-humid with rains in summer; its pluvial regime oscillates between 600 and 1 200 mm, with annual average temperature between 14 and 18 ˚C.
Litosol soil type predominates and the types of vegetation present are coniferous forests made up of pine-oak and oak-pine associations (Inegi, 2017).
Four sampling plots were established in 2 500 m2 (50 × 50 m), in the following spots: Canoas (S1), Agua Blanca (S2), Cañada “El Llorón” (S3) and “El Alamillal” (S4); in each of them, the geographical coordinates and their physiographic characteristics were recorded (Table 1) and all individuals of tree species greater than 7.5 cm in normal diameter (diameter at a height of 1.3 m above ground level) were censored, according to the methodology used in the forest and soil research sites developed by Corral-Rivas et al. (2009). The species and tree number of each individual were identified and measurements of total height (h), normal diameter (d 1.30 ) and crown diameter(d copa ) were taken.
Table 1 Physiographic description of the sampling sites.
| Sites | Spot | Latitude (N) | Longitude (W) | Altitude (masl) | Hill side | Type of Vegetation |
|---|---|---|---|---|---|---|
| 1 | Canoas | 24°27'14.62'' | 99°52'44.97'' | 2 665 | SW | Pine-oak |
| 2 | Agua blanca | 24°29'44.81'' | 99°54'26.17'' | 2 442 | SW | Oak-pine |
| 3 | Cañada El Llorón | 24°35'47.76'' | 99°57'55.87'' | 2 133 | NE | Oak-pine |
| 4 | El Alamillal | 24°31'12.69'' | 99°57'25.94'' | 2 806 | NE | Pine-oak |
Floristic Composition
During the collection of information in the field, botanical material was collected from all the tree species present at the sampling sites, where a terminal portion of a branch of each species was taken, made up of leaves and the reproductive structure. For later taxonomic identification, such specimens were taken to the Graduate School of Forest Sciences of the Universidad Autónoma de Nuevo León. The validity of the scientific names for each of the identified species was verified based on the The Plant List (2013) platform.
Similitude coefficient
To determine the similarity in the composition of the species between the four localities, an analysis was applied with the BioDiversity Professional version 2.0 program (McAleece et al., 1997), using an algorithm that allows analyzing the similarity of the samples, through the Percentage calculation with intervals from 0 to 100 %, the result of which is represented in a Bray-Curtis similarity-dissimilarity dendrogram (Bray and Curtis, 1957).
Diversity and richness indices
The following diversity and richness indices were estimated:
The Shannon-Weaver diversity index (H'), which expresses the heterogeneity of a community based on two factors: the number of species present and their relative abundance (Shannon, 1948; Castellanos-Bolaños et al., 2008).
Where:
S = Number of present species
ln = Natural logarithm
P i = Individuals found of the i species ratio; it is calculated through the (n i /N) ratio
n i = Number of individuals of the i species
N = Total number of individuals
The Simpson diversity index (D), which estimates whether a given community is made up of very abundant species, since it adds the abundances of each one to the square and, thus, gives importance to the species with high value (Lamprecht, 1962).
Where:
P i = Ratio of the i species in the community (n i /N)
n i = Number of individuals of the i species
N = Total number of individuals
The Margalef richness index (D Mg ), which determines the biodiversity of a community based on the numerical distribution of the individuals of the different species, based on the total number of individuals in the analyzed sample. It combines the number of species (S) and the number of individuals (N) (Magurran, 2004).
Where:
ln = Natural logarithm (e basis)
S = Total number of present species
N = Total number of individuals
The Menhinick wealth index (D Mn ), which is based on the relationship between the number of species and the total number of individuals observed, which increases with increasing sample size.
Where:
S = Number of species
N = Number of present species
Diametric categories
The Weibull function was used to create histograms of diameter distributions, which were evaluated using an X-square goodness-of-fit test, with the Minitab version 16 software (Minitab, 2014). This function is used in forest science for its ease of application in similar analyzes of some species of the Pinus genus (Bailey and Dell, 1973).
Horizontal structure
To evaluate the horizontal structure of each species, its abundance was determined, according to the number of trees, its dominance as a function of the canopy area, and its frequency based on the presence at the sampling sites. The results were used to calculate the Importance Value Index (IVI), which acquires percentage values on a scale of zero to 100 (Müeller-Dombois and Ellenberg, 1974; Mostacedo and Fredericksen, 2000).
The estimation of relative abundance was obtained with the following equation:
Where:
A i = Absolute abundance of the i species (N ha-1)
AR i = Relative abundance of the i species with respect to total abundance
N i = Number of individuals of the i species
S = Sampling area (ha)
Relative dominance was calculated through the following equation:
Where:
D i = Absolute dominance of the i species (N ha-1)
DR i = Relative dominance of the i species with respect to total dominance
Ab i = Crown area of the i species
S = Sampling area (ha)
The relative frequency was estimated with the following equation:
Where:
F i = Absolute frequency (percentage of presence in the sampling sites)
FR i = Relative frequency of the i species with respect to the sum of frequencies
f i = Number of sites in which the i species is present
NS = Total number pf sampling sites
The Importance Value Index (IVI) is defined through the following equation (Whittaker, 1972; Moreno, 2001):
Where:
IVI = Importance Value index
AR i = Relative abundance of the i species with respect to total abundance
DR i = Relative dominance of the i species with respect to total dominance
FR i = Relative frequency of the i species with respect to total frequency
Vertical Structure (A of Pretzsch)
The vertical structure of the species was interpreted by using the Pretzsch vertical distribution index A (Pretzsch, 1996; del Río et al., 2003), which is a modification of the Shannon index (Pretzsch, 2009), in which A has values between zero and an A max value; when an A = 0 value means that the stand is made up of a single species that occurs in a single stratum. A max is reached when all the species are present in the same proportion, both in the stand and in the different strata (Corral et al., 2005). Therefore, three strata were defined with intervals of maximum height of the area, in which the tallest tree represents 100 %, and corresponds to stratum I: 80-100 %, to stratum II: 50-80 % and to stratum III: 0-50 % (Aguirre, 2002; Jiménez et al., 2008; Pretzsch, 2009). The A index is calculated using the following equation:
Where:
A = Vertical distribution index
S = Number of present species
Z = Number of strata with respect to height
P ij = Species percentage in each zone, which is estimated by (n i;j /N), n i
j = Number of individuals of the i species in the j stratum
N = Number of individuals
In order to compare the Pretzsch index it was necessary to standardize it and this was done by means of the A max value, which is calculated with the following equation:
To standardize the A value, the following model was used:
Results and Discussion
Floristic composition
A total of 10 tree species was identified, which belong to four families and five genera. Fagaceae gathered the greatest richness with five species, followed by Pinaceae with three. These families represent 92.32 % of the total registered in the four study sites (Table 2). The rest were Ericaceae and Cupressaceae with one genus. The species that stood out were of the Quercus (five), Pinus (two) genera; only one taxon was identified of Abies, Arbutus and Juniperus. In relation to the number of individuals for the four study sites, Fagaceae dominated, with 228 and Pinaceae, with 205; while the least abundant were Ericaceae, with 32 and Cupressaceae, with 4.
Table 2 Recorded species at the sampling sites, arranged by family.
| Family | Scientific name | Common name | |
|---|---|---|---|
| Pinaceae | Abies vejarii Martínez | Oyamel | |
| Pinaceae | Pinus pseudostrobus Lindl. | Pino blanco | |
| Pinaceae | Pinus teocote Schiede ex Schltdl.et Cham. | Ocote | |
| Fagaceae | Quercus canbyi Trel. | Encino amarillo | |
| Fagaceae | Quercus laeta Liebm. | Encino colorado | |
| Fagaceae | Quercus mexicana Humb. et Bonpl. | Encino de México | |
| Fagaceae | Quercus polymorpha Schltdl. et Cham. | Encino roble | |
| Fagaceae | Quercus rugosa Née | Encino blanco | |
| Ericaceae | Arbutus xalapensis Kunth | Madroño | |
| Cupressaceae | Juniperus flaccida Schltdl. | Enebro |
In the Sierra Madre Oriental, worth mentioning are the floristic studies carried out by García-Arévalo (2008), Valenzuela and Granados (2009), Aragon-Piña et al. (2010), De León et al. (2013), Delgado et al. (2016) and Graciano-Ávila et al. (2017), which agree that Pinaceae and Fagaceae were the most abundant families; Valencia (2004), Sánchez-González (2008), González-Elizondo et al. (2012) and Gernandt and Pérez-de la Rosa (2014) argued that the abundance of these two families is explained by their wide diversity of species in Mexico, since 49 are recorded for Pinus and 161 for Quercus. Likewise, Zúñiga et al. (2018) documented a high value of importance for the Pinus and Quercus genera, to which must be added the great economic interest of both families in the forest ecosystems in a national scope (Semarnat, 2014).
Similitude coefficient
The dendrogram derived from the Bray-Curtis similarity-dissimilarity matrix (Figure 2), groups the study sites into two well-defined sets. The first is made up of S2 and S3, which were the most similar in the composition of species, with 48.03 % similarity and correspond to a mixed oak-pine forest plant community. The second group is made up of S1 and S4, with 43.72 % similarity, and a pine-oak plant community. The clusters are influenced by the number of individuals of the taxa with the highest floristic composition, because their abundance was very similar, despite the fact that their richness was very different between the sampling sites.

Diversity and richness indexes
The highest values of the of the Shannon-Weaver and Simpson diversity indexes as well as the Margalef richness index were recorded in S4, because it has the highest number of species; however, the highest value of the Menhinick richness index was determined in S3. The lowest diversity values of Shannon-Weaver and Simpson were recorded in S1, but the richness indices of Margalef and Menhinick in S2, represented by four species (Figure 3).
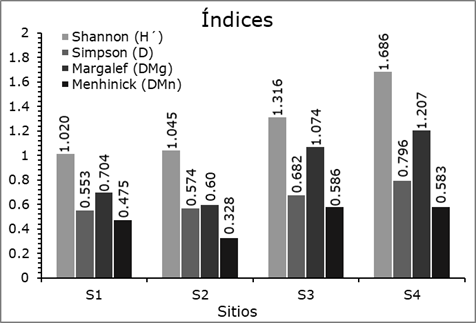
When comparing the results of this study with the values of species diversity and richness in other regions of the country, it is observed that the value of the Shannon-Weaver index falls within the ranges recorded by Solís et al. (2006) of H´ = 0.72 and 1.21 and Návar-Cháidez and González-Elizondo (2009) of H´ = 0.53 to 1.33 in temperate forests of Durango; by Hernández-Salas et al. (2013) of H´ = 1.23 in a temperate pine-oak forest in Chihuahua; by López-Hernández et al. (2017) of H´ = 1.37 in temperate forests of Puebla; by Domínguez et al. (2018) of H´ = 0.93 to 1.51 in four sites of the SMO; and by Buendía-Rodríguez et al. (2019) from H´ = 0.83 to 1.78 in 10 sites in northeastern Mexico.
According to the Margalef index, some authors such as Hernández-Salas et al. (2013) refer values of D Mg = 0.90 to 1.04 in temperate forests of northeast Mexico; López-Hernández et al. (2017) of D Mg = 1.35 in temperate forests of Puebla. In a similar way, for the Menhinick index, Návar-Cháidez and González-Elizondo (2009) and Ríos-Saucedo et al. (2019) recorded higher values of D Mn = 0.82 and 0.95 in temperate forests of Durango and Simpson richness index values of D = 0.73. Based on the results of the diversity and species richness indexes at the study sites, they are classified as low to medium diversity.
Diametric categories
Diametric distributions indicate irregular masses, as they reflect both inverted J trends and normal distribution curves. In this case, forests with dominant young trees with diameters from 10 to 30 cm, values similar to those reported by Návar-Cháidez (2010) and Delgado et al. (2016) for temperate forests of Nuevo León and Durango. Individuals with diameters greater than 40 cm were observed, which as the diameter increases, the structure of the sites decreases in density, reflecting an adequate flow of regeneration with a reserve of young individuals, which in the future could replace the larger diameters, so that the survival of the ecosystem is guaranteed. Therefore, thinning could be carried out, since there are trees that have reached their maximum development (Figure 4).

Horizontal structure
A total of 469 trees were recorded. S4 corresponds to the largest number of families with four, followed by S3 with three, S1 and S2 with two. Six species were identified in S3 and seven in S4, which are the highest figures, perhaps due to its northeast exposure, since it favors favorable temperature and humidity conditions, since forests with this exposure show less water deficit due to the low temperature and evapotranspiration during the day (López-Gómez et al., 2012). S1 and S2 follow a lower trend, with four families, with a southwest exposure. At all sites, there was at least one taxon of the genus Pinus and Quercus. The rarest species, one for each site, were Abies vejarii Martínez, Juniperus flaccida Schltdl., Quercus canbyi Trel. and Quercus laeta Liebm.
Q. mexicana Humb. et Bonpl was the best represented in S2 with 89 trees (59.73 % of the total), followed by S1 with 44 trees of P. teocote Schiede ex Schltdl. et Cham (61.97 % of the total), P. pseudostrobus Lindl. with 37 trees (35.24 % of the total) in S3, Q. canbyi with 35 trees (24.3 % of the total) in S4. To a lesser extent, Q. mexicana and Q. rugosa Née with 3 trees (4.23 and 2.08 % of the total) in S1 and S4. S2 was the site with the highest number of individuals (149), followed by S4 (144), S3 (105), and S1 (71). The highest coverage corresponded to S2, S4 and S3 with values of 2 853 m2 ha-1, 2 806 m2 ha-1 and 2 779.4 m2 ha-1 respectively; while the site with the least coverage corresponds to S1 with 2 215.02 m2 ha-1. The species with the highest coverage were Q mexicana, with 3 189.44 m2 ha-1 and P. teocote with 3 038.56 m2 ha-1 and with the lowest coverage J. flaccida 77.14 m2 ha-1.
The most abundant species were Q. mexicana, P. teocote and P. pseudostrobus, and to a lesser extent J. flaccida. The dominant species were Q. mexicana, P. pseudostrobus and P. teocote, and with less dominance J. flaccida. The most frequent species was P. teocote (Table 3).
Table 3 Structural parameters of the species per sampling site.
| Site | Species | No. Ind |
Density | Frequency | Crown area | Basimetric area | IVI | ||||
|---|---|---|---|---|---|---|---|---|---|---|---|
| (N ha-1) | Dr (%) | F | Fr (%) | (m2ha-1) | ACr (%) | (m2 ha-1) | ABr (%) | (%) | |||
| 1 | P. pseudostrobus | 9 | 36 | 12.68 | 0.8 | 26.67 | 369.2 | 16.67 | 10.97 | 20.47 | 18.67 |
| P. teocote | 44 | 176 | 61.97 | 0.8 | 26.67 | 1 401.56 | 63.28 | 37.91 | 70.75 | 50.64 | |
| Q. mexicana | 3 | 12 | 4.23 | 0.6 | 20 | 82.4 | 3.72 | 1.30 | 2.42 | 9.32 | |
| Q. rugosa | 15 | 60 | 21.13 | 0.8 | 26.67 | 361.86 | 16.34 | 3.41 | 6.36 | 21.38 | |
| Total | 71 | 284 | 100 | 3 | 100 | 2 215.02 | 100 | 53.59 | 100 | 100 | |
| 2 | A. vejarii | 28 | 112 | 18.79 | 0.2 | 9.09 | 525.02 | 18.40 | 4.43 | 12.63 | 15.43 |
| P. teocote | 27 | 108 | 18.12 | 0.8 | 36.36 | 559.60 | 19.61 | 11.38 | 32.49 | 24.70 | |
| Q. mexicana | 89 | 356 | 59.73 | 0.6 | 27.27 | 1 678.62 | 58.83 | 18.59 | 53.05 | 48.61 | |
| Q. polymorpha | 5 | 20 | 3.36 | 0.6 | 27.27 | 89.96 | 3.15 | 0.64 | 1.83 | 11.26 | |
| Total | 149 | 596 | 100 | 2.2 | 100 | 2 853 | 100 | 35.04 | 100 | 100 | |
| 3 | Q. mexicana | 43 | 172 | 40.95 | 0.6 | 15 | 1 428.42 | 51.39 | 21.53 | 64.74 | 35.78 |
| Q. polymorpha | 2 | 8 | 1.90 | 0.6 | 15 | 76.20 | 2.74 | 0.66 | 1.99 | 6.55 | |
| P. pseudostrobus | 37 | 148 | 35.24 | 0.8 | 20 | 771.60 | 27.76 | 6.77 | 20.34 | 27.67 | |
| Q. rugosa | 5 | 20 | 4.76 | 0.8 | 20 | 166.66 | 6 | 1.78 | 5.36 | 10.25 | |
| P. teocote | 16 | 64 | 15.24 | 0.8 | 20 | 303.6 | 10.92 | 2.48 | 7.44 | 15.39 | |
| A. xalapensis | 2 | 8 | 1.90 | 0.4 | 10 | 32.92 | 1.18 | 0.04 | 0.13 | 4.36 | |
| Total | 105 | 420 | 100 | 4 | 100 | 2 779.4 | 100 | 33.26 | 100 | 100 | |
| 4 | A. xalapensis | 30 | 120 | 20.8 | 0.4 | 11.76 | 515.20 | 18.36 | 1.81 | 9.2 | 16.99 |
| J. flaccida | 4 | 16 | 2.78 | 0.2 | 5.88 | 77.14 | 2.75 | 0.23 | 1.2 | 3.80 | |
| P. pseudostrobus | 9 | 36 | 6.25 | 0.8 | 23.53 | 189.66 | 6.76 | 1.48 | 7.6 | 12.18 | |
| P. teocote | 35 | 140 | 24.3 | 0.8 | 23.53 | 773.80 | 27.58 | 8.18 | 42 | 25.14 | |
| Q. canbyi | 35 | 140 | 24.3 | 0.2 | 5.88 | 590.24 | 21.03 | 2.51 | 13 | 17.07 | |
| Q. laeta | 28 | 112 | 19.4 | 0.2 | 5.88 | 589 | 20.99 | 4.87 | 25 | 15.44 | |
| Q. rugosa | 3 | 12 | 2.08 | 0.8 | 23.53 | 71.10 | 2.53 | 0.47 | 2.4 | 9.38 | |
| Total | 144 | 576 | 100 | 0.4 | 100 | 2 806 | 100 | 19.55 | 100 | 100 | |
No. Ind = Number of individuals; Dr = Relative densidad; Fr = Relative frecuency; ACr = Relative crown area; ABr = Basimetric area; IVI = Importance Value Index (Dr+Fr+ABr) /3.
A higher importance value (IVI) was calculated for Quercus in S2, S3 and S4, and for Pinus in S1. The most significant taxa of the sampled sites were P. teocote, P. pseudostrobus, Q. rugosa and Q. mexicana, an expected behavior of the vegetation because they are mixed forests. Guzmán (2009) pointed out that when a species reaches the value of outstanding importance, it plays a clear ecological dominance, and it is common for a few species, with higher values of importance, to represent the most significant populations of ecosystems.
Conversely, when competition on the site is divided into several species, none of them exceeds 50 % of the importance value. In general, the sampled sites are located in areas under forest management, which have not been intervened so far, and which include species of economic interest, therefore, if the corresponding forestry treatments are applied, this would favor their density, frequency, coverage and basimetric area. However, the generic dominance makes it possible to observe pine-oak or oak-pine forests in a site, which is consistent with what is documented in the Ecological Ordering of the state of Durango for the temperate forests of the area (Semarnat, 2007).
The basimetric area reached the highest value in S1 with 53.59 m2 ha-1, which can be explained by the higher diameters of P. teocote, and to a lesser extent, in S4 with 19.55 m2 ha-1, made up of the same way mostly by P. teocote (Table 3).
The comparative study between sites allowed to detect structural and compositional variations that occur within the same ecosystem. Although in general terms, the same coniferous or broadleaved species can develop in different degrees of slope or orientation, others have preferences for particular topoforms (hills, canyon, valley, slopes, etc.) (Martínez-Antúnez et al., 2013).
Vertical structure (A of Pretzsch)
The vertical structure of the sampled sites is distributed in three strata, of which the upper one (I:> 80 % of the maximum height) was dominated by P. teocote, which is present in S1, S2 and S4 with the heights The most outstanding were from 26 to 30 m, and for S3 it was P. pseudostrobus with 22.93 m. The lowest heights in S1 correspond to A. vejarii; in S2 and S3, to Q. mexicana and Q. rugosa in S3. Diameters at this level range from 41.13 to 94.67 m. In the stratum (II:> 50 % - 80 %) P. teocote dominates in the four sampling sites with heights of 17.90 to 24 m. However, other species begin to appear as P. pseudostrobus in S1, S3 and S4, A. vejarii in S2 and some Quercus species: Q. cambyi and Q. laeta in S4, Q. mexicana in S1, S2 and S3, Q. polymorpha Schltdl. et Cham in S2 and S3, and Q. rugosa in S1 and S3 which is a shade tolerant genus. Diameters at this level range from 31.07 to 66 m. The stratum (III: up to 50 %) of S4 showed the greatest diversity of species, with the most noticing P. teocote height values, but Q. rugosa and Q. mexicana recorded the largest diameters in S1 and S3 (Table 4).
Table 4 Pretzsch’s index vertical distribution values.
| Site | Stratum | Species | No. Ind. | D 1.30 (cm) | H (m) | Pretzsch | ||||||||
|---|---|---|---|---|---|---|---|---|---|---|---|---|---|---|
| Max | Min |
|
SD | Max | Min |
|
SD | A | A max | Arel% | ||||
| 1 | I | P. pseudostrobus | 7 | 74.87 | 55.30 | 65.37 | 7.83 | 29.30 | 25.91 | 27.88 | 1.42 | 1.02 | 2.48 | 41.07 |
| P. teocote | 24 | 84.60 | 42.43 | 57.68 | 11.43 | 30.00 | 24.60 | 26.74 | 1.85 | |||||
| II | P. pseudostrobus | 2 | 55.43 | 39.53 | 47.48 | 11.24 | 23.60 | 23.00 | 23.30 | 0.42 | ||||
| P. teocote | 18 | 59.47 | 31.17 | 44.84 | 7.74 | 24.00 | 16.00 | 22.07 | 1.84 | |||||
| Q. mexicana | 1 | 45.17 | 45.17 | 45.17 | - | 18.00 | 18.00 | 18.00 | - | |||||
| Q. rugosa | 2 | 59.67 | 32.80 | 46.23 | 19.00 | 19.00 | 17.80 | 18.40 | 0.85 | |||||
| III | P. teocote | 2 | 18.37 | 16.03 | 17.20 | 1.65 | 13.80 | 10.10 | 11.95 | 2.62 | ||||
| Q. mexicana | 2 | 40.53 | 21.10 | 30.82 | 13.74 | 11.00 | 9.00 | 10.00 | 1.41 | |||||
| Q. rugosa | 13 | 41.73 | 7.67 | 19.41 | 10.43 | 15.00 | 5.00 | 8.73 | 3.30 | |||||
| Total | 71 | 84.60 | 7.67 | 45.50 | 18.49 | 30 | 5 | 20.95 | 7.36 | |||||
| 2 | I | A. vejarii | 3 | 41.13 | 37.20 | 38.57 | 2.22 | 23.90 | 22.69 | 23.11 | 0.68 | 1.05 | 2.48 | 42.07 |
| P. teocote | 14 | 56.93 | 34.23 | 44.01 | 5.97 | 26.92 | 21.67 | 23.83 | 1.57 | |||||
| Q. mexicana | 11 | 44.57 | 33.93 | 38.07 | 3.42 | 25.74 | 21.59 | 22.78 | 1.27 | |||||
| II | A. vejarii | 20 | 31.07 | 14.00 | 20.96 | 4.08 | 19.91 | 15.10 | 17.04 | 1.37 | ||||
| P. teocote | 13 | 35.07 | 17.57 | 25.29 | 5.31 | 21.19 | 16.10 | 18.53 | 1.58 | |||||
| Q. mexicana | 58 | 42.33 | 14.00 | 24.94 | 5.78 | 21.14 | 13.60 | 16.74 | 2.21 | |||||
| Q. polymorpha | 2 | 32.77 | 17.80 | 25.28 | 10.58 | 17.54 | 13.92 | 15.73 | 2.56 | |||||
| III | A. vejarii | 5 | 14.70 | 7.67 | 9.83 | 2.79 | 12.00 | 6.59 | 8.84 | 2.00 | ||||
| Q. mexicana | 20 | 20.07 | 11.83 | 15.81 | 2.56 | 13.24 | 7.16 | 10.84 | 1.92 | |||||
| Q. polymorpha | 3 | 17.60 | 12.10 | 14.54 | 2.80 | 12.10 | 10.39 | 10.99 | 0.96 | |||||
| Total | 149 | 56.93 | 7.67 | 25.53 | 9.85 | 26.92 | 6.59 | 17 | 4.38 | |||||
| 3 | I | P. pseudostrobus | 5 | 61.27 | 45.67 | 53.85 | 7.43 | 22.93 | 21.50 | 21.99 | 0.57 | 1.32 | 2.89 | 45.52 |
| Q. mexicana | 2 | 94.67 | 76.83 | 85.75 | 12.61 | 21.56 | 18.64 | 20.10 | 2.06 | |||||
| Q. rugosa | 1 | 43.33 | 43.33 | 43.33 | - | 18.80 | 18.80 | 18.80 | - | |||||
| II | P. pseudostrobus | 7 | 33.87 | 15.70 | 20.69 | 6.57 | 14.60 | 11.72 | 13.38 | 0.95 | ||||
| P. teocote | 5 | 42.43 | 17.20 | 32.71 | 13.19 | 17.90 | 12.60 | 15.56 | 2.44 | |||||
| Q. mexicana | 30 | 66.00 | 18.73 | 38.49 | 13.74 | 17.82 | 11.62 | 14.97 | 2.05 | |||||
| Q. polymorpha | 2 | 38.80 | 24.50 | 31.65 | 10.11 | 15.30 | 14.43 | 14.87 | 0.62 | |||||
| Q. rugosa | 4 | 39.47 | 17.83 | 29.25 | 11.13 | 15.80 | 11.50 | 13.68 | 1.76 | |||||
| III | A. xalapensis | 2 | 8.73 | 7.93 | 8.33 | 0.57 | 6.69 | 4.00 | 5.35 | 1.90 | ||||
| P. pseudostrobus | 25 | 17.87 | 9.07 | 11.75 | 2.20 | 10.75 | 5.63 | 8.58 | 1.68 | |||||
| P. teocote | 11 | 17.97 | 7.97 | 12.66 | 2.72 | 10.60 | 5.00 | 9.06 | 1.73 | |||||
| Q. mexicana | 11 | 40.17 | 7.77 | 16.50 | 8.78 | 10.53 | 4.47 | 7.07 | 2.06 | |||||
| Total | 105 | 94.67 | 7.77 | 26.27 | 17.92 | 22.93 | 4 | 12.16 | 4.97 | |||||
| 4 | I | P. teocote | 7 | 56.10 | 27.67 | 38.90 | 9.22 | 26.60 | 21.50 | 23.57 | 1.90 | 1.69 | 3.04 | 55.39 |
| II | P. pseudostrobus | 2 | 44.40 | 33.07 | 38.73 | 8.01 | 18.73 | 15.89 | 17.31 | 2.01 | ||||
| P. teocote | 22 | 42.33 | 9.83 | 24.06 | 7.59 | 20.80 | 14.60 | 18.04 | 1.98 | |||||
| Q. cambyi | 6 | 31.30 | 15.33 | 22.96 | 5.59 | 14.80 | 13.60 | 14.08 | 0.40 | |||||
| Q. laeta | 9 | 55.80 | 19.28 | 33.26 | 12.15 | 17.62 | 14.50 | 16.45 | 1.13 | |||||
| III | A. xalapensis | 30 | 23.33 | 7.67 | 13.20 | 4.28 | 9.60 | 3.10 | 6.59 | 1.89 | ||||
| J. flaccida | 4 | 16.00 | 10.33 | 13.43 | 2.82 | 11.30 | 7.60 | 9.77 | 1.58 | |||||
| P. pseudostrobus | 7 | 23.33 | 11.57 | 14.80 | 4.21 | 12.60 | 10.40 | 11.61 | 0.70 | |||||
| P. teocote | 6 | 14.83 | 10.97 | 12.66 | 1.69 | 13.20 | 11.10 | 12.08 | 0.81 | |||||
| Q. cambyi | 29 | 23.37 | 7.73 | 12.23 | 3.47 | 12.80 | 7.00 | 10.06 | 1.40 | |||||
| Q. laeta | 19 | 23.43 | 9.03 | 14.49 | 4.48 | 12.00 | 4.12 | 8.39 | 2.25 | |||||
| Q. rugosa | 3 | 30.00 | 12.53 | 21.08 | 8.74 | 11.60 | 7.20 | 9.63 | 2.24 | |||||
| Total | 144 | 56.10 | 7.67 | 18.32 | 9.84 | 26.60 | 3.10 | 11.80 | 5.04 | |||||
Max= Maximum value; Min= Mínimum value; D
130
= Normal diameter; H = Height;
In regard to the values of the vertical index of A = 1.02 to 1.69 and an A max = 2.48 to 3.04 in the sampling sites, the highest was located in S4 with an A rel = 55.39 %, indicating that the evaluated site has uniformity mean in height diversity (Table 4). These results are comparable with the results of Buendía-Rodríguez et al. (2019) from A = 1.5 to 2.53, with A max = 2.48 to 3.5 at 10 temperate climate sites in northeast Mexico.
Conclusions
The former results reveal that the sites sampled in this study are heterogeneous and of low similarity. Pinus teocote, P. pseudostrobus and Q. mexicana have the highest value of ecological importance, the first one of which records the largest basimetric area in S1, Q. mexicana the highest number of trees in S2 and S3, and the greater diversity of species in S4. However, the values of the calculated indexes of diversity (Shannon, Simpson) and richness (Margalef, Menhinick) are relatively low compared to others determined in temperate forests in Mexico. Based on the diametric distribution, some of the largest trees within the study areas were identified, which would be of interest to forest managers to removal those that have reached maturity, without compromising the stability of the ecosystem. By stratifying the heights using the Pretzsch index, a detailed overview of the vertical structure of the species that make up the sampling sites is provided. The results obtained a well as the descriptive data in this work could serve as a reference of the changes that forests undergo in these areas and, over time, apply the corresponding forest management.
Acknowledgements
The first author wishes to express his gratitude to the Consejo Nacional de Ciencia y Tecnología (National Council of Science and Technology) (Conacyt) for their support by the postgraduate scholarship No. 469568, as well as to the Geomatics Laboratory of the Graduate School of Forest Sciences of the University of Nuevo León.
REFERENCES
Aguirre C., O. A. 2002. Índices para la caracterización de la estructura del estrato arbóreo de ecosistemas forestales. Ciencia Forestal en México 27(92): 5-27. [ Links ]
Aguirre-Calderón, O. A. 2015. Manejo Forestal en el Siglo XXI. Madera y Bosques 21: 17-28. https://doi.org/10.21829/myb.2015.210423. [ Links ]
Aragón-Piña, E. E., A. Garza-Herrera, M. S. González-Elizondo e I. Luna-Vega. 2010. Composición y estructura de las comunidades vegetales del rancho El Durangueño, en la Sierra Madre Occidental, Durango, México. Revista Mexicana de Biodiversidad 81(3): 771-787. [ Links ]
Bailey, R. L., and T. R. Dell. 1973. Quantifying diameter distributions with the Weibull function. Forest Science 19(2): 97-104. Doi: h10.1093/forestscience/19.2.97. [ Links ]
Bray, J. R. and J. T. Curtis. 1957. An ordination of the upland forest communities of southern Wisconsin. Ecological monographs 27(4): 325-349. Doi: 10.2307/1942268. [ Links ]
Buendía-Rodríguez, E., E. J. Treviño-Garza, E. Alanís-Rodríguez, O. A. Aguirre-Calderón, M. A. González-Tagle y M. Pompa-García. 2019. Estructura de un ecosistema forestal y su relación con el contenido de carbono en el noreste de México. Revista Mexicana de Ciencias Forestales Vol. 10(54): 4-25. Doi: 10.29298/rmcf.v10i54.149. [ Links ]
Castellanos-Bolaños, J. F., E. J. Treviño-Garza , O. A. Aguirre-Calderón , J. Jiménez-Pérez, M. Musálem-Santiago y R. López-Aguillón. 2008. Estructura de bosques de Pinus patula bajo manejo en Ixtlán de Juárez, Oaxaca, México. Madera y Bosques 14 (2): 51-63. Doi:10.21829/myb.2008.1421212. [ Links ]
Castellanos-Bolaños, J. F. , E. J. Treviño-Garza , O. A. Aguirre-Calderón , J. Jiménez.Pérez y A. Velázquez-Martínez. 2010. Diversidad arbórea y estructura espacial de bosques de pino-encino en Ixtlán de Juárez, Oaxaca. Revista Mexicana de Ciencias Forestales 1(2): 39-52. Doi:10.29298/rmcf.v1i2.636. [ Links ]
Comisión Nacional Forestal (Conafor). 2009. Restauración de ecosistemas forestales. Guía básica para comunicadores. Zapopan, Jal., México. 69 p. [ Links ]
Corral, J., Ó. A. Aguirre, J. Jiménez y S. Corral. 2005. Un análisis del efecto del aprovechamiento forestal sobre la diversidad estructural en el bosque mesófilo de montaña “El Cielo”, Tamaulipas, México. Investigación Agraria: Sistemas y Recursos Forestales 14(2): 217-228. [ Links ]
Corral-Rivas, J. J., B. Vargas L., C. Wehenkel, O. A. Aguirre C., J. G. Álvarez G. y A. Rojo A. 2009. Guía para el establecimiento de sitios de investigación forestal y de suelos en bosques del estado de Durango. Editorial UJED. Durango, Dgo., México. 81 p. [ Links ]
De León M., G. D., A. García A., S. Andrade H. y A. Ruíz M. 2013. Distribución de la vegetación a través de un transecto sobre la Sierra Madre Occidental de Durango, México. Revista Latinoamericana de Recursos Naturales 9(1): 30-40. [ Links ]
del Río, M., F. Montes, I. Cañellas y G. Montero. 2003. Revisión: índices de diversidad estructural en masa forestales. Investigación Agraria. Sistemas y Recursos Forestales 12(1): 159-176. [ Links ]
Delgado Z., D. A., S. A. Heynes S., M. D. Mares Q., N. L. Piedra L., F. I. Retana R., K. Rodriguez C., A. I. Villanueva H., M. S. González E. y L. Ruacho-González. 2016. Diversidad y estructura arbórea de dos rodales en Pueblo Nuevo, Durango. Revista Mexicana de Ciencias Forestales 7(33): 94-107. Doi: 10.29298/rmcf.v7i33.92. [ Links ]
Domínguez G., T. G., B. N. Hernández G., H. González R., I. Cantú S., E. Alanís R. y M. D. Alvarado S. 2018. Estructura y composición de la vegetación en cuatro sitios de la Sierra Madre Occidental. Revista Mexicana de Ciencias Forestales 9(50): 9-34. Doi: 10.29298/rmcf.v9i50.227. [ Links ]
Gadow, K. V., S. Sánchez O. y J. G. Álvarez G. 2007. Estructura y crecimiento del bosque. Universidad de Göttingen. Gottingen, Alemania. 279 p. [ Links ]
Gaines, W. L. 1999. Monitoring biodiversity: quantification and interpretation (Vol. 443). US Department of Agriculture, Forest Service, Pacific Northwest Research Station. Portland, OR USA. 27 p. [ Links ]
García-Arévalo, A. 2008. Vegetación y flora de un bosque relictual de Picea chihuahuana Martínez del norte de México. Polibotánica (25): 45-68. [ Links ]
Gernandt, D. S., y J. A. Pérez-de la Rosa. 2014. Biodiversidad de Pinophyta (coníferas) en México. Revista Mexicana de Biodiversidad (85): 126-133. Doi: 10.7550/rmb.32195. [ Links ]
González-Elizondo, M. S., M. González-Elizondo, J. A. Tena-Flores, L. Ruacho-González e I. L. López-Enríquez 2012. Vegetación de la Sierra Madre Occidental, México: una síntesis. Acta Botánica Mexicana (100): 351-403. Doi: 10.21829/abm100.2012.40. [ Links ]
González M., F. 2003. Las comunidades vegetales de México: propuesta para la unificación de la clasificación y nomenclatura de la vegetación de México. Instituto Nacional de Ecología-Secretaría de Medio Ambiente y Recursos Naturales. México, D. F., México. 82 p. [ Links ]
Graciano-Ávila, G., E. Alanís-Rodríguez , Ó. A. Aguirre -Calderón, M. A. González-Tagle , E. J. Treviño-Garza y A. Mora-Olivo. 2017. Caracterización estructural del arbolado en un ejido forestal del noroeste de México. Madera y Bosques 23(3): 137-146. Doi: 10.21829/myb.2017.2331480. [ Links ]
Guzmán L., M. A. 2009. Distribución, sistemática, y algunos aspectos ecológicos del mezquite Prosopis spp. (L.) en el estado de Nuevo León, México. Tesis de Doctorado. Facultad de Ciencias Biológicas, Universidad Autónoma de Nuevo León. San Nicolás de los Garza, N. L., México. 197 p. [ Links ]
Hernández S., J. 2012. Efecto del manejo forestal en la diversidad, composición y estructura de un bosque de Pinus arizonica ENGEL, en el Ejido el Largo, Chihuahua. Tesis de Doctorado. Universidad Autónoma de Nuevo León. Linares, N. L., México. 127 p. [ Links ]
Hernández-Salas, J., Ó. A. Aguirre -Calderón, E. Alanís-Rodríguez , J. Jiménez- Pérez , E. J., Treviño-Garza, M. A. González-Tagle , C. Luján-Álvarez, J. M. Olivas-García y L. A. Domínguez-Pereda. 2013. Efecto del manejo forestal en la diversidad y composición arbórea de un bosque templado del noroeste de México. Revista Chapingo. Serie Ciencias Forestales y del Ambiente 19(2): 189-200. [ Links ]
Instituto Nacional de Geografía y Estadística (Inegi). 2017. Anuario Estadístico y geográfico de Nuevo León 2017. http://internet.contenidos.inegi.org.mx/contenidos/Productos/prod_serv/contenidos/espanol/bvinegi/productos/nueva_estruc/anuarios_2017/702825094911.pdf (4 de junio de 2020). [ Links ]
Jiménez, J., Ó. A. Aguirre y H. Kramer, 2008. Análisis de la estructura horizontal y vertical en un ecosistema multicohortal de pino-encino en el norte de México. Investigación Agraria: Sistemas y Recursos Forestales 10(2): 355-366. [ Links ]
Lähde, E., O. Laiho, Y. Norokorpi and T. Saksa, 1999. Stand structure as the basis of diversity index. Forest Ecology Management 115(2-3): 213-220. Doi: 10.1016/S0378-1127(98)00400-9. [ Links ]
Lamprecht, H. 1962. Ensayo sobre unos métodos para el análisis estructural de los bosques tropicales. Acta Científica Venezolana 13(2): 1-57. [ Links ]
López-Gómez, V., P. Zedillo-Avelleyra, S. Y. Anaya-Hong, E. González-Lozada. y Z. Cano-Santana. 2012. Efecto de la orientación de la ladera sobre la estructura poblacional y ecomorfología de Neobuxbaumia tetetzo (Cactaceae). Botanical Sciences 90(4): 453-457. Doi: 10.17129/botsci.473. [ Links ]
López-Hernández, J. A., Ó. A. Aguirre- Calderón, E. Alanís-Rodríguez , J. C. Monarrez-González G., M. A. González-Tagle y J. Jiménez -Pérez . 2017. Composición y diversidad de especies forestales en bosques templados de Puebla, México. Madera y Bosques 23(1): 39-51. Doi: 10.21829/myb.2017.2311518. [ Links ]
Louman, B., D. Quiroz y M. Nilson. 2001. Silvicultura de bosques latifoliados húmedos con énfasis en América Central. Serie Técnica. Manual Técnico Núm. 46. CATIE. Turrialba, Costa Rica. 265 p. [ Links ]
Lübbers, P. 1997. Diversitätsindices und Stichprobenverfahren. In: Pelz, D. (Comp.). Deutscher Verband Forstlicher Forschungsanstalten, Sektion Biometrie und Informatik. Abt. Forstl. Biometrie, Albert-Ludwigs-Universität Freiburg, Freiburg, Deutschland. pp. 50-58. [ Links ]
Magurran, A. E. 1989. Diversidad ecológica y su medición. Ediciones Vedrá. Barcelona, España. 200 p. [ Links ]
Magurran, A. E. 2004. Measuring biological diversity. The commonness and rarity of species. Blackwell Science Ltd., Oxford, UK. 256 p. [ Links ]
Martínez-Atúnez, P., C. Wehenkel , J. C. Hernández-Díaz, M. González-Elizondo , J. J. Corral-Rivas and A. Pinedo-Álvarez. 2013. Effect of climate and physiography on the density of tree and shrub species in Northwest Mexico. Polish Journal of Ecology 61 (2): 295-307. [ Links ]
McAleece, N., P. J. Lambshead, G. L. Paterson and J. D. Cage 1997. Biodiversity Professional (V.2.0). Natural History Museum and Scottish Association for Marine Science. Oban, UK Oban, UK http://www.sams.ac.uk/research/software/software/?searchterm=Biodiversity%20Pro (13 de octubre de 2019). [ Links ]
Minitab, 2014. MINITAB 16. Inc: State College, PA. USA. http://www.minitab.com/es-mx/ (1 de junio de 2020). [ Links ]
Moreno, C. 2001. Métodos para medir la biodiversidad. M&T-Manuales y Tesis Sociedad Entomológica Aragonesa (SEA). Vol. I. Zaragoza, España. 84 p. [ Links ]
Mostacedo, B. y T. Fredericksen. 2000. Manual de métodos básicos de muestreo y análisis en ecología vegetal. BOLFOR. Santa Cruz, Bolivia. 87 p. [ Links ]
Müeller-Dombois, D. and H. Ellenberg. 1974. Aims and methods of vegetaion ecology. John Wiley and Sons, Inc. New York, NY USA 547 p. [ Links ]
Návar-Cháidez, J. J. 2010. Los bosques templados del estado de Nuevo León: el manejo sustentable para bienes y servicios ambientales. Madera y Bosques 16(1): 51-69. Doi: 10.21829/myb.2010.1611179. [ Links ]
Návar-Cháidez, J. J. y S. González-Elizondo. 2009. Diversidad, estructura y productividad de bosques templados de Durango, México. Polibotánica (27): 71-87. [ Links ]
Pretzsch, H. 1996. Diversidad estructural como resultado del comercio silvícola. Memorias de la Reunión Anual de la Asociación Alemana de Institutos de Investigación Forestal. Sección de Ciencias de Rendimiento. Neresheim, Baden-Württemberg, Alemania. pp. 134-154. [ Links ]
Pretzsch, H. 2009. Forest dynamics, growth and yield. From measurement to model. Springer-Verlag Berlín. Heidelberg, Germany. 664 p. [ Links ]
Ríos-Saucedo, J. C., L. M. Valenzuela-Núñez y R. Rosales-Serna. 2019. Evaluación de la biodiversidad vegetal en áreas de bosque templado en Durango, México. Universidad Galileo Galilei Tuxtla Gutiérrez, Chiapas. Ciencia e Innovación 2(1): 185-206. [ Links ]
Rodríguez T., D. A. and R. L. Myers. 2010. Using oak characteristics to guide fire regime restoration in Mexican pine-oak and oak forests. Ecological Restoration 28(3): 304-323. Doi: 10.1353/ecr.2010.0009. [ Links ]
Rzedowski, J. 2006. Vegetación de México. 1ra Edición digital, Comisión Nacional para el Conocimiento y Uso de la Biodiversidad. México, D.F., México. 504 p. [ Links ]
Sánchez-González, A. 2008. Una visión actual de la diversidad y distribución de los pinos de México. Madera y Bosques 14(1): 107-120. Doi:10.21829/myb.2008.1411222. [ Links ]
Secretaría de Medio Ambiente y Recursos Naturales (Semarnat). 2007. Ordenamiento Ecológico del Estado de Durango. Gobierno del Estado de Durango-Semarnat. Durango, Dgo., México. 194 p. [ Links ]
Secretaría de Medio Ambiente y Recursos Naturales (Semarnat). 2014. Ecosistemas terrestres, el medio ambiente en México 2013-2014. http://apps1.semarnat.gob.mx/dgeia/informe_resumen14/02_ecosistemas/2_4.htm l (1 de octubre de 2019). [ Links ]
Shannon, C. E. 1948. The mathematical theory of communication. In: Sahnnon, C. E. and W. Weaver (eds.). University of Illinois Press. Champaign, IL USA. pp. 134-154. [ Links ]
Solís M., R., Ó. A. Aguirre C. , E. J. Treviño G., J. Jiménez P. , E. Jurado Y. y J. Corral-Rivas. 2006. Efecto de dos tratamientos silvícolas en la estructura de ecosistemas forestales en Durango, México. Madera y Bosques 12 (2): 49-64. Doi: 10.21829/myb.2006.1221242. [ Links ]
The Plant List. 2013. The Plant List Version 1.1. http://www.theplantlist.org/ (2 de septiembre de 2019). [ Links ]
Valencia, S. 2004. Diversidad del género Quercus (Fagaceae) en México. Botanical Sciences (75): 33-53. Doi: 10.17129/botsci.1692. [ Links ]
Valenzuela N., L. M. y D. Granados S. 2009. Caracterización fisonómica y ordenación de la vegetación en el área de influencia de El Salto, Durango, México. Revista Chapingo Serie Ciencias Forestales y del Ambiente 15(1): 29-41. [ Links ]
Villarreal, H., M. Álvarez, F. Córdoba, F. Escobar, G. Fagua, F. Gast, H. Mendoza, M. Ospina y A. M. Umaña. 2006. Manual de métodos para el desarrollo de inventarios de biodiversidad. Instituto de Investigación de Recursos Biológicos Alexander Von Humboldt. Bogotá, Colombia. 236 p. [ Links ]
Whittaker, R. H. 1972. Evolution and measurment of species diversity. Taxon 21(2-3): 213-251. Doi: 10.2307/1218190. [ Links ]
Zúñiga V., J. M., E. A. Martínez L., C. Navarrete G., J. J. Graciano L., D. Maldonado A y B. Cano M. 2018. Análisis ecológico de un área de pago por servicios ambientales hidrológicos en el ejido La Ciudad, Pueblo Nuevo, Durango, México. Investigación y Ciencia de la Universidad Autónoma de Aguascalientes 26(73): 27-36. Doi: 10.33064/iycuaa201873204. [ Links ]
Received: November 29, 2019; Accepted: July 14, 2020
 Este es un artículo publicado en acceso abierto bajo una licencia
Creative Commons
Este es un artículo publicado en acceso abierto bajo una licencia
Creative Commons
