


Services on Demand
Journal
Article
 text in
  English (pdf)
 Article in xml format
 Article references
 Send this article by e-mail
Indicators
-
 Cited by SciELO
 -
 Access statistics
Related links
-
 Similars in
SciELO
Similars in
SciELO
Share

 Permalink
Revista mexicana de ciencias forestales
Print version ISSN 2007-1132
Rev. mex. de cienc. forestales vol.11 n.60 México Jul./Aug. 2020 Epub Dec 09, 2020
https://doi.org/10.29298/rmcf.v11i60.705
Scientific article
Allometric relations for Pinus patula Schiede Schltdl. et Cham. plantations in Mexico State
1 Secretaría de Medio Ambiente del Estado de México-Probosque. México.
2 Campo Experimental Chetumal, CIR-Sureste, Instituto Nacional de Investigaciones Forestales, Agrícolas y Pecuarias (INIFAP). México.
3 Facultad de Agrobiología, Universidad Michoacana de San Nicolás de Hidalgo (UMSNH). México.
4 INIFAP-Campo Experimental Saltillo, CIR-Norte Centro, Instituto Nacional de Investigaciones Forestales, Agrícolas y Pecuarias (INIFAP). México.
Allometric relationships are the phenotypic adjustments of species to the environmental conditions where they develop. The objectives were 1) to fit allometric models between the variables stump diameter (dt), normal diameter (d), total height (h) and volume (V) for commercial forest plantations (CFP) of Pinus patula in Regions VI and VII from Mexico State, and 2) to evaluate the differences between the volumes resulting from the volume equations used by the forestry technicians of the State of Mexico. 1 825 dt, d and h data from 65 sampling sites were used to fit 13 allometric models using maximum likelihood. The statistical evaluation was based on the significance of the parameters (p<0.05), the root mean square error, the adjusted coefficient of determination, and the bias. The regression showed significant parameters and standard errors below 1.5 when using the dt as an independent variable, 54.7 % and 87 % of the h and V are explained, and 57.0 % and 91.9 % of the h and the V, respectively, when using the d. The models were reliable enough to be included in a growth and yield system or in the elaboration of CFP management plans. Furthermore, the expression proposed by PROBOSQUE (1990) constitutes the best alternative for the projection of timber yield for P. patula.
Keywords: Timber exploitation; growth; Mathematical models; commercial plantations; yield; mensuration variables
Las relaciones alométricas son los ajustes fenotípicos que manifiestan las especies a las condiciones ambientales donde se desarrollan. Los objetivos del presente estudio fueron: 1) ajustar modelos alométricos entre las variables de diámetro de tocón (dt), diámetro normal (d), altura total (h) y el volumen (V) para plantaciones forestales comerciales (PFC) de Pinus patula en las Regiones VI y VII del Estado de México; y 2) evaluar la diferencia entre los volúmenes resultantes de las ecuaciones empleadas por técnicos forestales del Estado de México. Se emplearon 1 825 datos de dt, d y h provenientes de 65 sitios de muestreo, para el ajuste de 13 modelos alométricos mediante máxima verosimilitud. La evaluación estadística se realizó con la significancia de los parámetros (p<0.05), la raíz del cuadrado medio del error, el coeficiente de determinación ajustado y sesgo. La regresión mostró parámetros significativos y errores estándar inferiores a 1.5; cuando se empleó el dt como variable independiente, se explica 54.7 % y 87 % del h y V, respectivamente; mientras que, si se usa el d para la relación con h y V se obtuvo 57.0 % y 91.9 %, respectivamente. Los modelos resultaron confiables para incluirlos en sistemas de crecimiento y rendimiento, o en la elaboración de planes de manejo de las PFC; además, la expresión propuesta por la Protectora de Bosques del Estado de México (Probosque) representa la mejor alternativa para la proyección del rendimiento maderable para Pinus patula.
Palabras clave: Aprovechamiento maderable; crecimiento; modelos matemáticos; plantaciones comerciales; rendimiento; variables dasométricas
Introduction
Nearly 269 600 ha of commercial forest plantations have been established in Mexico (CFP) (Semarnat-Conafor, 2014a), reducing the pressure on the natural forests, promoting private investment and social development (Semarnat-Conafor, 2014b), and favoring the reconversion of degraded or unproductive areas into woodland (Probosque, 2019).
In the State of Mexico, the establishment of forest plantations (FP) has exhibited an upward trend; 65 ha were reported by 2003; 504 ha, by 2008, and approximately 537 ha by 2014, with a total of 3 070 ha of FP established between 2000 and 2014 (Semarnat-Conafor, 2015a; Probosque, 2019). Nearly 81 % of the forest plantations have been established with species of the Pinus genus (Semarnat-Conafor, 2015b), which must be managed using quantitative forestry tools.
Knowledge of the allometric relationships between the species and the environment in which they grow is essential for an adequate management ofFPs because they influence their growth and development (Semarnat- Conafor, 2014b).
Allometric relationships are a reflection of the adaptations of the species to the environmental conditions of the place where they develop (Niklas, 1995; Gildardo et al., 2011) and can be quantified through a regression analysis and represented mathematically by means of allometric equations (Diéguez et al., 2003; Corral et al., 2007; Picard et al., 2012).
In the forest area, allometric relationships have been modeled between the stump diameter (sd) and the normal diameter (d) (Benítez et al., 2004;Pompa et al., 2009), the sd and the total height (h) (Diéguez et al., 2009; Hernández et al., 2017b; Hernández et al. 2018), the d and the volume (V) (Martínez and Acosta, 2014; García et al., 2017), biomass (B) (Návar et al., 2013) or carbon (C) (Martin et al., 1998; Méndez et al., 2011).
In the State of Mexico, the rate of establishment of CFPs has increased and has played an important role in the development and growth of the forest sector (Probosque, 2019). However, there are certain management problems, such as clandestine felling, loss of plantations due to meteorological causes or health issues, which make it necessary to have quantitative tools for assessing the volumetric losses in these crops. Thus, the objectives of the present study were 1) to adjust allometric models between the variables of commercial interest (sd, d, h and V) for Pinus patula Schiede ex Schltdl. et Cham. at CFPs in Regions VI and VII of the State of Mexico, and 2) to assess the differences between the volumes resulting from the equations used by the forest technicians of the State of Mexico for the Pinus genus.
Materials and Methods
The study area is located on the Neovolcanic Axis, in the forest regions delimited by Probosque: Coatepec Harinas (R-VI) and Valle de Bravo (R-VII), in the State of Mexico, which include Coatepec de Harinas and Ocuilán municipalities, for R-VI, and Amanalco, Villa de Allende and Villa Victoria, for R-VII (Cervantes et al., 1990; Probosque, 2019). The altitude ranges between 2 000 and 2 850 masl; the climate is temperate (Cw); the precipitation is 1 200 mm, and the mean temperature, 14.5 °C (Inegi, 2016). The soil type is Andosol (CCT, 2010).
The sample was established in 90.8 ha distributed in 11 P. patula CFPs aged 4 to 20 years, with a 3 m × 3 m spacing and a mean density of 950 plants ha-1. Eight CFPs are located in R-VII, and three, in R-VI. The polygons of each CFP were constructed with Google Earth® Pro, version 7.3.2.5491 and QGIS Madeira®, version 3.4.13. The sites were 250 m2 in a rectangular shape, using a systematic sampling and a 100 m grid, at whose intersections they were established with the QGIS tool known as “regular points”. In order to avoid the border effect, only sites located at a distance from the boundaries of the plantation were considered.
65 sites were assessed, in which the altitude and the exposure, as well as the stump diameter (sd), and normal diameter (d) were recorded with a Haglöf Mantax Blue® aluminum caliper; and total height (h) of each individual were recorded with a Pm-5/1520 Pc Opti Height Meter® clinometer. The individual volume was estimated using three methods:
a) Through the expressions of the shape factor:
b) With the method proposed in the Second Dasonomic Study of the State of Mexico (Sedemex) (Probosque, 1990):
c) Using the method generated by Vargas et al. (2017):
Where:
V = Stem volume (m3)
d = Normal diameter at 1.30 m (m)
π = Constant of 3.1416
sf = shape factor (0.77)
h = Total (m)
e = Exponential function (2.718281828)
Nl = Natural logarithm
The observed data were captured in a scatter plot of the dispersion between the variables sd-d, sd-h, sd-V1, sd-V2, sd-V3, d-h, d-V1, d-V2, and d-V3; this allowed identifying atypical or aberrant values, which were then deleted from the database. The mathematical models were adjusted with the resulting screened information and after verifying the kurtosis.
13 allometric models were assessed for the sd-d, sd-h, d-h, sd-V, and d-V relationships were reported in the specialized literature (Huang et al., 1992; Pompa et al., 2009; Hernández et al., 2015; Hernández et al., 2017b; García et al., 2017) (Table 1). The models were adjusted using the full information maximum likelihood technique (FIML) in the SAS® 9.2 software (SAS Institute In., 2008).
Table 1 Adjusted allometric models for Pinus patula Schiede ex Schltdl. Et
| Allometric relationship | Model | Identifier |
|---|---|---|
| sd-d |
|
4 |
|
|
5 | |
|
|
6 | |
| sd-h |
|
7 |
|
|
8 | |
|
|
9 | |
| sd-V |
|
10 |
|
|
11 | |
| d-h |
|
12 |
|
|
13 | |
|
|
14 | |
| d-V |
|
15 |
|
|
16 |
Cham. forest plantations in the State of MexSd (or 1/dt) = Stump diameter (cm); d = Normal diameter (cm); h = Total height (m); V = Volume (m3); B 0 , B 1 , B 2 = Parameters to be estimated; Nl= Natural logarithm; e=Exponential function.
The best model was selected based on the significance of the estimators (p> 0.05), the least square mean error (LSME) and the maximum adjusted determination coefficient (R2Adj). Furthermore, the normality and the distribution of the residuals were verified using the Shapiro-Wilk (SW) test and the graphic tendency of the observations, respectively (Huang, 1992; García et al., 2017). The accuracy of the estimations using the best models for each variable was assessed with the bias (E) (García et al., 2017; Corral et al., 2019), and the estimations versus the observed data chart (García et al., 2017).
The three estimated volumes (V1, V2 and V3) were compared by the model selected as the best, based on the differences in the obtained biases and statistically with a t test for independent samples at a confidence level of 95 % (p=0.05), contrasting V1-V2, V1-V3, and V2-V3 (Di Rienzo et al., 2008).
Results
The descriptive statistics of the sample indicate that the sd exhibits a range of values between 6 and 42 cm, while the d ranges from 3 to 40 cm, with a maximum height of 25 m; the difference in the volume was 0.979 m3 (V1-V2) when the equations were used. The kurtosis of the registered data (independent variables) indicates a normal distribution, without deviation problems (Table 2).
Table 2 Basic statistics of data observed in Pinus patula Schiede ex Schltdl. et Cham.plantations in the State of Mexico, Mexico.
| Statistic/ Variable |
Stump diameter (cm) |
Normal diameter (cm) |
Total height (m) |
Volume 1 (m3) |
Volume 2 (m3) |
Volume 3 (m3) |
|---|---|---|---|---|---|---|
| Number of observations | 1 825 | 1 825 | 1 825 | 1 825 | 1 825 | 1 825 |
| Mean | 20.99 | 17.40 | 12.19 | 0.284 | 0.165 | 0.176 |
| Maximum | 41.20 | 39.20 | 25.00 | 2.137 | 1.158 | 1.278 |
| Minimum | 6.00 | 3.40 | 4.00 | 0.002 | 0.002 | 0.001 |
| Variance | 46.98 | 37.53 | 21.46 | 0.066 | 0.020 | 0.024 |
| Standard deviation | 6.85 | 6.12 | 4.63 | 0.258 | 0.142 | 0.157 |
| Kurtosis index | -0.39 | -0.18 | -0.56 | 5.394 | 4.658 | 5.032 |
In a first fit, when verifying the assumptions of the regression in the variables of interest, normality was observed (SW>0.93) for all models; however, the tendency of the residuals in the charts exhibited heteroscedasticity issues. Variance weighting functions were utilized in the solution of this problem (Prodan et al., 1997).
The sd-d, sd-h and d-h relationships were weighted using the formula: Residual/(xφ)0.5, and the sd-V1, sd-V2, sd-V3, d-V1, d-V2 and d-V3 relationships, using the Residual/((1/x)φ)0.5) formula (Crecente et al., 2009; García et al., 2017; Hernández et al., 2017a). This function, based on an exponential equation, was applied according to the methodology suggested
by Harvey (1976), where the utilized variable is interpreted with x and φ, derived from the linear regression of the natural logarithm (Nl) of the residuals in the dependent variable based on Nl(x); with this procedure, the residuals were homoscedastic in all the adjustments (Figure 1) and SW > 0.93.
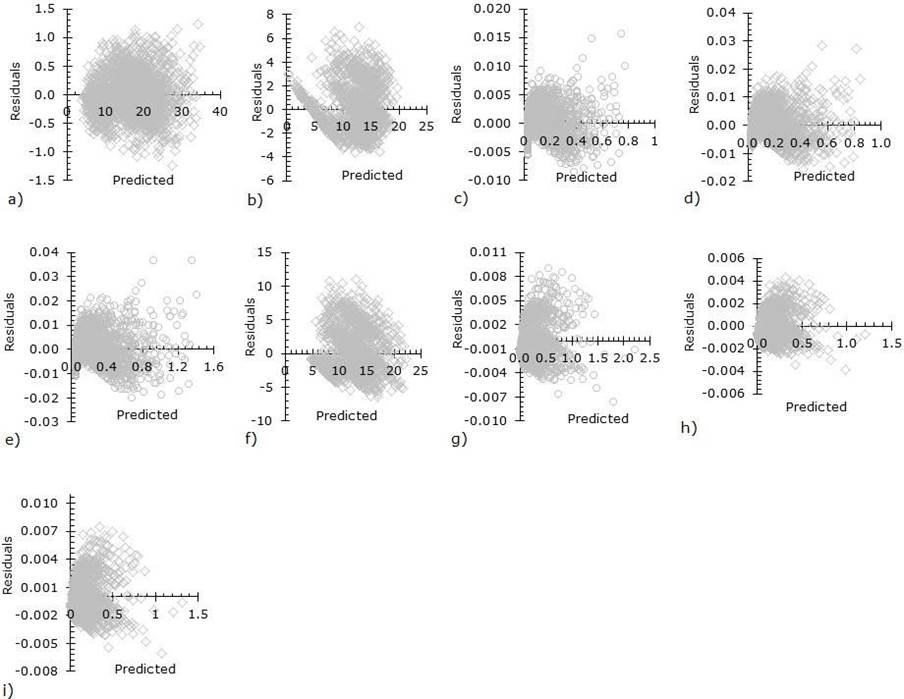
Normal diameter; b) Height; c) Volume 1; d) Volume 2; and e) Volume 3 based on the stump diameter; and for f) Height; g) Volume 1; h) Volume 2; and i) Volume 3 (k) based on the normal diameter.
Figure 1 Distribution of the residuals resulting from the statistical adjustment in the allometric relationships for commercial forest plantations of Pinus patula Schiede ex Schltdl. et Cham. in the State of Mexico.
Once the heteroscedasticity problems were corrected, the results of the fit of the models utilized for the allometric relationship between d, h, V1, V2 and V3 based on sd account for 96.0, 54.7, 86.6, 89.1 and 85.2 % of the variability (R2Adj), respectively, and for 57.0, 91.5, 94.5 and 89.8 %, respectively, in the relationship between d and h, V1, V2 and V3 (Table 3). Significant parameters with a 95 % confidence interval for the best models and standard errors below 1.5 in all cases.
Table 3 Statistics for the adjustment and value of the parameters in allometric relationships of the stump diameter (ds), the normal diameter (d), the total height (h), and the estimated volume (Vi) for forest plantations of Pinus patula Schiede ex Schltdl. et Cham. in the State of Mexico.
| Variable | Model | RMSE | Adj R 2 | Parameter | Estimator | Ase | T value | Pr>t |
|---|---|---|---|---|---|---|---|---|
| dt-d | 4 | 1.498 | 0.960 | β0 | -1.344670 | 0.1040 | -12.97 | <0.0001 |
| β1 | 0.875760 | 0.0040 | 210.80 | <0.0001 | ||||
| 5 | 1.463 | 0.960 | β0 | -1.905270 | 0.0842 | -22.62 | <0.0001 | |
| β1 | 0.966882 | 0.0011 | 850.2 | <0.0001 | ||||
| 6 | 1.528 | 0.959 | β0 | 0.639455 | 0.0120 | 53.20 | <0.0001 | |
| β1 | 1.077157 | 0.0056 | 189.38 | <0.0001 | ||||
| dt-h | 7 | 9.711 | 0.547 | β0 | 27.33707 | 0.5581 | 48.98 | <0.0001 |
| β1 | -15.8681 | 0.4427 | -35.85 | <0.0001 | ||||
| 8 | 9.811 | 0.543 | β0 | 1.73889 | 0.2560 | 6.79 | <0.0001 | |
| β1 | 0.70583 | 0.0080 | 86.29 | <0.0001 | ||||
| 9 | 9.716 | 0.547 | β0 | -0.01125 | 0.0663 | -0.17 | 0.8653 | |
| β1 | 0.828473 | 0.0210 | 39.54 | <0.0001 | ||||
| dt-V | 10.V1 | 0.008 | 0.866 | β0 | 0.051621 | 0.0080 | 6.41 | <0.0001 |
| β1 | 13.1044 | 0.4632 | 28.29 | <0.0001 | ||||
| β2 | -93.3043 | 1.4997 | -62.22 | <0.0001 | ||||
| 10.V2 | 0.002 | 0.891 | β0 | 0.03006 | 0.0040 | 7.53 | <0.0001 | |
| β1 | 6.4056 | 0.1900 | 33.79 | <0.0001 | ||||
| β2 | -88.6921 | 1.2650 | -70.1 | <0.0001 | ||||
| 10.V3 | 0.003 | 0.852 | β0 | 0.03208 | 0.0052 | 6.07 | <0.0001 | |
| β1 | 7.412401 | 0.2817 | 26.32 | <0.0001 | ||||
| β2 | -90.9122 | 1.6063 | -56.6 | <0.0001 | ||||
| 11.V1 | 0.009 | 0.858 | β0 | 2.211235 | 0.0201 | 109.9 | <0.0001 | |
| β1 | -79.5617 | 0.6700 | -118.8 | <0.0001 | ||||
| 11.V2 | 0.002 | 0.883 | β0 | 1.503327 | 0.0173 | 86.77 | <0.0001 | |
| β1 | -75.2011 | 0.5761 | -130.6 | <0.0001 | ||||
| 11.V3 | 0.003 | 0.844 | β0 | 1.643419 | 0.0214 | 76.62 | <0.0001 | |
| β1 | -77.229 | 0.7055 | -109.5 | <0.0001 | ||||
| d-h | 12 | 9.229 | 0.570 | β0 | -0.08326 | 0.6237 | -0.13 | 0.8938 |
| β1 | 0.919122 | 0.0684 | 13.43 | <0.0001 | ||||
| β2 | -0.01031 | 0.0017 | -5.75 | <0.0001 | ||||
| 13 | 10.49 | 0.511 | β0 | 1.776094 | 0.0181 | 98.26 | <0.0001 | |
| β1 | 0.040935 | 0.0008 | 50.57 | <0.0001 | ||||
| 14 | 9.335 | 0.565 | β0 | -10.4242 | 0.5820 | -17.9 | <0.0001 | |
| β1 | 8.20582 | 0.2050 | 40.04 | <0.0001 | ||||
| d-V | 15.V1 | 0.005 | 0.915 | β0 | 42.54767 | 0.2371 | 179.45 | <0.0001 |
| β1 | -0.41312 | 0.0077 | -53.67 | <0.0001 | ||||
| 15.V2 | 0.001 | 0.945 | β0 | 54.2885 | 0.2430 | 223.1 | <0.0001 | |
| β1 | -0.47138 | 0.0080 | -59.18 | <0.0001 | ||||
| 15.V3 | 0.002 | 0.898 | β0 | 53.15026 | 0.3405 | 156.09 | <0.0001 | |
| β1 | -0.48248 | 0.0112 | -43.04 | <0.0001 | ||||
| 16.V1 | 0.006 | 0.904 | β0 | 2.064305 | 0.0135 | 153.08 | <0.0001 | |
| β1 | -62.3728 | 0.3854 | -161.9 | <0.0001 | ||||
| 16.V2 | 0.001 | 0.932 | β0 | 1.381082 | 0.0105 | 131.97 | <0.0001 | |
| β1 | -59.3168 | 0.3014 | -196.8 | <0.0001 | ||||
| 16.V3 | 0.002 | 0.887 | β0 | 1.498366 | 0.0152 | 98.65 | <0.0001 | |
| β1 | -60.4855 | 0.4269 | -141.7 | <0.0001 |
RMSE = Root mean square error; R2Adj= Adjusted determination coefficient; Ase = Approximate standard error.
In the results of the relationships, it was observed that the equations with the best statistical adjustment exhibited inconsistencies in the trends, and therefore we performed a graphic analysis (Figure 2), in which models 4, 8 and 14 were found to be the ones that best predict the information, while 10.V2 and 15.V2 in combination with the expression proposed by Probosque are the ones that best adjust to the sample used, as the shape factor turned out to be high, and the expression of Vargas et al. (2017) yielded results below the trend. However, the fact that the equations were developed for natural forests, and the growth habit is different from that of a CFP, must be considered.
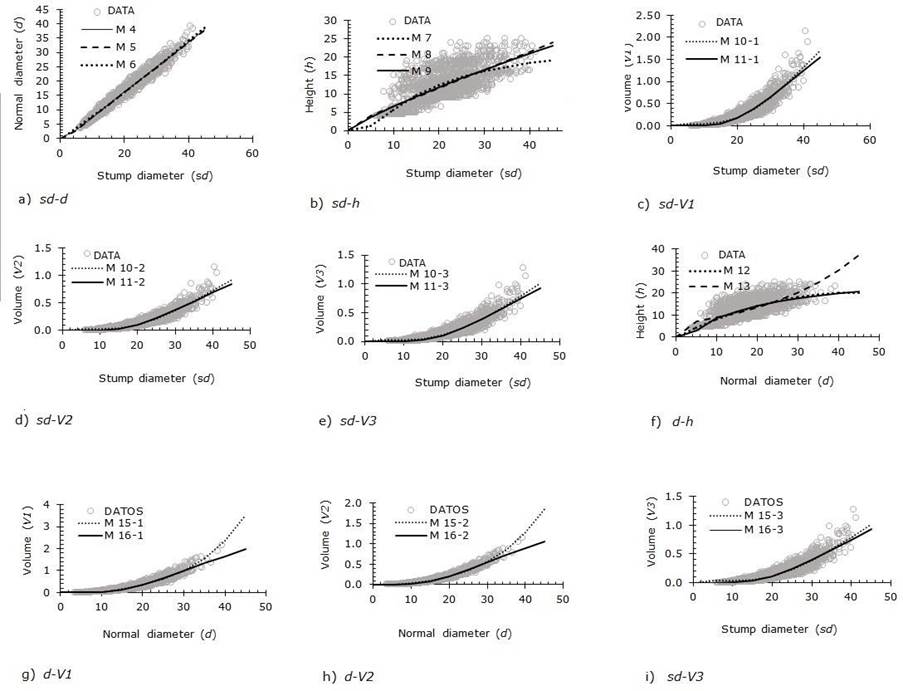
Figure 2 Prediction of the allometric relationships versus observed data of stump diameter (sd), normal diameter (d), total height (h), and volume (V) for Pinus patula Schiede ex Schltdl. et Cham. forest plantations in the State of Mexico.
In the evaluation of the estimations made using the selected model, and with the sd as the independent variable, the bias was 0.00001 cm, 0.000002 m and 0.00000004 m3 for d, h, and V, respectively, and of 0.000011 m and 0.00252 m3 in the estimation of h and V based on the sd. On the other hand, based on the sd, the bias was similar for models V1 and V3, with 0.000001 m3, and based on the d, the bias was 0.0053 m3 for V1, and 0.0030 m3 for V2. While, according to the statistical test, the estimations between models V1- V2 and V1-V3 are different (p<0.05), but those between models V2-V3 are equal (p=0.03).
Discussion
The results from model 4 explain 96.0 % of d variability based on the dimensions of the sd, and, therefore, the R2adj can be considered high according to Gujarati and Porter (2010), who propose that values around 0.8 in the models are synonymous of efficiency when used. When comparing the values thus obtained, it becomes evident that they are similar to those reported by Benítez et al. (2004), who used a log-type model that explains more than 95% of the variability of the data by adjusting the d-sd relationship for Casuarina equisetifolia Forst. in La Providencia Camagüey, Cuba, besides obtaining an aggregate difference that overestimated the d by 1.97 cm; for their part, Bava and López (2006) used a logarithmic model for Nothofagus pumilio (Poepp. & Endl.) Krasser and generated a result that accounts for 97 %, and Quiñonez et al. (2012) utilized allometric relationships for different Pinus and Quercus species, and obtained coefficients that account for more than 92 % of the variability in the d-sd relationship. However, this percentage is lower than that reported by García et al. (2017), who predicted nearly 99 % of the d based on the sd and presented a RSME of 1.777 cm for Abies religiosa (Kunth) Schltdl. et Cham.
Modeling the h based on the sd and the d resulted in an R2Adj of 0.53 and 0.57, respectively, a situation that agrees with that described by Diéguez et al. (2003). These values are indicative of the complexity of modeling this radio due to the great variability and distribution of the information. An example of this are the equations proposed by Quiñonez et al. (2012) for Pinus arizonica Engelm., P. ayacahuite Ehrenb. ex Schltdl., P. durangensis Martínez, P. leiophylla Schiede ex Schltdl. et Cham., P. teocote Schiede ex Schltdl. et Cham. and Quercus sideroxila Bonpl., with values between 0.47 and 0.77; also, García et al. (2017) reported coefficients between 0.37 and 0.68 for species of commercial interest in the tropical forests of Quintana Roo.
For the volume, the results obtained are acceptable, as they account for 89.1 % of the variation of the data, a value that is similar to that reported by Quiñonez et al. (2012), who used an allometric model in their linearized form and obtained an explanation for 90 % of the variation, and results accounting for 86 % to 93 % were obtained by García et al. (2017), who infer that y=a·xb is the adequate model type for predicting the volume based on the sd.
Model 10 is observed to be more reliable for estimating the volume (V1, V2 and V3); however, among the equations, we may appreciate that V2 and V3 exhibit a lower variance in the data than V1, which is handled at convenience because it is a high sf (0.77), while the equation proposed by Probosque (1990) has more stability and is the one most utilized for estimating the individual volume of this species in the region.
The normality tests did not exhibit distribution problems (SW>0.93), and the residuals behaved homoscedastically after the correction, as described by Huang et al. (1992), Crecente et al. (2009) and García et al. (2017) (Figure 2). The biases and trends were acceptable, as the values of the deviations were lower than those obtained by Quiñonez et al. (2012) and García et al. (2017); furthermore, the trends o1f 2 the estimations agree with the values of Martínez and Acosta (2014) when estimating d, by García et al. (2017) when calculating h; Hernández et al. (2018) when projecting the volume, and by Díaz-Franco et al. (2007) when adjusting this type of allometric equations for biomass (B) and captured carbon (C).
As a practical way of exemplifying an application of these equations, it is proposed to evaluate a clandestine felling of a hectare, where an average sd of 40 cm was found when measuring the diameters of 260 stumps in the FP (260 trees ha-1), and allometric equations resulted in an average d of 33.69 cm, an average h of 21.67 m, and average volumes of 1.3233 m3, 0.7276 m3 and 0.7957 m3. Therefore, the timber yield can be estimated in 344.06 m3, 189.19 m3 and 206.89 m3, with the expressions of V1, V2 and V3, respectively. The values of V2 based on a basic density of 0.5049 g cm-3 reported by Goche et al. (2011) for the species allowed projecting a value of 95.52 Mega-grams ha-1 for the extracted biomass, and of 47.76 Mega-grams ha-1 for C02, using the values proposed by Acosta et al. (2009).
Conclusions
The allometric models proposed as the best between the variables of forest interest -stump diameter (cm), normal diameter (cm), total height (m), and volume (m3)- for the Pinus patula commercial forest plantations in Regions VI and VII of State of Mexico are statistically reliable and precise, and therefore they can be included in growth and yield systems for this cultivated species or for the assessment of the products obtained after legal or clandestine exploitation and, in general, in the development of forest management plans.
The evaluation of the differences between the volumes estimated with the volume equations utilized herein considers that the shape factor 0.77 used is high and differs from the other two equations; however, it is currently used in the forest management programs in the state (V1).
Although numerically speaking there is a difference between the volumes estimated by the equations proposed by Probosque (1990) and those calculated with the equations set forth by Vargas-Larreta et al. (2019), they are not statistically different; however, they do differ when the estimation is based on the shape factor. Therefore, either of these two options can be utilized until a specific option is developed for estimating the volumetric stock in the plantations.
Acknowledgments
The authors wish to thank Probosque for the support and the facilities provided for the in-field data collection.
REFERENCES
Acosta, M. M., F. Carrillo A. y M. Díaz L. 2009. Determinación del carbono total en bosques mixtos de Pinus patula Schl. et cham. Terra Latinoamericana 27(2): 105-114. [ Links ]
Bava, O. y M. López P. 2006. Predicción del diámetro a la altura de pecho en función de las dimensiones del tocón de árboles de lenga (Nothofagus pumilio) en Tierra del Fuego, Argentina. Quebracho 13: 87-92. https://www.redalyc.org/articulo.oa?id=48101309&idp=1&cid=78431 (21 de mayo de 2020). [ Links ]
Benítez, N. J., M. Rivero V., A. Vidal, C., C. Rodríguez R. y R. Álvarez R. 2004. Estimación del diámetro normal a partir del diámetro del tocón en plantaciones de Casuarina equisetifolia Forts. de La Providencia Camagüey, Cuba. Revista Chapingo Serie de Ciencias Forestales y del ambiente 10(01): 25-30. https://www.redalyc.org/articulo.oa?id=62910104 (21 de mayo de 2020). [ Links ]
Centro Canadiense de Teledetección (CCT). 2010. Cobertura del suelo de México a 250 metros. Edición 1.0. Catálogo de metadatos geográficos. http://www.conabio.gob.mx/informacion/gis/ (17 de septiembre de 2019). [ Links ]
Cervantes Z., Y., S. L. Cornejo O., L. Márquez R., J. M. Espinoza R., M. Víquez, E. y A. Pineda V. 1990. Provincias Fisiográficas de México, 1:4 000 000. Catálogo de metadatos geográficos. http://www.conabio.gob.mx/informacion/metadata/gis/rfisio4mgw.xml?_httpcache=yesy_xsl=/db/metadata/xsl/fgdc_html.xsly_indent=no (12 de junio de 2019). [ Links ]
Corral R., J. J., M. Bario A., O. A. Aguirre C. and U. Diéguez A. 2007. Use of stump diameter to estimate diameter at breast height and tree volume for major pine species in El Salto, Durango, México. Forestry 80(1): 29-40. Doi: 10.1093/forestry/cpl048. [ Links ]
Corral R., S., A. M. Silva A. y G. Quiñonez B. 2019. Modelo generalizado no-lineal altura-diámetro con efectos mixtos para siete especies de Pinus en Durango, México. Revista Mexicana de Ciencias Forestales 10(53): 86-117. Doi: 10.29 298/rmcf.v10i53.500. [ Links ]
Crecente, F., A. Rojo and U. Diéguez. 2009. A merchantable volume system for Pinus sylvestris L. in the major mountain ranges of Spain. Annals of Forest Science 66: 1-12. Doi: 10.1051/forest/2009078. [ Links ]
Díaz-Franco, R., M. Acosta-Mireles, F. Carrillo-Anzures, E. Buendía-Rodríguez, E. Flores-Ayala y J. D. Etchevers-Barra. 2007. Determinación de ecuaciones alométricas para estimar biomasa y carbono en Pinus patula Schl. et Cham. Madera y Bosques 13(1): 25-34. Doi:10.21829/myb.2007.1311233. [ Links ]
Diéguez A., U., M. Barrio, A., D. Castedo y M. Balboa. 2003. Estimación de diámetro normal y del volumen del tronco a partir de las dimensiones del tocón para seis especies forestales comerciales de Galicia. Investigación Agraria, Sistemas y Recursos Forestales 12(2): 131-139. https://recyt.fecyt.es/index.php/IA/article/view/2502 (21 de mayo de 2020). [ Links ]
Diéguez A., U., A. Rojo, D. Castedo, G. Álvarez, M. Barrio, F. Anta, C. Crecente, G. González, C. Pérez, S. Rodríguez, S. López, V. Balboa, M. y R. Sánchez. 2009. Herramientas selvícolas para la gestión forestal sostenible en Galicia. Túrculo Artes Gráficas, S.A. Lugo, España. 259 p. [ Links ]
Di Rienzo J., A., F. Casanoves, M. G. Balzarini, L. González, M. Tablada y C. W. Robledo. 2008. InfoStat versión 2008. Centro de Transferencia InfoStat, FCA, Universidad Nacional de Córdoba. Córdoba, Argentina. 336 p. [ Links ]
García C., X., J. Hernández R., J. J. García M., A. Hernández R., V. Herrera Á., A. González P. y E. J. Garfias M. 2017. Predicción de diámetro normal, altura y volumen de Abies religiosa a partir del diámetro del tocón. Xalapa, México. Madera y Bosques 23(3): 61-70. Doi: 10.21829/myb.2017.2331528. [ Links ]
Gildardo P., W., D. Cárdenas y A. Dunque M. 2011. Alometría y Crecimiento de seis Especies Arbóreas en un Bosque de tierra firme en la Amazona, Colombia. Colombia Forestal 14(1): 9-21. http://www.scielo.org.co/pdf/cofo/v14n1/v14n1a02.pdf (21 de mayo de 2020). [ Links ]
Goche, T. J. R., A. Velázquez M., A. Borja R., J. Capulín G. y C. Palacios M. 2011. Variación radial de la densidad básica en Pinus patula Schltdl. et Cham. de tres localidades en Hidalgo. Revista Mexicana Ciencia Forestal 2(7): 71-78. Doi:10.29298/rmcf.v2i7.568. [ Links ]
Gujarati, N. D. y C. D. Porter. 2010. Econometria 5a edición. McGraw-Hill Interamericana Editores. México, D. F., México. pp. 97-107. [ Links ]
Harvey, A. C. 1976. Estimación de modelos de regresión con multipli-heteroscedasticidad cativa. Econometrica 44: 461-46. Doi: 10.2307/1913974. [ Links ]
Hernández R., J., J. J. García M., X. García C., E. Geraldine G., A. Hernández R., F. Muñoz, H. y M. Martínez S. 2018. Ecuaciones generalizadas altura-diámetro para bosques de Pinus pseudostrobus Lindl. en Nuevo San Juan Parangaricutiro, Michoacán, México. Madera y Bosques 24(2): 1-18. Doi: 10.21829/myb.2018.242494. [ Links ]
Hernández R., J., H. M. De los Santos P., J. R. Valdez L., J. C. Tamarit U., G. Ángeles P., A. Hernández R., A. Peduzzi y C. Omar. 2017a. Sistema compatible de ahusamiento y volumen comercial para plantaciones de Eucalyptus urophylla en Tabasco, México. Acta Universitaria 27(6): 40-52. Doi: 10.15174/au.2017.1484. [ Links ]
Hernández R., J., A. Hernández R., J. J. García M., X. García C., E. G. García G., H. Muñoz F. y E. H. Olvera D. 2017b. Sistema compatible de ahusamiento-volumen comercial para plantaciones de Pinus greggii Engelm. en Hidalgo, México. Revista Mexicana de Ciencias Forestales 8(39): 59-70. Doi: 10.29298/rmcf.v8i39.43. [ Links ]
Hernández R., J., X. García C., A. Hernández R., J. J. García M., H. Muñoz F., C. Flores L. y E. G. García G. 2015. Ecuaciones altura-diámetro generalizadas para Pinus teocote Schlecht. et Cham. en el estado Hidalgo, México. Revista Mexicana de Ciencias Forestales 6(31): 8-21. Doi: 10.29298/rmcf.v6i31.192. [ Links ]
Huang, S., J. Titus S. and P. Wiens D. 1992. Comparison of nonlinear height-diameter function for major Alberta tree species. Canadian Journal of Forest Research 22(9): 1295-1304. Doi: 10.1139/x92-172. [ Links ]
Instituto Nacional de Estadística y Geografía (Inegi). 2016. Conjunto de Datos Vectoriales de Uso de Suelo y Vegetación, Escala 1:250 000, Serie VI (Capa Union). Catálogo de metadatos geográficos. 1a Edición. Aguascalientes, Ags., México. http://www.conabio.gob.mx/informacion/gis/ (17 de septiembre de 2019). [ Links ]
Martin G., J., B. Kloeppel D., T. Schaefer L., D. Kimbler L. and S. McNulty G. 1998. Aboveground biomass and nitrogen allocation of ten deciduous southern Appalachian tree species. Canadian Journal of Forest Research , 28(11), 1648-1659. Doi: 10.1139/x98-146. [ Links ]
Martínez L., J. y A. Acosta R. 2014. Estimación del diámetro, altura y volumen a partir del diámetro del tocón para Quercus laurina, en Ixtlán, Oaxaca, México. Madera y Bosques 20(1): 59-70. Doi: 10.21829/myb.2014.201176. [ Links ]
Méndez G., J., S. L. Luckie N., M. Á. Capó A. y J. A. Nájera L. 2011. Ecuaciones Alométricas y Estimación de Incrementos en Biomasa Aérea y Carbono en una Plantación mixta de Pinus devoniana Lindl. y P. pseudostrobus Lindl., En Guanajuato, México. Agrociencia 45(4): 479-491. [ Links ]
Návar C., J., F. J. Rodríguez F. y P. A. Domínguez C. 2013. Ecuaciones Alométricas para árboles tropicales: aplicación al inventario forestal de Sinaloa, México. Agronomía Mesoamericana 24(2): 347-356. https://www.scielo.sa.cr/pdf/am/v24n2/a11v24n2.pdf (21 de mayo de 2020). [ Links ]
Niklas, K. J. 1995. Size-dependent allometry of tree height, diameter and trunk-taper. Annals of Botany 75(3): 217-227. Doi: 10.1006/anbo.1995.1015. [ Links ]
Picard, N., A. L. Saint y M. Henry. 2012. Manual de Construcción de ecuaciones alométricas para estimar el volumen y la biomasa de los árboles, del trabajo de campo a la predicción. FAO-CIRAD. Roma, Italia. 221 p. [ Links ]
Pompa G., M., J. Corral R., M. Díaz V. y M. Martínez S. 2009. Función de ahusamiento y volumen compatible para Pinus arizonica Engelm., en el Suroeste de Chihuahua. Revista Ciencia Forestal en México 34(105): 119-136. https://cienciasforestales.inifap.gob.mx/index.php/ejemplares (21 de mayo de 2020). [ Links ]
Protectora de Bosques del Estado de México (Probosque). 1990. Sedemex: Segundo Estudio Dasonómico del Estado de México. Gobierno del Estado de México. Toluca, México. 334 p. [ Links ]
Protectora de Bosques del Estado de México (Probosque). 2019. Desarrollo forestal. http://Probosque.edomex.gob.mx/conservacion_forestal (17 de agosto de 2019). [ Links ]
Prodan, M., R. Peters, F. Cox y P. Real. 1997. Mensura Forestal. Instituto Interamericano de Cooperación para la Agricultura (IICA)/ Deutsche Gesellschaftfur Technische Zusammenarbeit (GTZ) GmbH. San José, Costa Rica. 586 p. [ Links ]
Quiñonez B., G., F. Cruz C., B. Vargas L. y J. Hernández F. 2012. Estimación del diámetro, altura y volumen a partir del tocón para especies forestales de Durango. Revista Mexicana de Ciencias Forestales 3(9): 23-39. Doi: 10.29298/ rmcf.v3i9.535 [ Links ]
Statistical Analysis System (SAS) Institute Inc., 2008. SAS/STAT® 9.2 User’s Guide Second Edition. SAS Institute Inc. Raleigh, NC, USA. S. 238 p. [ Links ]
Secretaría del Medio Ambiente y Recursos Naturales- Comisión Nacional Forestal (Semarnat-Conafor). 2015a. Superficies de Plantaciones Forestales Comerciales Maderables establecidas (2000-2014). http://www.conafor.gob.mx:8080/documentos/docs/43/6022Superficies%20de%20plantaciones%20forestales%20comerciales%20maderables%20establecidas%20en%202000-2014.pdf (17 de agosto de 2019). [ Links ]
Secretaría del Medio Ambiente y Recursos Naturales- Comisión Nacional Forestal (Semarnat-Conafor). 2015b. Principales Especies Maderables establecidas en PFC por Entidad Federativa (2000-2014). http://www.conafor.gob.mx:8080/documentos/docs/43/6019Principales%20especies%20maderables%20establecidas%20en%20PFC%20por%20Entidad%20Federativa%20en%202000%20-%202014.pdf (17 de agosto de 2019). [ Links ]
Secretaría del Medio Ambiente y Recursos Naturales- Comisión Nacional Forestal (Semarnat-Conafor). 2014a. Unidad de Comunicación Social: Boletín 77. México. http://www.conafor.gob.mx:8080/documentos/docs/7/5752M%C3%A9xico%20cuenta%20con%20270%20mil%20hect%C3%A1reas%20de%20%20Plantaciones%20Forestales%20Comerciales.pdf (17 de agosto de 2019). [ Links ]
Secretaría del Medio Ambiente y Recursos Naturales- Comisión Nacional Forestal (Semarnat-Conafor). 2014b. Programas Específicos de Intervención Institucional, Programas de Plantaciones Forestales Comerciales. https://www.gob.mx/cms/uploads/attachment/file/251747/Programa_especifico_de_intervencion_institucional_Plantaciones_Forestales_Comerciales_2014-2018.pdf (20 de agosto de 2019) [ Links ]
Vargas L., B., J. J. Corral R., O. A. Aguirre C., J. O. López M., H. M. De los Santos P., F. J. Zamudio S., E. J. Treviño G., M. Martínez S. y C. G. Aguirre C. 2017. SiBiFor: Sistema Biométrico Forestal para el manejo de los bosques de México. Revista Chapingo Serie Ciencias Forestales y del Ambiente 23(3): 437-455. Doi: 10.5154/r.rchscfa.2017.06.040. [ Links ]
Received: December 04, 2019; Accepted: May 12, 2020
 Este es un artículo publicado en acceso abierto bajo una licencia
Creative Commons
Este es un artículo publicado en acceso abierto bajo una licencia
Creative Commons
