


Servicios Personalizados
Revista
Articulo
 texto en
  Inglés (pdf)
 Artículo en XML
 Referencias del artículo
 Enviar artículo por email
Indicadores
-
 Citado por SciELO
 -
 Accesos
Links relacionados
-
 Similares en
SciELO
Similares en
SciELO
Compartir

 Permalink
Revista mexicana de ciencias forestales
versión impresa ISSN 2007-1132
Rev. mex. de cienc. forestales vol.11 no.59 México may./jun. 2020 Epub 15-Jul-2020
https://doi.org/10.29298/rmcf.v11i59.614
Scientific article
Spatial structure of the mixed and uneven-aged forests in the state of Durango
1Maestría Institucional en Ciencias Agropecuarias y Forestales, Universidad Juárez del Estado de Durango (UJED). México
2Facultad de Ciencias Forestales, Universidad Juárez del Estado de Durango UJED. México
3Instituto de Silvicultura e Industria de la Madera, Universidad Juárez del Estado de Durango UJED. México
4Campo Experimental Centro-Altos de Jalisco, CIR- Pacífico Centro, Instituto Nacional de Investigaciones Forestales, Agrícolas y Pecuarias (INIFAP). México.
The purpose of this work was to describe the spatial structure and research the interactions or correlations among certain tree characteristics in the mixed and uneven-aged forests in the state of Durango. Data of individual tree location and other tree attributes of 446 permanent forest research plots were used. The spatial tree distribution and the interactions among groups of species were determined with the use of the second-order statistic known as Ripley's K function in its univariate L(r) and bivariate L 12 (r) normalized forms. The dimensional association between the sizes of the tree diameters was evaluated with the use of the mark correlation function Kmm(r). The results provided by these statistical tools allow to determine that the spatial structure of the evaluated forests has a complex nature and depends on the scale at which it is analyzed. At distances under 2 m, the random spatial distribution of the trees dominates, while at distances over 2 m the clustering of trees is prevalent. On the other hand in most of the studied sites no significant interactions or mixtures in the spatial distribution of trees of pine and oak were observed, indicating that regeneration and selective silviculture follow a random pattern. The analysis of the spatial interaction between the tree diameter sizes keeps an independent spatial distribution pattern, in which trees with different diameters are mixed randomly within the studied sites.
Key words Spatial distribution; mark correlation function; Ripley's K function; point pattern; Sierra Madre Occidental; permanent forest and soil research sites
El propósito de este trabajo fue describir la estructura espacial e investigar las interacciones o correlaciones espaciales entre algunas características de árboles en bosques mixtos e irregulares en el estado de Durango. Se usó la localización horizontal y ciertos atributos de los individuos arbóreos de 446 sitios permanentes de investigación forestal y de suelos. La distribución espacial, así como la interacción entre grupos de especies se determinaron con el empleo de estadísticos de segundo orden como la función K de Ripley en sus formas normalizadas univariada L(r) y bivariada L 12 (r). La asociación dimensional de los árboles se evaluó con el uso de la función de correlación de marcas Kmm(r). Estas herramientas estadísticas permitieron determinar que la estructura espacial de los boques estudiados es de naturaleza compleja y dependiente de la escala de evaluación con que se analice. A distancias menores de 2 m domina una distribución espacial aleatoria del arbolado, mientras que a distancias mayores de 2 m predomina el agrupamiento. Por otra parte, en la mayoría de los sitios no se observaron interacciones o mezclas significativas en la distribución de los árboles de Pinus y Quercus, lo cual indica que la regeneración y la silvicultura siguen un patrón aleatorio. El análisis de la interacción espacial entre los tamaños de los diámetros de los árboles significa la existencia de un patrón de distribución espacial independiente, en el que los individuos de diferentes diámetros están mezclados de manera aleatoria dentro de los sitios de muestreo.
Palabras clave Distribución espacial; función de correlación de marcas; función K de Ripley; patrón de puntos; Sierra Madre Occidental; sitios permanentes de investigación forestal y de suelos
Introduction
The state of Durango is known as the main forest reserve of Mexico (SRNyMA, 2016). This important position makes it relevant to generate true, reliable information that may allow to determine the current condition of its forests, in order to get to know their dynamics and growth for purposes of management and public dissemination (Corral-Rivas et al., 2009).
The structure of a forest ecosystem is defined by the type, number, spatial and temporal arrangement of the elements that constitute it. Within this context, the spatial and dimensional structures of the species stand out (Aguirre-Calderón, 2002); knowing them is important for forest management purposes for four major reasons (Kint et al., 2003): 1) apart from its use as a biodiversity indicator, the structure of the forest is directly related to the habitat of many vegetal and animal taxa; 2) its description provides a set of parameters that can be utilized for long-term assessment of environmental scenarios; 3) the simple description of the forest’s structure (by categories or by indexes) is used for computer reconstruction of the forest, which affords a broad range of potential applications in forest inventory work, and 4) the structural elements are a greatly useful source of information for decision makers, as they will allow these to know the dynamics and productivity of the forest.
Because trees occupy both vertical and horizontal space, the analysis of their structure is complex (Baca, 2000). However, it is simplified by representing the horizontal location of the trees of a stand in a bi-dimensional plane: each individual corresponds to a point defined by its coordinates, and the stand is considered as a finite group of points known as point pattern (Mora-Donjuán et al., 2016). Furthermore, based on knowledge of the characteristics or quantitative and qualitative marks, such as dimensions, species, etcetera, the point pattern theory is applied to describe the spatial distribution and the interactions of the trees that make up the stand (Stoyan and Penttinen, 2000).
Today there are various statistical methods for characterizing a marked point pattern which are classified as first- and second-order (Wiegand, 2007). First-order methods are used for detailed characterizations of the spatial distribution of the trees; second-order methods usually add up the interaction of repulsion between the points of a pattern (De la Cruz, 2008). Most commonly used in these are Ripley’s K function and the mark correlation function (MXF) (Rubio-Camacho et al., 2017). Ripley’s K function allows determining whether or not the set of points tends to be regular, clustered or random at different scales, while the MCF allows establishing whether a correlation between the distribution of the points and certain particular attributes exists at a specific scale (Stoyan and Stoyan, 1994).
The present study was based on information from 446 sites of a national network of permanent forest and soils research sites implemented by the National Forestry Commission for the purpose of studying the growth dynamics of the productive forest landscapes of Mexico (Conafor, 2013). It presents a characterization of the spatial distribution patterns of trees, as well as the analysis of the interactions between quantitative and qualitative marks of the trees measured in mixed, uneven-aged stands in the state of Durango.
Materials and Methods
Study area and data
The study area comprised 446 permanent forest research sites, located in the mountain system known as the Western Sierra Madre, in the state of Durango, between 22°54' and 26°35' N, and 104°40' and 107°06' W, with altitude intervals ranging between 1 200 and 2 8 00 m (Figure 1).
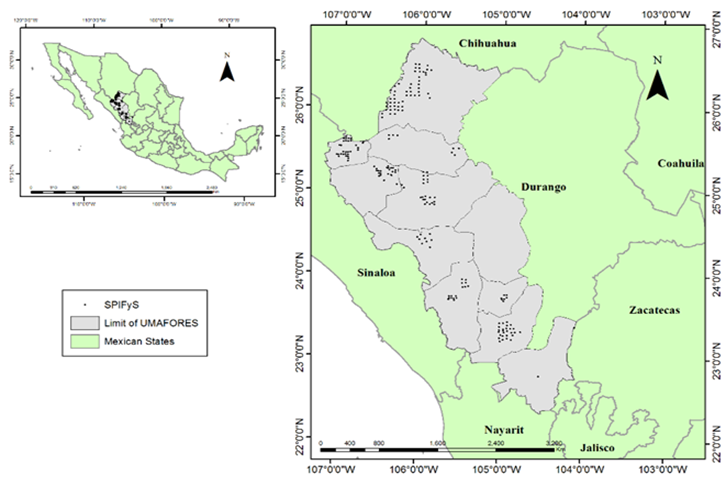
The sites were located through a systematic sampling in a mesh of points with a variable separation of 3 to 5 km. They measured 50 × 50 m, and for each tree with a normal diameter (at a height of 1.3 m above soil level) of 7.5 cm or more, the following variables were considered: species, dominance, normal diameter (cm), total height (m), commercial height (m), cover (m), sanity, physical damage, azimuth (°), distance from the trees to the center of the site (m), and spatial location through coordinates X and Y (Table 1). Normal diameter was calculated from the average of two crosswise measurements taken with a 650 mm Haglöf Mantax forest caliper; height was measured with a Haglöf Vertex IV hypsometer, and the azimuth, with a Tandem Suunto 360PC/360R clinometer.
Table 1 Summary of the variables of the stands of the 446 permanent forest research sites in Durango, Mexico.
| Stand variable | Average | Max | Min | Sd |
|---|---|---|---|---|
| N | 633.26 | 2 264.00 | 88.00 | 284.75 |
| G | 21.77 | 55.42 | 1.21 | 8.77 |
| Dq | 21.48 | 51.00 | 10.17 | 4.88 |
| S | 8 | 15 | 1 | 2 |
N = Number of trees per hectare; G = Basal area (m2 ha-1); Dq = Mean square diameter (cm); S = Number of species; Sd = Standard deviation.
Characterization of the spatial structure
The spatial distribution of trees, the interaction between groups of species, and the size of the trees were determined according to the methodology described below.
Spatial distribution of the trees. Ripley’s K(r) function was applied; it is probably one of the most widely used tools for characterizing point patterns (Equation 1) (De la Cruz, 2013), since it allows knowing in a graphic manner, the type of distribution of the trees within the sites at different distances or scales. The K(r) function represents the expected number of trees separated by a distance equal to or shorter than r, and the number of trees that exist in a circle with a variable radius (r) around a particular tree. The empirical function estimated based on the real data was compared to the one generated in simulated sites through a random process; the typologies of the structures present at all the sites at different scales were determined in this manner.
Where:
A = Study area
n = Number of points in the study area
lij = Distance between the i th and j th trees
Wij = Correction factor of the border effect for points i-j
Diggle (1983), in his discussion of Ripley’s article (1977), proposes using the square root of the K(r) function because it stabilizes the variances and facilitates interpretation (Equation 2). The following transformation has a mean (μ) equal to zero and an approximately constant variance (σ) when the distribution of the trees is random:
At a site with a random distribution, L(r) is equal to zero at any distance. If L(r) has a negative value (i.e. if it has a lower value than expected for a random distribution), then the trees are somewhat distant from one another, which suggests age evenness or inhibition. Conversely, positive L(r) values (i.e. above the value expected for a random distribution) indicate that the trees are closely grouped or that there is a certain attraction between them. Therefore, the L(r) function was utilized in the present study to characterize the type of point pattern of the permanent sites as a function of the scale.
Interaction between tree marks
Interaction between groups of species. The spatial relationship or interaction between trees of the Pinus and Quercus genera was examined with the K 12 (r) function (Equation 3), which determines the number of points with characteristic 2 and distance (r) between the points with characteristic 1. It is defined as follows (Moeur, 1993):
Where:
K 12 (r) = Ripley’s bivariate function
A = Surface area of the sampling site
n 1 and n2 = Number of trees with characteristics 1 and 2, respectively, of all the pairs of trees separated by a distance l ij ≤ r
w ij (r) = Border correction factor equal to the inverse of the proportion of the circumference of a circle centered in tree i and passing through tree j, located within the site
(wij(r) = 1 for circles that are completely within the sampling site w ij (r) > for those cases that require correction for border effect
Its normalized function indicates the intensity, type, and distribution interval exhibited by those points with a particular characteristic (Soto et al., 2010). The value expected for function L 12 (r) is null when the distribution is independent; positive, when the points tend toward attraction, and negative, when the patterns tend toward repulsion. Thus, it is possible to define whether two marks (Pinus and Quercus, in this case) attract or repel one another, or are independent from one another:
Where:
L 12 (r) = Normalized Ripley’s bivariate function
K 12 (r) = Ripley’s bivariate function
ϖ = Pi value
r = Distance
Interaction between the tree diameters. The mark correlation function Kmm(r) defined by Equation 5 was utilized (Stoyan et al., 1987; Ávila-Flores et al, 2014). In this study, x is the location of the tree, and m(x), the normal diameter used as a characteristic of that tree (Stoyan et al., 1987). Therefore, Kmm(r) is defined as:
Where:
E = Expectations
m 1 and m 2 = Marks associated to two points of the process by a distance r
m 1 , m' = Independent realizations of a marginal distribution of marks
In the present study, the function Kmm(r) relates the diameter of a pair of trees located at a given distance (Penttinen et al., 1992). Values under 1 suggest a negative correlation or mutual repulsion; values above 1 indicate a positive correlation or mutual attraction; and those that remain at the mean indicate independence between these marks (Martin, 1994).
The spatial analyses described above were performed for all 446 permanent sites available for the state of Durango. The analysis of the information was performed with the statistical software R Studio™ (Rstudio Team, 2015), through the ggplot2 and spatstat libraries (Baddeley and Turner, 2005).
Results and Discussion
A summary of the results with some examples is shown below, in order to describe the tendencies observed and illustrate how the spatial analysis of point patterns is a useful tool for interpreting development processes and interactions in mixed, uneven-aged forests of Mexico.
Spatial distribution of the trees
Figure 2 shows the current spatial distribution of the trees in two of the analyzed permanent sites. The observed distribution is presented on the left side (images a and b), while the estimation of the L(r) values in relation to the expected L(r) value for a fully random distribution, based on the lower and upper limit estimated with a 95 % confidence interval in 199 random simulations, can be seen on the right side (charts c and d). It shows how the empirical distribution of the L(r) values can be used to examine the repulsion of a random distribution in terms of the distance.
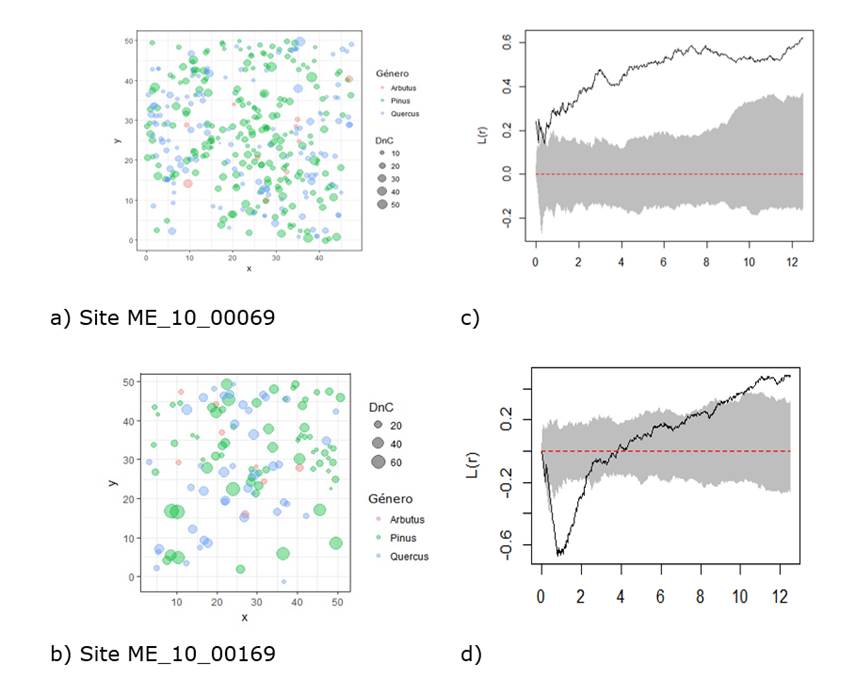
Estimation of L(r) (continuous line) at scales of 0 to 12 m. The gray shaded area represents the lower and upper limit, both of which regenerated with a 95 % confidence interval based on 199 random simulations. Image a) corresponds to a clustered distribution (Site ME_10_00069), and image b) to an even-aged, random and clustered mixture (Site ME_10_00169).
Figure 2 Current spatial distribution of trees in two characteristic sites of the study area (images a and b).
Although no details are expressed for each of the 446 sites, the results of the two examples are characteristic of the mixed, uneven-aged forests in the state of Durango.
Table 2 summarizes the information of the spatial distribution of all the sites analyzed in terms of the scale. A random points pattern was observed to dominate at distances of less than 2 m, as the estimated L(r) curve remains within the confidence interval determined for a random points pattern, while a clustering tendency prevails in most of the studied sites at distances of over 4 m: the estimated L(r) values are positive and are situated above the upper confidence limit defined for a fully random points pattern.
Table 2 Results of the L(r) function utilized to describe the spatial distribution of the trees of 446 permanent forest research sites, located in mixed, uneven-aged forests in the state of Durango.
| Scale (m) | Grouped (%) | Random (%) | Regular (%) | Total |
|---|---|---|---|---|
| 0 to 2 | 46.3 | 52.6 | 1.1 | 100 |
| 2 to 4 | 53.0 | 46.5 | 0.4 | 100 |
| 4 to 6 | 59.2 | 40.8 | 0.0 | 100 |
| 6 to 8 | 60.9 | 39.1 | 0.0 | 100 |
| 8 to 10 | 57.8 | 42.2 | 0.0 | 100 |
| 10 to 12 | 53.7 | 46.1 | 0.2 | 100 |
The even distribution of the trees was practically not registered within the study area because these forests regenerate naturally, not through the use of forest plantations (Castellanos-Bolaños et al., 2010).
Regardless of the method used to characterize the spatial distribution of the permanent forest research sites, the results are similar to those cited by Hernández et al. (2018), Solís-Moreno et al. (2006) and Aguirre-Calderón et al. (2003), who describe distribution patterns with a degree of clustering in mixed, uneven-aged forests in the state of Durango. According to Vallejo (2009), the clustered distribution in forests is related to a good quality of the habitat available for the fauna, regeneration in forest clearings, a limited dispersion of the seeds, and the topographic conditions of the land.
On the other hand, studies have been made with Ripley’s K function that describes random distribution patterns in mixed forests of Mexico. This is the case of Ávila-Flores et al. (2014), Ruiz-Aquino et al. (2015), and Rubio-Camacho et al. (2017), in whose papers these authors make reference only to a limited number of experimental sites (2 to 9), and, therefore, their results cannot be generalized.
Interaction between pine and oak trees
The results of Ripley’s bivariate L 12 (r) function are shown in Table 3 and indicate that, in most sites (an average of 82 %), no significant attractions or interactions exist between Pinus and Quercus trees at all the considered distances; the estimated L 12 (r) curve was kept within the confidence interval determined for a pattern that was independent from the marks of the points. However, L 12 (r) was observed to be positive in more than 11 % of the sites at distances of over 6 m; this indicates a significant positive attraction between pine and oak individuals.
Table 3 Results of the L 12 (r) function utilized for evaluating interactions between Pinus and Quercus individuals in 446 permanent forest research sites located in mixed, uneven-aged forests of the state of Durango.
| Scale (m) | Attraction (%) | Random (%) | Repulsion (%) | Total |
|---|---|---|---|---|
| 0 to 2 | 1.04 | 87.82 | 11.14 | 100 |
| 2 to 4 | 3.63 | 89.64 | 6.74 | 100 |
| 4 to 6 | 7.25 | 83.94 | 8.81 | 100 |
| 6 to 8 | 11.40 | 80.57 | 8.03 | 100 |
| 8 to 10 | 13.21 | 76.42 | 10.36 | 100 |
| 10 to 12 | 13.47 | 75.91 | 10.62 | 100 |
Sites with repulsion at all the assessed distances were recorded, for example, site ME_10_00018, where L 12 (r) was below the lower limit of the confidence interval determined by a mark-independent points pattern at all the assessed distances.
The results evidenced the dominance of a pattern of independence between the positions of the Pinus and Quercus individuals, as these had a primarily random distribution. According to Chen and Bradshaw (1999), this condition is characteristic of mixed forests in maturity or second-growth phases, as in most of the studied sites. Cases of attraction between the Pinus and Quercus trees increase in relation to the distance and can be attributed to the existence of low-efficiency seed dispersion processes (Stoyan and Penttinen, 2000).
Rozas and Camarero (2005) point out that the L 12 (r) function is a very useful tool in forest ecology, as it allows the study of the role of coexistence among the species.
Figure 3 shows the result of Ripley’s bivariate L 12 (r) function for two of the sites analyzed for the purpose of assessing spatial interactions between pine and oak individuals.
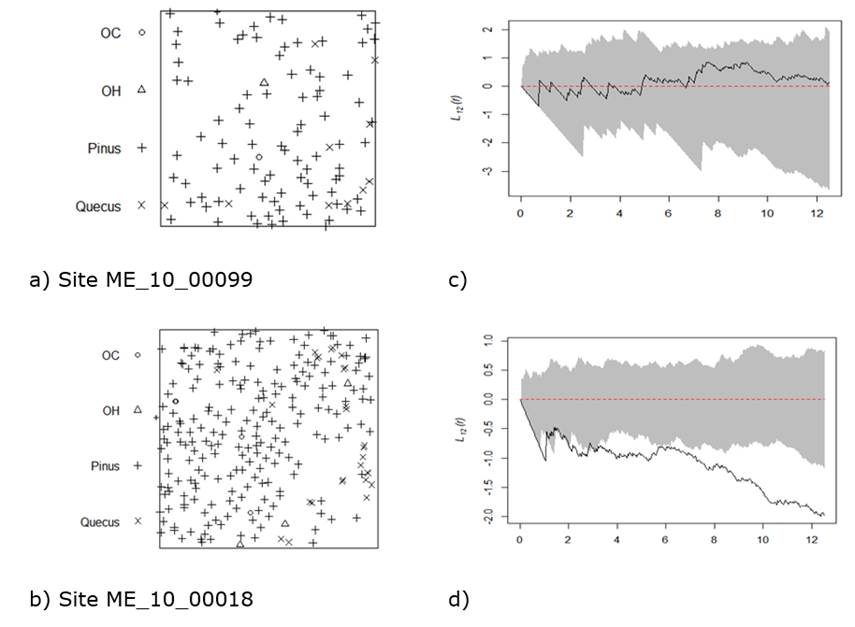
Estimation of L 12 (r) (continuous line) at scales of 0 to 12 m. The gray shaded area represents the lower and upper limits of the confidence interval generated with a 95 % confidence level based on 199 random simulations. Image a) reveals independence between the individuals of the Pinus (+) and Quercus (x) genera (ME_10_00099), and b) shows repulsion (ME_10_00018).
Figure 3 Results of the bivariate L 12 (r) function, showing the interaction between pine and oak individuals in two characteristic sites of the study area (images a and b).
Size differentiation
The prevalence of an independent pattern was made evident in the diameter sizes of the trees (in 90 % of the sites in average), at all the studied distances. The estimated curve remained within the confidence interval determined for a mark-independent pattern for each site, Kmm(r) = 1 (Table 4). According to this result, it is common to observe trees of all diameter categories (>7.5 cm DBH) distributed within the research sites displaying hardly any significant attractions or inhibitions at the assessed scales.
Table 4 Results of the mark correlation function Kmm(r) utilized for researching interactions between the diameter sizes of the trees at 446 permanent forest research sites located in the mixed, uneven-aged forests of the state of Durango.
| Scale (m) | Attraction (%) | Random (%) | Repulsion (%) | Total |
|---|---|---|---|---|
| 0 to 2 | 0.00 | 79.35 | 20.65 | 100 |
| 2 to 4 | 0.00 | 85.57 | 14.43 | 100 |
| 4 to 6 | 0.50 | 89.80 | 9.70 | 100 |
| 6 to 8 | 0.75 | 92.54 | 6.72 | 100 |
| 8 to 10 | 0.50 | 95.77 | 3.73 | 100 |
| 10 to 12 | 1.00 | 97.01 | 1.99 | 100 |
A negative correlation (Kmm(r) < 1) at scales of 0 to 4 m was obtained at certain sites; this indicates a significant repulsion between the individuals, caused by the existence of competition for growth space between them. On the other hand, only in a few isolated cases were positive attractions observed between the diameters of the trees (Kmm(r) > 1) at distances greater than 4 m.
In regard to the values obtained with the mark correlation function Kmm(r) for two sites, trees of different sizes were observed to mix independently within the sampling site (ME_10_00352), while at another site the repulsion was significant (ME_10_00477) (Figure 4).
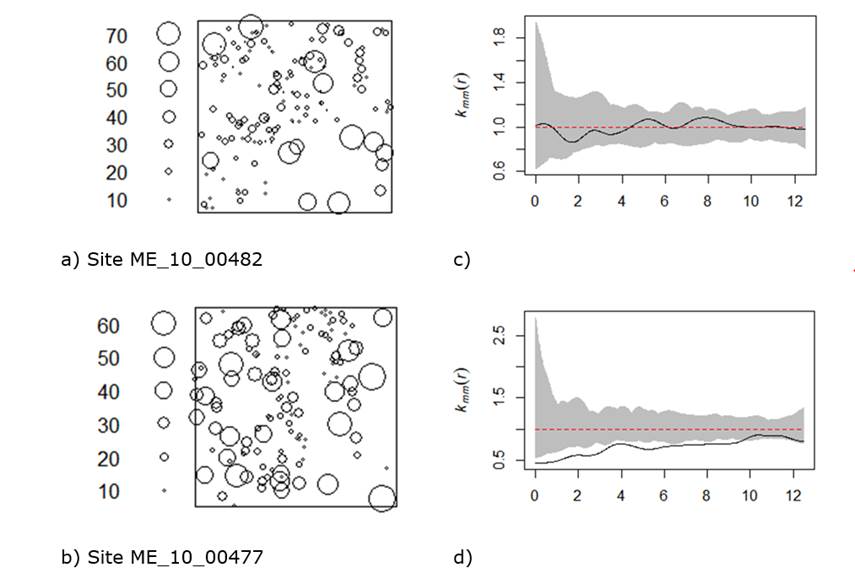
The continuous line represents the estimated Kmm(r). The dotted line shows the theoretical value of the random distribution, and the gray shaded area represents the interval of confidence for a mark-independent pattern. Image a) depicts an example of independence between the diameter sizes of the individuals, and image b) shows a good example of a significant repulsion.
Figure 4 Correlation function for two sites, based on the diameter of the trees as a characteristic mark.
According to Soto et al. (2010), a random correlation between the diameter sizes is characteristic of uneven-aged forests, as trees with various sizes tend to be distributed in this manner. On the other hand, certain authors have described negative correlations at small scales in temperate mixed forests as a result of the competition process imposed by a minimum distance between the individuals (Szwagrzyk and Czerwczak, 1993; Réjou et al., 2011).
Conclusions
The use of second-order statistical tools allows detailed characterization of the spatial structure of the mixed, uneven-aged forests of the state of Durango. The results of the actual study show that the spatial distribution pattern of the trees is clustered and random. However, while a clustering tendency is dominant at scales > 2 m, a random distribution prevails at scales <2 m. The mark correlation analysis indicates that pine and oak trees are distributed independently at most sites, but, for the correlation analysis between the diameters of the trees, an independent distribution pattern is dominant.
Acknowledgements
The authors are grateful to Conacyt for the funds granted to the first author for studying the Institutional Master in Agricultural Sciences and Forest program of the Universidad Juárez del Estado de Durango. To Conafor, for facilitating the data of the study sites.
REFERENCES
Aguirre-Calderón, O. A. 2002. Índices para la caracterización de la estructura arbórea del ecosistema forestal. Ciencia Forestal en México 27(92): 5-27. [ Links ]
Aguirre-Calderón, O. A., G. Hui, K. V. Gadow and J. Jiménez-Pérez. 2003. An analysis of spatial forest structure using neighbourhood-based variables. Forest Ecology and Management 183(1): 137-145. Doi:10.1016/S0378-1127(03)00102-6. [ Links ]
Ávila-Flores, D., M. González-Tagle, J. Jiménez-Pérez y O. A. Aguirre-Calderón . 2014. Efecto de la severidad del fuego en las características de la estructura forestal en rodales de coníferas. Revista Chapingo, Serie Ciencias Forestales y del Ambiente 20(1):33-45. Doi:10.5154/r.rchscfa.2013.01.005. [ Links ]
Baca, J. M. 2000. Caracterización de la estructura vertical y horizontal en bosques de pino-encino. Tesis de maestría. Universidad Autónoma de Nuevo León. Nuevo León, NL., México. http://eprints.uanl.mx/7749/1/1020136368.PDF (23 de mayo de 2019). [ Links ]
Baddeley, A. and R. Turner. 2005. Spatstat: An R package for analyzing spatial point patterns. Journal of Statistical Software 12: 1-42 Doi:10.18637/jss.v012.i06. [ Links ]
Castellanos-Bolaños, J. F., E. Treviño-Garza, O. A. Aguirre-Calderón y J. Jiménez-Pérez. 2010. Diversidad arbórea y estructura espacial de bosques de pino-encino en Ixtlán de Juárez, Oaxaca. Revista Mexicana de Ciencias Forestales 1(2):39-52. Doi:10.29298/rmcf.v1i2.636. [ Links ]
Chen, J. and G. Bradshaw. 1999. Forest structure in space: a case study of an old growth spruce-fir forest in Changbaishan Natural Reserve, China. Forest Ecology and Management 120(3):219-233 Doi:10.1016/S0378-1127(98)00543-X. [ Links ]
Comisión Nacional Forestal (Conafor). 2013. Guía para el establecimiento, seguimiento y evaluación de Sitios Permanentes de Monitoreo en Paisajes Productivos Forestales. Conafor. México, D.F., México. 93 p. [ Links ]
Corral-Rivas, J. J., B. Vargas, C. Wehenkel, O. A. Aguirre, J. G. Álvarez y A. Rojo. 2009. Guía para el establecimiento de sitios de investigación forestal y de suelos en bosques del Estado de Durango. Editorial Universidad Juárez del Estado de Durango. Durango, Dgo., México. 81 p. [ Links ]
De la Cruz, M. 2008. Métodos para analizar datos puntuales. Departamento de Biología Vegetal. Escuela Universitaria de Ingeniería Técnica Agrícola. Madrid, España. 75 p. [ Links ]
De la Cruz, M. 2013. Avances en el análisis espacial de datos ecológicos: aspectos metodológicos y aplicados. ECESPA-Asociación Española de Ecología Terrestre. Móstoles, Madrid, España. 355 p. [ Links ]
Diggle, P. J. 1983. Statistical analysis of spatial point patterns. Academic Press. London, UK. 148 p. [ Links ]
Hernández, F., C. Navarro-Mata, R. Peña-Montañez y A. Nájera-Luna. 2018. Patrón de distribución espacial de las especies arbóreas de la región de El Salto, Durango. Revista Mexicana de Ciencias Forestales 9(47):169-186. Doi:10.29298/rmcf.v9i47.161. [ Links ]
Kint, V., V. Meirvenne, L. Nachtergale, G. Geuden and N. Lust. 2003. Spatial methods for quantifying forest stand structure development: A comparison between nearest- neighbour indices and variogram analysis. Forest Science. 49: 36-49. Doi:10.1093/forestscience/49.1.36. [ Links ]
Martin, M. 1994. Análisis espacial en renovales de roble (Nothofagus oblíqua) y rauli (Nothofagus alpina). Ciencia e Investigación Forestal 8(2):276-300. https://www.infor.cl/cifor/pdf/cifor8_2/CIFOR8_2_1994.pdf (12 de junio de 2019). [ Links ]
Moeur, M. 1993. Characterizing spatial patterns of trees using stem-mapped data. Forest Science 39(4): 756-775. Doi:10.1093/forestscience/39.4.756. [ Links ]
Mora-Donjuán, C. A., E. Buendía-Rodríguez, E. A. Rubio-Camacho, E. Alanís-Rodríguez y E. J. Treviño-Garza. 2016. Distribución espacial, composición y estructura de un matorral en el noreste de México. Revista Fitotecnia Mexicana 39(1):87-95. [ Links ]
Penttinen, A., D. Stoyan and H. Henttonen. 1992. Marked point processes in forest statistics. Forest Science 38(4):806-824. Doi:10.1093/forestscience/38.4.806. [ Links ]
Réjou, M., O. Flores, N. Bourland, J. Doucet, R. Fétéké, A. Pasquier and J. O. Hardy. 2011. Spatial aggregation of tropical trees at multiple spatial scales. Journal of Ecology 99(6):1373-1381. Doi:10.1111/j.1365-2745.2011.01873.x. [ Links ]
Ripley, B. 1977. Modelling Spatial Patterns. Journal of the Royal Statistical Society. Series B (Methodological) 39(2):172-212. http://www.jstor.org/stable/2984796 (29 de mayo de 2019). [ Links ]
Rozas, V. y J. J Camarero. 2005. Técnicas de análisis espacial de patrones de puntos aplicadas en ecología forestal. Investigación Agraria. Sistemas y Recursos Forestales 14 (1): 79-97. [ Links ]
RStudio Team. 2015. RStudio: Integrated Development for R. RStudio, Inc. Boston, MA, USA. http://www.rstudio.com/ (29 de mayo de 2019) [ Links ]
Rubio-Camacho, E. A., M. A. González-Tagle, W. Himmelsbach y D. Y. Ávila-Flores. 2017. Patrones de distribución espacial del arbolado en un bosque mixto de pino-encino del noreste de México. Revista Mexicana de Biodiversidad 88(1):113-121. Doi:10.1016/j.rmb.2017.01.015. [ Links ]
Ruiz-Aquino, F., J. I. Valdez-Hernández, A. Romero-Manzanares y F. Manzano-Méndez. 2015. Distribución espacial de dos especies de encinos y atributos ecológicos del bosque de pino-encino en Ixtlán de Juárez, Oaxaca. Revista Chapingo Serie Ciencias Forestales y del Ambiente 21(1):67-80. Doi:10.5154/r.rchscfa.2014.05.023. [ Links ]
Secretaria de Recursos Naturales y Medio Ambiente (SRNyMA). 2016. Programa Estratégico Forestal 2030. Gobierno del Estado de Durango. Durango, Dgo., México. 200 p. [ Links ]
Solís-Moreno, R., O. A Aguirre-Calderón, E. J Treviño-Garza, J. Jiménez-Pérez, E. Jurado-Ybarra y J. J Corral-Rivas. 2006. Efecto de dos tratamientos silvícolas en la estructura de ecosistemas forestales en Durango, México. Madera y Bosques 12(2):49-64. Doi:10.21829/myb.2006.1221242. [ Links ]
Soto, D. P., C. Salas, P. J Donoso y D. Uteau. 2010. Heterogeneidad estructural y espacial de un bosque mixto dominado por Nothofagus dombeyi después de un disturbio parcial. Revista Chilena de Historia Natural 83(3):335-347. Doi:10.4067/S0716-078X2010000300002. [ Links ]
Stoyan, D. and A. Penttinen. 2000. Recent application of point process methods in forestry statistics. Statistical Science 15: 61-78. Doi:10.1214/ss/1009212674. [ Links ]
Stoyan, D. and H. Stoyan. 1994. Fractals, random shapes and point fields: methods of geometrical statistics. John Wiley and Sons. New York, NY, USA. 406 p. [ Links ]
Stoyan, D., S. Kendall and J. Mecke. 1987. Stochastic geometry and its applications. Wiley. London, UK. 582 p. [ Links ]
Szwagrzyk, J. and M. Czerwczak. 1993. Spatial patterns of trees in natural forests of east-central Europe. Journal of Vegetation Science 4(4):469-476. Doi:10.2307/3236074. [ Links ]
Vallejo M., I. 2009. Cambios a corto plazo en los patrones de distribución espacial de nueve especies de plantas comunes en un bosque nublado al sur-occidente de Colombia. Caldasia 31(1):77-98. https://revistas.unal.edu.co/index.php/cal/article/view/36073/37453 (6 de junio de 2019) [ Links ]
Wiegand, T., C. Gunatilleke, I. Gunatilleke and T. Okuda. 2007. Analyzing the spatial structure of a Sri Lankan tree species with multiple scales of clustering. Ecology 88(12):3088-3102. Doi:10.1890/06-1350.1. [ Links ]
Received: June 25, 2019; Accepted: March 30, 2020
 Este es un artículo publicado en acceso abierto bajo una licencia Creative Commons
