


Services on Demand
Journal
Article
 text in
  English (pdf)
 Article in xml format
 Article references
 Send this article by e-mail
Indicators
-
 Cited by SciELO
 -
 Access statistics
Related links
-
 Similars in
SciELO
Similars in
SciELO
Share

 Permalink
Revista mexicana de ciencias forestales
Print version ISSN 2007-1132
Rev. mex. de cienc. forestales vol.11 n.59 México May./Jun. 2020 Epub July 15, 2020
https://doi.org/10.29298/rmcf.v11i59.670
Scientific article
Ecological descriptors and effects of climate change on the environmental aptitude of Leucaena leucocephala (Lam.) de Wit
1Centro Universitario de Ciencias Biológicas y Agropecuarias. Universidad de Guadalajara. México.
The objective of the study was to estimate the potential alterations in the areas with environmental aptitude (AA) and to establish the ecological descriptors for L. leucocephala; with the MaxEnt model and based on 19 bioclimatic variables and one edaphic, the distribution niche was modeled for the periods 1960-1990, 2041-2060 and 2061-2080. The climatic data were obtained from the Global Climate Data portal of WorldClim and worked with raster and ascii images with a resolution of 30 seconds of arc. For future climatologist, the general circulation model (MCG) was considered: GFDL-CM3 with two representative greenhouse gas concentration trajectories (RCP 4.5 and RCP 8.5). The results showed that for the reference climate (1960-1990), the area with AA for the species is 251 134 Km², and it is located in the coastal areas of the Gulf of Mexico, Sierra Madre Oriental, Occidental and del Sur, Sierra Norte of Puebla, Isthmus of Tehuantepec and part of the Yucatán Peninsula, and the environmental variables that contribute most to explain the distribution of the species are: photoperiod, precipitation of the wettest month, average temperature of the coldest month, accumulated precipitation from May to October and the average temperature from November to April. Regarding future climate scenarios, the projections are for a substantial increase in the area with AA, the 51 to 72 % for the RCP 8.5 and 4.5, respectively. Regarding the ecological descriptors of L. leucocephala, the environmental distribution ranges are wide, both for variables related to temperature and variables related to precipitation.
Keywords Climatic scenarios; climatic ranges; Huaje; MaxEnt; distribution niches; RCP
El objetivo del estudio fue estimar las áreas con aptitud ambiental (AA) y establecer los descriptores ecológicos para Leucaena leucocephala, con el software MaxEnt con base en 19 variables bioclimáticas y una edáfica; se modeló el nicho de distribución para los períodos 1960-1990, 2041-2060 y 2061-2080. Los datos climáticos se obtuvieron del portal de Global Climate Data de WorldClim y se procesaron mediante imágenes ráster y ascii con una resolución de 30 segundos de arco. Para las climatologías futuras se consideró el modelo de circulación general (MCG): GFDL-CM3 con dos trayectorias representativas de concentración de gases efecto invernadero (rcp 4.5 y rcp 8.5). Los resultados mostraron que para el periodo 1960-1990, la superficie con AA para la especie fue de 251 134 km², y se ubica en las zonas costeras del Golfo de México, Sierra Madre Oriental, Occidental y del Sur, Sierra Norte de Puebla, Istmo de Tehuantepec y parte de la Península de Yucatán; las variables ambientales que más contribuyeron a explicar la distribución de L. leucocephala fueron el fotoperiodo, la precipitación del mes más húmedo, temperatura media del mes más frío, precipitación acumulada de mayo a octubre y la temperatura media de noviembre a abril. Respecto a los escenarios futuros, las proyecciones auguran un incremento en la superficie con AA, de 51 a 72 % para los rcp 8.5 y 4.5, respectivamente. En lo referente a los descriptores ecológicos, los intervalos ambientales de distribución son amplios, tanto para las variables de temperatura como de precipitación.
Palabras clave Escenarios climáticos; intervalos climáticos; huaje; MaxEnt; nichos de distribución; rcp
Introduction
The climate of the world is changing at an unprecedented rate and will continue to do so in the next few decades ―more rapidly and intensely than predicted―, and the anthropic influence on this process is clear (IPCC, 2014). There is plentiful evidence that climate change has ecological consequences (Parmesan, 2006; Visser, 2008). The prediction regarding the response of the biological diversity to climate change has become a very active field of scientific research (Beaumont et al., 2011; McMahon et al., 2011); this response plays an important role in alerting scientists and decision makers of the potential future risks, provides a means to reinforce the attribution of the modifications in the ecosystems, and contributes to the development of proactive strategies to reduce the impacts (Parmesan et al., 2011).
The multiple components of climate change are expected to affect all levels of biodiversity, from organisms to the biotic areas (Parmesan, 2006). At the most basic levels, it has the ability to reduce the genetic diversity of the populations due to directional selection and to a rapid migration. This, in turn, can affect the functioning and the resilience of the ecosystem (Lasco et al., 2008; Schneider et al., 2009), which leads to the transformation of the network of interactions at a community level (Bellard et al., 2012).
The modifications of the climate affect the distribution of the species, which can exhibit significant contractions of their available and attainable habitat, and some of which may even become extinct (Parmesan, 2006). Certain climate models have proven to be particularly useful to understand the scope of the distribution and the impact of climate change on threatened taxa. MaxEnt is one of them. It has the potential to predict the loss of biodiversity in future scenarios (Bertrand et al., 2012); it also has significantly improved the prediction of the adequate distribution and habitat of the species affected by climate change (Hu et al., 2015; Carvalho et al., 2017).
Mexico is one of the countries with most biological diversity, due to its great physiographic complexity and to its intricate geological and climatic history. Reportedly, 12 % of the world biodiversity is located in this country, and 12 % of these plant genera and 50 - 60 % of these plant species are endemic (Sarukhán et al., 2009). This richness includes taxa with potential or current use in agriculture and stockbreeding; one example is Leucaena leucocephala (Lam.) de Wit, which is distributed in the tropics across Mexico and Central America. It occurs naturally in the Yucatán Peninsula and the Isthmus of Tehuantepec, in southern Mexico (Cook et al., 2005; Loya et al., 2014). It has extended to a broad range of sites that are mostly frost free; it is also present in many semiarid areas, wherever there is some degree of soil moisture (Heuzé and Tran, 2015). It has a high nutritional quality as feed for bovine, ovine and caprine herds; its aerial biomass is rich in nutrients and tolerant to drought, and it fixates atmospheric nitrogen (N) into the soil and controls erosion. Its shade attenuates the intensity of the light and reduces the effect of high tropical temperatures; furthermore, it favors wildlife, which increases biodiversity (Bacab et al., 2013). It is used as food and as medicine; its wood is used in construction and in the manufacture of utensils; its leaves, flowers and seeds are eaten fresh, raw or cooked (Zarate, 1999; Heuzé and Tran, 2015).
With climate change, the diversity of the climates of Mexico can be altered (Lasco et al., 2008; Schneider et al., 2009), and so can the richness and distribution of species, including those of interest for the present study. For this purpose, , among other aspects, the effect that the climate change will exert on the areas with environmental aptitude for the development of the taxa must be assessed, and, based on this information, project potential adaptation or mitigation measures aimed at minimizing the impact of climate change on natural resources. For this reason, the objectives of the present study were to obtain the ecological descriptors of L. leucocephala and to estimate the potential alterations of climate change in those areas with environmental aptitude for its distribution in the 2041-2060 and 2061-2080 periods in Mexico.
Materials and Methods
Biological databases
The data of 1 138 georeferenced sampling sites, corresponding to the database of the National Inventory of Forestry and Soils (INFyS) of the Comisión Nacional Forestal (Conafor) (Conafor, 2016).
Databases and geographic information system
Raster images of precipitation and temperature for the 1960 - 1990 (reference climatology), 2041-2060 and 2061-2080 periods were utilized; these were obtained from the WorldClim Global Climate Data website (2017) and processed using raster and ASCII images with a resolution of 30 arc seconds; furthermore, the soil texture raster of the National Institute of Statistics and Geography of Mexico (Inegi) was used for the 2041-2060 and 2061-2080 climatologies (Inegi, 2009), and the MGC (for its acronym in Spanish): GFDL-CM3, which is part of the climate modeling developed by the Coupled Model Intercomparison Project Phase 5 (CMIP5) was considered under the RCPs 4.5 and 8.5 (Walton et al., 2013). The RCPs refer to the global radiation of energy expressed in W m-2 and they assume that this radiation varies as the greenhouse gases (GHG) increase.
A series of additional variables were derived from the basic climate variables mentioned above in order to carry out the MaxEnt analysis of potential distribution niches, under the conditions of the 1960-1990 climatology, as well as of the 2041-2060 and 2061-2080 climatologies. The utilized variables were: maximum mean annual temperature, maximum May-October temperature, maximum November-April temperature, mean annual temperature, mean May-October temperature, mean November-April temperature, mean temperature of the warmest month, mean temperature of the coldest month, minimum mean annual temperature, minimum May-October temperature, minimum November-April temperature, annual accumulated precipitation, May-October accumulated precipitation, November-April accumulated precipitation, precipitation of the driest month, precipitation of the wettest month, annual thermal oscillation, average May-October photoperiod, and soil texture (tex).
Those parameters were implemented, and their respective raster images were generated using the Idrisi Selva system (Eastman, 2012). The variables are those normally used for the territorial potentiality of vegetal species (Costa et al., 2010; Moreno et al., 2011).
Ecological niche model
The Maximum Entropy (MaxEnt) software, in its desktop version 3.4.1, was utilized for modeling the ecological niche and predicting the current and future distribution of the taxon (Steven et al., 2017). The MaxEnt model establishes species distribution predictions based on information of the presence data (Phillip et al., 2006) and based on the most significant environmental conditions (Moreno et al., 2011). The pixels where there is a certainty that the species studied herein occur are the sampling points, and the characteristics are the climate, edaphic variables and other functions of these. The purpose of the model is to predict the aptitude of the environment for taxa in terms of environmental variables (Phillips et al., 2006).
Based on the coverage of the parameters and presence data of the species, distribution niches were modeled for the 1960-1990, 2041-2060 and 2061-2080 periods; for this purpose, 75 % of the registered of presence were used as training points, and 25 %, 50 replications and 500 iterations were used as validation points (Sánchez et al., 2018). The AUC (area under curve) index was used to evaluate the statistical model, as this index is one of the most widely used to measure the quality of the models (Moreno et al., 2011). The complexity of the model is controlled through the choice of the variables; furthermore, the MaxEnt model includes in its configuration an operator known as “parameter regulation” which helps prevent the superimposition of variables, and, therefore, its potential harmful effect on the prediction (Phillips and Dudík, 2008).
The values of the obtained points represent relative aptitude for the presence of the species and constitute the basis of a potential distribution model. The resulting images of the MaxEnt niche distribution modeling were recovered in the ArcGis system (ESRI, 2010) and edited in the map format.
Fit of the model
Through the ecological niche model, the MaxEnt model predicts the relative occurrence rate (ROC curve) of the species, as a function of the environmental predictors in each locality (Merow et al., 2013); in turn, the area under the curve (AUC) is interpreted as the adjustment of the model, in which a value of 1.0 would be a perfect classifier and a random classifier would have a value of 0.5 (Phillips et al., 2006), and therefore, those that are close to 1.0 show a better fit of the model to the data.
The MaxEnt results include images with potential areas of distribution of the species, where each cell has a prediction value; on the other hand, a large number of researches require fixating a threshold value for estimating the areas with environmental aptitude for each taxon (Liu et al., 2016), for which purpose the MaxEnt model incorporates a file with the most frequently utilized threshold values. The present study utilized the fixed cumulative value 10 as a logistic threshold.
Results and Discussion
Potential distribution niche model
The results of the application of the Receiver Operating Characteritic (ROC) technique showed that the model is good, as the value of the area under the curve was 0.948 for the training data of the current scenario (red line), and 0.95 for the future scenarios (Figure 1). This indicates that the model for classifying the presence of L. leucocephala was satisfactory (Parolo et al., 2008).
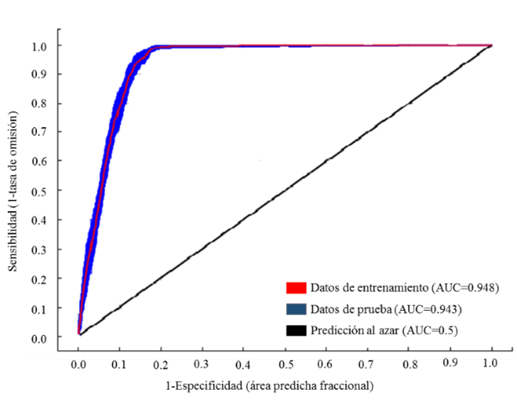
In general, an AUC value above 0.7 is considered to have a good fit (Hanley and McNeil, 1982; Elith, 2006). The environmental variables that accounted for 74 % of the distribution of the species were: the photoperiod, the precipitation of the wettest month, the mean temperature of the coldest month, the accumulated precipitation of the May-October period, and the mean temperature of the November- April period.
Ecological descriptors
Table 1 summarizes the parameters of the ecological descriptors of the environmental variables that accounted to a larger extent for the distribution of L. leucocephala. The environmental distribution intervals were observed to be wide for the variables related to temperature or precipitation. This fact proves a broad rusticity of the species, a characteristic which may be favorable in environments where climate change manifests more aggressively (Heuzé and Tran, 2015).
Table 1 Ecological descriptors of the environmental values which contribute 74 % to the geographic distribution of Leucaena leucocephala (Lam.) de Wit in Mexico.
| Variables | Leucaena leucocephala | ||
|---|---|---|---|
| Min | Max. | % C | |
| November-April photoperiod (h) | 11.2 | 11.6 | 28.8 |
| Precipitation of the wettest month (mm) | 60 | 640 | 24.8 |
| Mean temperature of the coldest month (°C) | 11 | 28 | 11.1 |
| May-October accumulated precipitation (mm) | 297 | 3 157 | 4.7 |
| November-April mean temperature (°C) | 14.2 | 28.5 | 4.4 |
Min = Minimum value, Max = Maximum value, % C = Contribution percentage.
Based on the information of Table 1, L. leucocephala is distributed in regions where the photoperiod of the November-April season lasts 11.2 to 11.6 hours; this condition agrees with the information reported by Heuzé and Tran (2015), according to whom it is a short-day species whose flowering and reproduction are stimulated by a photoperiod of less than 12 hours. However, Whitesell and Parrotta (2008) indicates that the common varieties of L. leucocephala blooms the whole year. Another important variable is the mean temperature of the coldest month, which is distributed in sites with a temperature of 11 to 28 °C, a condition that corresponds to areas with temperate to very warm areas (Medina et al., 1998). Thus, temperature does not appear to be a very restrictive factor for the distribution of the species.
Another important variable was the precipitation of the wettest month. Table 1 shows that L. leucocephala thrives in places with values of 60 and 640 mm, which exist in semiarid to humid areas and which exhibit relative moisture values ranging from low to high in the wettest month of the year. This agrees with the statement of Petit et al. (2010) in the sense that L. leucocephala has a natural distribution in areas where the relative moisture in the month of September (generally the wettest month) is up to 85 %.
Leucaena leucocephala areas with environmental aptitude
The environmental aptitude during the 1960-1990 period (Figure 2) proved to be favorable for the species under study as a result of their broad environmental intervals (Heuzé and Tran, 2015). The surface area with environmental aptitude was notorious in a large part of the center and south of Mexico, which proves that the tropical and subtropical conditions correspond better to the climate needs of the species (Zarate, 1999; Heuzé and Tran, 2015).
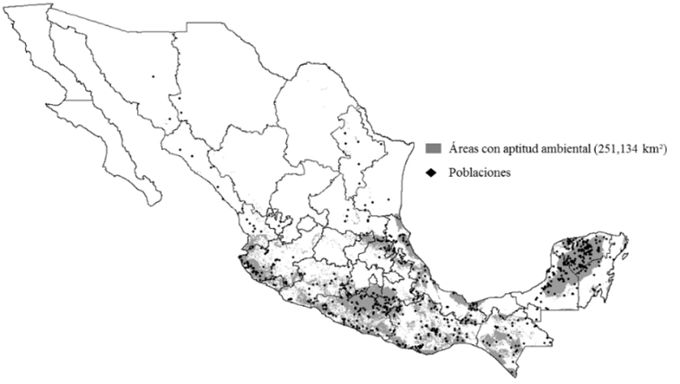
Figure 2 Areas with environmental aptitude for Leucaena leucocephala (Lam.) de Wit in the 1960-1990 period.
The largest presence of the populations was concentrated in the Southern Sierra Madre, in the coastal plains of the Gulf of Mexico and in a large portion of the Yucatán Peninsula; this is consistent with the information cited by Loya et al. (2014) in the sense that L. leucocephala grows in a wide variety of environments, as it has a broad range of climatic adaptation.
Figure 2 shows that the surface area with environmental aptitude of 251 134 km²,is located, mainly, in the coastal areas in the Gulf of Mexico, the Eastern Sierra Madre, the Western Sierra Madre, the Southern Sierra Madre and the Northern Sierra of Puebla, the Isthmus of Tehuantepec and a large portion of the Yucatán Peninsula. This information agrees with the data recorded by Loya et al. (2014) and Heuzé and Tran (2015), according to which this legume has a broad distribution in Mexico and spreads in tropical and subtropical climates at altitudes ranging from sea level to 1 500 masl. This altitude interval of the species may expand due to the pressure of the increase in the temperature of the studied periods, and therefore L. leucocephala will migrate toward higher altitudes.
Environmental aptitude for Leucaena Leucocephala in climate change scenarios
The delimitation of areas for the species and its territorial dynamics, in terms of climate changes, determine in what sense they will impact the increase, reduction or maintenance of the areas of distribution.
The maps of Figure 3 show the territorial dynamics that the areas with environmental aptitude for L. leucocephala will have; in this regard, the prediction of the MCG predicts a favorable dispersion of the surface in the two climate periods and in the two representative GHG concentration routes (Table 2), although it is accentuated with the RCP 4.5 for both periods. As for the 2041-2060 period, the area with environmental aptitude will increase by 72 %, and by 61 % for the 2061-2080 scenario (Figure 4); this agrees with what has been pointed out by Gutiérrez and Trejo (2014), according to whom the effect of the climate change on the ecosystems will reflect on the alteration of the distribution and abundance of the species, or on the direct disappearance of certain taxa and populations.
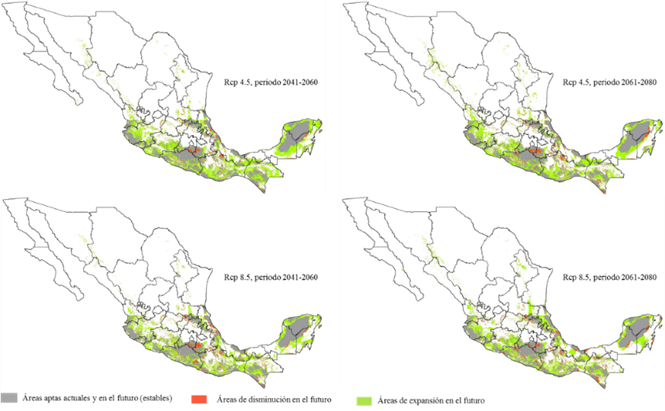
Figure 3 Areas with environmental aptitude for two time periods and two RCPs with the GCM GFDL-CM3 for Leucaena leucocephala (Lam.) de Wit.
Table 2 Areas (km²) with environmental aptitude for Leucaena leucocephala (Lam.) de Wit with the GCM GFDL-CM3, and two representative trajectories of greenhouse gases concentration (RCP 4.5, RCP 8.5) in Mexico.
| Periods | 2041-2060 | 2061-2080 | ||
|---|---|---|---|---|
| RCP | 4.5 | 8.5 | 4.5 | 8.5 |
| Areas with AA | 434 173 | 380 927 | 406 115 | 383 965 |
AA = Environmental aptitude
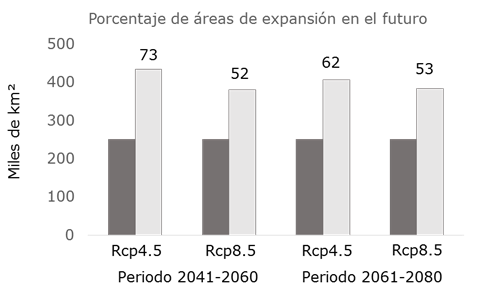
Figure 4 Percentage of expansion of the areas with environmental aptitude (in dark gray) with respect to the reference climate in the 2041-2060 and 2061-2080 periods for two RCPs (4.5 and 8.5).
Figure 3 shows small new areas with environmental aptitude for L. leucocephala, located in the Western Sierra Madre, specifically in the states of Sonora, Sinaloa, Chihuahua, Durango and Nayarit; in the Eastern Sierra Madre, in Nuevo León and Tamaulipas. Also, the model predicts greater increases in the Southern Sierra Madre, the Isthmus of Tehuantepec, and the Yucatán Peninsula; this agrees with the prognosis cited by Hu et al. (2015), according to whom the climate change rates will drastically affect the groups of community and the biodiversity in the tropical areas of the Earth.
Although the RCPs agree with the tendency of the variations in the environmental aptitude surface area, they differ as to their magnitude (Table 2). This is due mainly to the variations of the precipitation, as the RCP 8.5 estimates lower annual precipitation volumes in the two future climate periods.
The above shows that the areas with environmental aptitude are sensitive to the climate simulation variations of the RCPs, even in the models that are considered to be similar in the prediction of the climate change for Mexico (Conde et al., 2006).
Likewise, certain potential dynamic areas with environmental aptitude that respond to the climate change (Figure 3) occur in the central and northern regions of Mexico and exhibit changes in the cropping patterns due to the climate change (Ramírez et al., 2011; Santillán-Espinoza et al., 2011).
The differences in the projections of the surface area with environmental aptitude for L. leucocephala, in the trajectories of GHG concentration of the general circulation model utilized agree with the findings of Beaumont et al. (2008), according to whom, regardless of the model used to estimate the loss of biodiversity as the trajectories of the emissions of greenhouse gas change, the results obtained can be contrasting.
Figure 3 also shows small areas with environmental aptitude which L. leucocephala will lose in the future scenarios, mainly located, for the four RCPs, in the states of Jalisco, Michoacán, Hidalgo, Querétaro, San Luis Potosí, Guerrero, Oaxaca, Chiapas, Puebla, Morelos, Veracruz, Tabasco and the Yucatán Peninsula. This information agrees with that cited by Uribe (2015), in the sense that the climate change predicted for the year 2050 will have serious impacts on the biodiversity of the Mexican territory.
Conclusions
The climate change foreseen for the 2041-2060 y 2061-2080 periods, with the representative trajectories of GHG concentration (RCP 4.5 and RCP 8.5), will increase the surface area with environmental aptitude for L. leucocephala, mainly in the regions of the Western Sierra Madre, the Eastern Sierra Madre and a large part of the Yucatán Peninsula. The gain in surface area with AA will increase with the RCP 4.5 for the two climate periods by an average of 67 %; for the RCP 8.5 the model predicts increases in the surface area with AA by up to an average of 53 % for both climate periods.
Leucaena leucocephala adapts to a broad interval of conditions of precipitation and temperature, which provides adaptive advantages with climatic variation.
Acknowledgements
The authors wish to thank the Comisión Nacional Forestal (Conafor), for allowing access to its database of the geographic coordinates where the species occurs.
REFERENCES
Bacab, H. M., N. B. Madera, F. J. Solorio, F. Vera y D. F. Marrufo. 2013. Los sistemas silvopastoriles intensivos con Leucaena leucocephala: una opción para la ganadería tropical. Avances en Investigación Agropecuaria 17(3): 67-81. http://www.ganaderialaluna.com/pdf/5.pdf (17 de enero de 2019). [ Links ]
Beaumont, L. J., L. Hughes and A. J. Pitman. 2008. Why is the choice of future climate scenarios for species distribution modelling important? Ecology Letters 11:1135-1146. Doi: 10.1111/j.1461-0248.2008.01231.x. [ Links ]
Beaumont, L. J. , A. Pitman, S. Perkins, N. E. Zimmermann, N. G. Yoccoz and W. Thuiller. 2011. Impacts of climate change on the world´s most exceptional ecoregions. Proceedings of the Nacional Academy of Sciences of the United States of America 108(6): 2306-2311. Doi:10.1073/pnas.1007217108. [ Links ]
Bellard, C., C. Bertelsmeier, P. Leadley, W. Thuiller and F. Courchamp. 2012. Impacts of climate change on the future of biodiversity. Ecology Letters 15: 365-377. Doi:10.1111/j.1461-0248.2011.01736.x. [ Links ]
Bertrand, R., V. Perez and J-C. Gégout 2012. Disregarding the edaphic dimension in species distribution models leads to the omission of crucial spatial information under climate change: the case of Quercus pubescens in France. Global Change Biology 18(8): 2648-2660. Doi:10.1111/j.1365-2486.2012.02679.x. [ Links ]
Carvalho, B. M., E. F. Rangel and M. M. Vale. 2017. Evaluation of the impacts of climate change on disease vectors through ecological niche modelling. Bulletin of Entomological Research 107: 419-430. Doi:10.1017/S0007485316001097. [ Links ]
Comisión Nacional Forestal (Conafor). 2016. Inventario Nacional Forestal y de Suelos (INFyS 2004-2009). Comisión Nacional Forestal. https://datos.gob.mx/busca/dataset/inventario-nacional-forestal-y-de-suelos (15 de enero de 2019). [ Links ]
Conde, C., R. Ferrer and S. Orozco. 2006. Climate change and climate variability impacts on rainfed agricultural activities and possible adaptation measures. A Mexican case study. Atmósfera. 19(3):181-194. http://www.scielo.org.mx/scielo.php?script=sci_arttext&pid=S0187-62362006000300003 (15 de enero de 2019). [ Links ]
Costa, G. C., C. Nogueira, R. B. Machado and G. R. Colli. 2010. Sampling bias and the use of ecological niche modeling in conservation planning: a field evaluation in a biodiversity hotspot. Biodiversity and Conservation 19: 883-900. Doi: 10.1007/s10531-009-9746-8. [ Links ]
Cook, B. G., B. C. Pengelly, S. D. Brown, J. L. Donnelly, D. A. Eagles, M. A. Franco, J. Hanson, B. F. Mullen, I. J. Partridge, M. Peters y R. Schultze-Kraft. 2005. Forrajes Tropicales. CSIRO, DPI & F (Queensland), el CIAT y el ILRI. Brisbane, Australia. https://cgspace.cgiar.org/handle/10568/49072 (17 de enero de 2019). [ Links ]
Eastman, J. R. 2012. Idrisi Selva Manual, Manual Version 17. Clark Labs, Clark University. Worcester, 10. Worcester, MS, USA. 322 p. https://clarklabs.org/wp-content/uploads/2016/10/IDRISI-Selva-Spanish-Manual.pdf (17 de enero de 2019). [ Links ]
Elith, J., C. H. Graham, R. P. Anderson, M. Dudík, S. Ferrier, A. Guisan, R. J. Hijmans, F. Huettmann, J. R. Leathwick, A. Lehmann, J. Li, L. G. Lohmann, B. A. Loiselle, G. Manion, C. Moritz, M. Nakamura, Y. Nakazawa, J. M. Overton, A. T. Peterson, S. J. Phillips, K. Richardson, R. Scachetti-Pereira, R. E. Schapire, J. Soberón, S. Williams, M. S. Wisz and N. E. Zimmermann. 2006. Novel methods improve prediction of species distributions from occurrence data. Ecography 29: 129-151. Doi:10.1111/j.2006.0906-7590.04596.x. [ Links ]
Environmental Systems Research Institute (ESRI). 2010. ArcGIS Desktop: Release 10. Environmental Systems Research Institute. Redlands, CA, USA. 15 p. http://earthobservations.org/about_geo.shtml (27 de enero de 2019). [ Links ]
Guitérrez, E. e I. Trejo. 2014. Efecto del cambio climático en la distribución potencial de cinco especies arbóreas de bosque templado en México. Revista Mexicana de Biodiversidad. 85: 179-188. Doi: 10.7550/rmb.37737. [ Links ]
Heuzé, V. and G. Tran. 2015. Leucaena (Leucaena leucocephala). Feedipedia. Un programa de INRA, CIRAD, AFZ y FAO. https://www.feedipedia.org/node/282 (22 de octubre de 2019). [ Links ]
Hanley, J. A. and B. J. McNeil. 1982. The meaning and use of the area under a Receiver Operating Characteristic (ROC) curve. Radiology 143: 29-36. Doi: 10.1148/radiology.143.1.7063747. [ Links ]
Hu, G. X., Y. Jin, R. X. Wang, F. J. Mao and Y. Li. 2015. Predicting impacts of future climate change on the distribution of the widespread conifer Platycladus orientalis. PLoS One. 10(7): 1-15. Doi: 10.1371/journal.pone.0132326. [ Links ]
Intergovernmental Panel on Climate Change (IPCC). 2014. Core Writing Team. In: Pachauri, R. K. and L. A. Meyer (eds.). Climate Change 2014: Synthesis Report. Contribution of Working Groups I, II and III to the Fifth Assessment Report of the Intergovernmental Panel on Climate Change. Geneva, Italy. 31 p. [ Links ]
Instituto Nacional de Estadística Geografía e Informática (2009). Guía para interpretación cartográfica: uso de suelo-vegetación Serie III. D. F. México. 71 p. https://snigf.cnf.gob.mx/wp-content/uploads/Documentos%20metodologicos/Guia%20interpretar%20cartografia.pdf (15 de enero 2019). [ Links ]
Lasco, R. D., F. B. Pulhin, P. A. J. Sánchez, G. B. Villamor, K. A. L. Villegas. 2008. Climate change and forest ecosystems in Philippines: Vulnerability, adaptability and mitigation. Journal of Environmental Science and Management 11(1): 1-14. https://www.researchgate.net/publication/237298215_Climate_Change_and_Forest_Ecosystems_in_the_Philippines_Vulnerability_Adaptation_and_Mitigation (27 de enero de 2019). [ Links ]
Liu, C., G. Newell and M. White. 2016. On the selection of thresholds for predicting species occurrence with presence-only data. Ecology and Evolution 6(1): 337-348. Doi: 10.1002/ece3.1878. [ Links ]
Loya O., J. L., S. Martínez G., O. F. Prado R., Y. S. Valdés G., A. A. Gómez D., F. Escalera V., R. Macedo B. y N. Durán P. 2014. El sistema Silvopastoril. Sistema superior editorial. Tepic, Nay., México. 104 p. [ Links ]
McMahon, S. M., S. P. Harrison, W. S. Armbruster, P. J. Bartlein, C. M. Beale, M. E. Edwards, J. Kattge, G. Midgley, X. Morin and I. P. Prentice. 2011. Improving assessment and modelling of climate change impacts on global terrestrial biodiversity. Trends in Ecology and Evolution 26(5): 249-259. Doi:10.1016/j.tree.2011.02.012. [ Links ]
Medina G., G., J. A. Ruiz C. y R. A. Martínez P. 1998. Los climas de México: una estratificación ambiental basada en el componente climático. SAGAR-INIFAP, INIFAP/CIRPAC/Conexión gráfica. Guadalajara, Jal., México. 104 p. [ Links ]
Merow, C., M. J. Smith and J. A. Silander. 2013. A practical guide to MaxEnt for modeling species distributions: what it does and why inputs and settings matter. Ecography 36: 1058-1069. Doi:10.1111/j.1600-0587.2013.07872.x. [ Links ]
Moreno, R., R. Zamora, J. R. Molina, A. Vásquez and M. Á. Herrera. 2011. Predictive modeling of microhabitats for endemic birds in South Chilean temperate forest using Maximum entropy (Maxent). Ecological Informatics 6(6): 364-370. Doi: 10.1016/j.ecoinf.2011.07.003. [ Links ]
Parmesan, C. 2006. Ecological and evolutionary responses to recent climate change. Annual Review of Ecology, Evolution and Systematics 37: 637-669. Doi: 10.1146/annurev.ecolsys.37.091305.110100. [ Links ]
Parmesan, C., C. Duarte, E. Poloczanska, A. J. Richardson and M. C. Singer. 2011. Overstretching attribution. Nature Climate Change 1: 2-4. Doi: 10.1038/nclimate1056. [ Links ]
Parolo, G., G. Rossi and A. Ferrarini. 2008. Toward improved species niche modelling: Arnica montana in the Alps as a case study. Journal of Applied Ecology 45(5): 1410-1418. Doi: 10.1111/j.1365-2664.2008.01516.x. [ Links ]
Petit, A. J., F. Casanova L. y F. Solorio S. 2010. Rendimiento de forraje de Leucaena leucocephala, Guazuma ulmifolia y Moringa oleifera asociadas y en monocultivo en un banco de forraje. Revista Forestal Venezolana 54(2):161-167. http://www.saber.ula.ve/bitstream/handle/123456789/32522/art4_judithpetit.pdf?sequence=1 (27 de enero de 2019). [ Links ]
Phillips, S. J., R. P. Anderson and R. E. Schapire. 2006. Maximum entropy modeling of species geographic distributions. Ecological Modelling 190: 231-259. Doi:10.1016/j.ecolmodel.2005.03.026. [ Links ]
Phillips, S. and M. Dudík. 2008. Modeling of species distributions with Maxent: new extensions and a comprehensive evaluation. Ecography 31: 161-175. Doi: 10.1111/j.2007.0906-7590.05203.x. [ Links ]
Ramírez L., M. R., J. A. Ruiz C., G. Medina G., J. L. Jacobo C., R. A. Parra Q., M. R. R. Ávila M. y J. P. Amado A. 2011. Perspectivas del sistema de producción de manzano en Chihuahua, ante el cambio climático. Revista Mexicana de Ciencias Agrícolas 2 (especial 2): 265-279. http://www.scielo.org.mx/pdf/remexca/v2nspe2/v2spe2a8.pdf (27 de enero de 2019). [ Links ]
Sánchez G., J. J., C. J. A. Ruiz C., G. Medina G., G. Ramírez O., L. De la Cruz L., J. B. Holland, R. Miranda M. and G. E. García R. 2018. Ecography of teosinte. PLoS ONE 13 (2): e0192676. Doi:10.1371/journal. pone.0192676. [ Links ]
Santillán-Espinoza, L., F. Blanco-Macías, R. Magallanes-Quintanar, J. L. García-Hernández, J. Cerano-Paredes, O. Delgadillo-Ruiz y R. D. Valdez-Cepeda. 2011. Tendencias de temperatura extremas en Zacatecas, México. Revista Mexicana de Ciencias Agrícolas 2(especial 2): 207-219. http://www.scielo.org.mx/scielo.php?script=sci_arttext&pid=S2007-09342011000800004 (16 de enero de 2019). [ Links ]
Sarukhán, J., P. Koleff, J. Carabias, J. Soberón, R. Dirzo, J. Llorente-Bousquets, G. Halffter, R. González, I. March, A. Mohar, S. Anta y J. de la Maza. 2009. Capital natural de México. Síntesis: conocimiento actual, evaluación y perspectivas de sustentabilidad. Comisión Nacional para el Conocimiento y Uso de la Biodiversidad, México, D.F., México. 102 p. https://www.biodiversidad.gob.mx/pais/pdf/CapNatMex/Capital%20Natural%20de%20Mexico_Sintesis.pdf (16 de enero de 2019). [ Links ]
Schneider, R. R., A. Hamann, D. Farr, X. Wang and S. Boutin. 2009. Potential effects of climate change on ecosystem distribution in Alberta. Can J For Res 39(5): 1001-1010. Doi:10.1139/X09-033. [ Links ]
Visser, M. E. 2008. Keeping up with a warming world; assessing the rate of adaptation to climate change. Proceedings of the Royal Society B 275: 649-659. Doi:10.1098/rspb.2007.0997. [ Links ]
Steven, J. P., M. Dudík and R. E. Schapire. 2017. Maxent software for modeling species niches and distributions (Version 3.4.1). http://biodiversityinformatics.amnh.org/open_source/maxent/ (4 de febrero de 2020). [ Links ]
Uribe B., E. 2015. El cambio climático y sus efectos en la biodiversidad en América Latina. CEPAL. Santiago, Chile. 86 p. https://repositorio.cepal.org/bitstream/handle/11362/39855/S1501295_en.pdf;jsessionid=3EF3B8F75A9934A9CFAA8EB01BE4DCDF?sequence=1 (17 de enero de 2019). [ Links ]
Walton, D., J. Meyerson and J. D. Neelin. 2013. Accessing, Downloading and Viewing CMIP5 data. Earth System Grid Federation. https://modelingguru.nasa.gov/docs/DOC-2312 (10 de marzo de 2020). [ Links ]
Wang, G. 2005. Agricultural drought in a future climate: results from 15 global change models participating in the IPCC 4th assessment. Climatic Dynamics. 25(7): 739-753. Doi: 10.1007/s00382-005-0057-9. [ Links ]
Whitesell, C. D and Parrotta A. 2008. Leucaena leucocephala (Lam.) de Wit. Project Forest Service Silvics of Forest Trees of the American Tropics, U. S. Forest Service. Río Piedras Negras, Puerto Rico. pp. 1-4. https://www.researchgate.net/publication/237449765_Leucaena_leucocephala_Lam_de_Wit_leucaena (10 de marzo de 2020). [ Links ]
WorldClim. 2017. Free climate data for ecological modeling and GIS. WorldClim-Global Climate Data. http://www.worldclim.org/ (5 de febrero de 2020). [ Links ]
Zárate, S. 1999. Ethnobotany and domestication process of Leucaena in México. Journal of Ethnobiology 19(1): 1-23. https://www.researchgate.net/publication/233730395 (15 de enero de 2019). [ Links ]
Received: October 02, 2019; Accepted: March 03, 2020
 Este es un artículo publicado en acceso abierto bajo una licencia Creative Commons
