


Servicios Personalizados
Revista
Articulo
 texto en
  Inglés (pdf)
 Artículo en XML
 Referencias del artículo
 Enviar artículo por email
Indicadores
-
 Citado por SciELO
 -
 Accesos
Links relacionados
-
 Similares en
SciELO
Similares en
SciELO
Compartir

 Permalink
Revista mexicana de ciencias forestales
versión impresa ISSN 2007-1132
Rev. mex. de cienc. forestales vol.11 no.58 México mar./abr. 2020 Epub 17-Jun-2020
https://doi.org/10.29298/rmcf.v11i58.619
Scientific article
Forest dynamics and land use in the watersheds that make up Tomatlán municipality, Jalisco State
1Laboratorio de Ecología, Paisaje y Sociedad. Centro Universitario de la Costa. Universidad de Guadalajara. México.
The forest dynamics and land use in the hydrographic watersheds that integrate Tomatlán municipality, Jalisco State (1997-2017) were analyzed. To fulfill this objective, three satellite images were classified: Landsat 5 and 8 (P030 and R046). As a result, two thematic maps were generated with seven types of forest cover and land uses: urban areas, agriculture, grassland, water bodies, medium semi-deciduous forest, deciduous low forest and temperate conifer and broadleaf forest. The map was compared to calculate the change in coverage present at different times. The exchange rate for the 1997-2017 period was determined; the percentage of forest covers that remained was 77 %; and change corresponded to 23 %. Results show that, over the analyzed period, the forest cover that had the greatest gains was the medium semi-deciduous tropical forest with a 1 % increment; the water bodies exhibited a change rate of 1.2 % per year. The gain or increase in this cover is considered to be related to the abandonment of agricultural and livestock areas, which has resulted in a regeneration of the medium growth semi-deciduous forest, while the water bodies are decreasing mainly in the lower parts of the basins, due to the expansion of agricultural areas -which may have implications for soil erosion and salinization-, as well as to changes of the natural landscape.
Key words Socioeconomic activities; change of coverage; watersheds; deforestation; forest dynamics; remote perception
Se analizó la dinámica forestal y usos de suelo en las cuencas hidrográficas que integran al municipio Tomatlán, Jalisco (1997-2017). Para cumplir con este objetivo se clasificaron tres imágenes de satélite: Landsat 5 y 8 (P030 y R046). Como resultado se generaron dos mapas temáticos con siete clases de coberturas forestales y usos de suelo: zonas urbanas, agricultura, pastizal, cuerpos de agua, selva mediana subcaducifolia, selva baja caducifolia, además del bosque templado de coníferas y latifoliadas. El mapa se comparó para calcular el cambio de cobertura presente en los tiempos estudiados. Se determinó la tasa de cambio para el periodo 1997-2017; el porcentaje de coberturas que se mantuvo fue de 77 % y el cambio correspondió a 23 %. Los resultados muestran que, a lo largo del intervalo de tiempo analizado, la cobertura forestal que más ganancias tuvo fue la selva mediana subcaducifolia, con un incremento de 1 %; los cuerpos de agua presentaron una tasa de disminución de 1.2 % por año. Se considera que la ganancia o el incremento de esta cobertura se relaciona con el abandono de áreas agrícolas y pecuarias; lo que ha implicado la regeneración de selva mediana subcaducifolia de segundo crecimiento; mientras que, los cuerpos de agua están disminuyendo, principalmente, en las partes bajas de las cuencas debido al incremento de las zonas agrícolas; lo cual puede tener implicaciones en los cambios del paisaje natural .
Palabras clave Actividades socioeconómicas; cambio de cobertura; cuencas hidrográficas; deforestación; dinámica forestal; percepción remota
Introduction
Activities like the slash, burn and felling of trees are carried out in the of Tomatlán municipality, Jalisco, Mexico, where urbanization, deforestation, and agricultural and livestock activities have an impact on the forest dynamics and land use. This transformation is produced in terms of the climate conditions, and of the nature of the soil and the forest coverage (Gaspari, 2002).
Vegetation is an important indicator to assess various biophysical processes in the ecosystem; for example, the phenomena related to the loss of biodiversity, desertification, the relationship between vegetation and soil erosion, and the vegetation-climate interaction (Gonzaga, 2014). The study of forest dynamics and land use entails the analysis and classification of various types of vegetal covers and of the activities practiced by humans in a particular area or region (Vargas, 1992). Its importance lies in the fact that the vegetal cover is being modified -globally, regionally and locally- by the changes in land use.
The most widely spread example is deforestation in the tropical areas, where the conversion of their cover is estimated to have reached an average of 15.5 million ha per year during the 1981-1990 period, which is equivalent to 8 % annual deforestation rate (FAO, 1996). The present study analyzes the change of covers and of land use (1997-2017 period) in the watersheds of Tomatlán municipality, Jalisco, Mexico. This analysis of the forest dynamics and land use changes will allow estimating the change produced in the various types of soils and land occupation, in order to contribute to the development of ecologically based municipal land use planning and zoning programs.
Materials and Methods
Study area
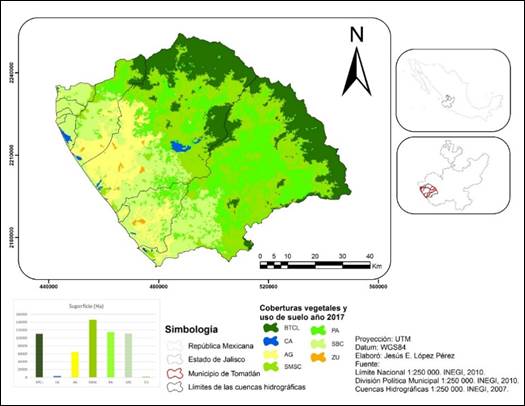
The watershed area that makes up Tomatlán municipality is equivalent to 552 680 ha (Figure 1). According to the Comisión Nacional del Agua (National Water Commission) (Conagua), it belongs to the VIIIth Administrative Hydrological Region, Lerma-Santiago-Pacific, and to the 16th Hydrological Region, Armería-Coahuayana, and includes the watersheds of Ipala, María García, Tomatlán A, Tomatlán B, and San Nicolás A rivers (CEA, 2015). It is located in western Jalisco, at 19°56’3" N and 105°14’8" W (Inegi, 2009). The study area is included in a decree on water reserves for the environment, issued on June 6, 2018 (DOF, 2018).

Vegetation covers and land use maps of 1997 and 2017 were based on satellite images taken by the Landsat platform during the dry season, on May 4th by the TM sensor, and on May 27th by the OLI-TIRS sensor. Subsequently, atmospheric corrections, corrections for the brightness temperature, and a false-color image with bands 3, 4 and 5 were made. Training areas were determined for each cover, and a supervised classification was carried out with the adjustment of the maximum-likelihood algorithm. At the same time, the sample size was calculated in order to proceed to the field verification and the thematic evaluation; likewise, the confidence interval and the Kappa coefficient were estimated for each forest cover and land use map. Change rate was estimated for the 1997-2017 period in order to obtain the change matrix proposed by Pontius et al. (2004), which indicates the tendency of the changes.
The watersheds were compared in terms of the forest covers and land use; the result was the change rate and matrix.
The images for this study were taken by various satellites: Landsat 8 OLI-TIRS and Landsat 5 TM. The scene of the take corresponds to PATH=030 and ROW=046 of the WRS2 system of Landsat 5, which has seven reflective bands with a 30 m spatial resolution.
Preprocessing or preclassification
This methodological phase included the application of processes related to the DOS1 atmospheric and radiometric correction proposed by Chávez (1996). Based on the combination of TM3 (visible spectrum), TM4 (near infrared) and TM5 bands (visible red), it was possible to identify and interpret the analysis categories, and, therefore, 140 training fields or areas (number of representative or prototypic pixels per class or category) were digitalized. The location and spatial distribution of the training fields were carried out in a random, homogeneous way (20 fields minimum for each one of the covers) and through in situ rounds, along with the use and management of a global geopositioning system. The delimitation of the training areas (total number of pixels) was carried out based on Jensen’s general rule (1996), which considers at least ten times the number of bands utilized for developing the statistics or classification parameters. The classifier was calibrated using the prototypical pixels of each category (training areas), which were graphically represented by means of histograms in order to obtain the spectral signatures for each category. These were subjected to a separability analysis (García and Mas, 2008) based on the transformed divergence (TD) method, which uses the maximum-likelihood algorithm proposed by Maussel et al. (1990).
Classification
Classification was made by the maximum-likelihood algorithm, which considers the previously estimated classification parameters (calibrated classifier) for labeling each pixel of the image in one of the defined classes (Lira, 2010). The land use and vegetation maps of the watersheds for 1997 and 2017 were generated based on this algorithm. The methods, techniques and procedures described above (pre-classification and classification) were implemented with the ArcGIS 10.5 and ENVI 5.3 softwares.
Validation of the 1997 and 2017 forest cover and land use maps
In order to determine the degree of certainty of the data of the forest cover and land use maps, these were subjected to a process of evaluation of their thematic reliability, which was performed at the following methodological phases:
Sampling design. This consisted in determining the sampling units (pixel), the selection method or simple random sampling, and the number of sampling units or sample size. The latter was determined according to Congalton (1988; 1991), who suggests verifying at least 50 points per category. This principle was applied to the classified images, and seven categories or analysis classes were determined through the verification of 350 sampling points.
Evaluation of the verification sites. The sampling points were registered in situ; i.e. their spatial location (UTM coordinates, area 13N, datum WGS84) was determined by means of field rounds (direct observation) and with the use and management of a Global Geopositioning System; inaccessible points were verified using Google Earth 7.3 images. The sampling points were overlayed in the land use and vegetation cover maps (1997 and 2017) resulting from the visual interpretation of the satellite images, in order to associate them with the categories or classes defined in each of the classified maps.
Data analysis. This was based on the development of a confusion matrix or error matrix, which is bi-dimensional and on which the rows usually represent the reference classes (truth-ground), and the columns, the categories of the map (ground truth-image). The diagonal of the matrix expresses the number of verification points, for which a correspondence exists between the categories of the classified map and the reference data, while the marginal points indicate assignation errors. Changes were made by the methodology proposed by Pontius et al. (2004), which consisted in developing a cross-tabulation or change matrix.
Kappa index
The multiple relationships between the various categories were analyzed with multivariant categorical analysis techniques, which are ideal for the global study of confusion matrixes (Campbell, 2007). One of the most commonly used indexes is the Kappa statistic (k), which measures the difference between the map-observed reality agreement and the agreement that is expected to occur at random. It attempts to delimit the degree of fit due only to the accuracy of the classification, dispensing with the one that is caused by random factors. The purpose of the test is to evaluate whether the classification discriminates between the categories of interest with a significantly greater precision than that which would have been obtained with a random assignation (Chuvieco, 1990; Morales, 2014). The following formula was used:
Where:
The obtained value represents the percentage in which the classification is better than the randomly expected one; if the obtained value is 0.80, the classification of the map is 80 % better. Three classes of results are considered: a value of K<0.4 represents a poor agreement; between 0.4 and 0.8, a moderate agreement, and a value above 0.8, a strong agreement.
Change rate in the 1997-2017 period
Based on the data derived from the change matrix (surface area of each category), change rates were estimated by forest cover and land use for the analysis period (1997-2017). The best way to quantify them is by means of the analysis of the dynamics of the vegetal cover, relating it to space and time (Berry et al., 1996). FAO (1996) proposed Equation 2, which expresses the change in the surface area of the initial year as a percentage:
Where:
Transition matrix
This was obtained through the overlaying of two forest cover and land use maps with different dates and the resulting data analysis arranged in a matrix, which allowed efficient identification of changes between categories. The matrix is arranged in such a way, that the cover classes of the initial date (T₁) are placed on the rows, and the categories of the final date (𝑇₂) are placed in the columns, whereby only the diagonal of the matrix shows the total amount of stable landscape between the two dates, while the rest corresponds to all possible combinations of exchange between categories (Table 1).
Table 1 Transition matrix with gains and losses.
| Time 2 | |||||||
|---|---|---|---|---|---|---|---|
| Category 1 |
Category 2 | Category 3 |
Category 4 |
Total,
time 1 |
Loss | ||
| Time 1 | Categories 1 | P11 | P12 | P13 | P14 | P1+ | P1+-P11 |
| Categories 2 | P21 | P22 | P23 | P24 | P2+ | P2+-P22 | |
| Categories 3 | P31 | P32 | P33 | P34 | P3+ | P3+-P33 | |
| Categories 4 | P41 | P42 | P43 | P44 | P4+ | P3+-P44 | |
| Total time 2 | P+1 | P+2 | P+3 | P+4 | |||
| Gains | P+1-P11 | P+2-P22 | P+3-P33 | P+4-P44 | |||
Results and Discussion
According to Challenger and Soberón (2008) and Inegi (2008), and considering the heterogeneity of the vegetation in Mexico, forest covers were grouped in a hierarchical classification system that combines the name of the formation and the community type, established upon the basis of previous georeferenced field information (control points), documental information and photographic material (Table 2).
Table 2 Grouping of forest covers and land use.
| Forest covers and land use | Community and other covers | Assigned value |
|---|---|---|
| Agricultural lands | Temporary agriculture; mainly wheat, barley, beans, corn, and chickpeas | 1 |
| Temperate conifer and broadleaf forest | Genera: Pinus, Quercus, Magnolia, Ilex, Cornus, Tilia, Dendropanax, Carpinus, Ostrya, Fraxinus, Styrax y Saurauia | 2 |
| Water bodies | Dams, riverbeds and marine areas | 3 |
| Grasslands | Poaceae, Asteraceae y Cyperaceae | 4 |
| Low deciduous tropical forest | Bursera, Pithecellobium, Lysiloma y Lonchocarpus | 5 |
| Medium growth semi-deciduous tropical forest | Enterolobium cyclocarpum (Jacq.) Griseb. (monkey ear tree, guanacastle), Cedrela odorata L. (Spanish cedar), Tabebuia donnell-smithii Rose (primavera), Hymenaea courbaril L. (courbaril), Dalbergia sp. (rosewood), Astronium graveolens Jacq. (glassywood), Platymiscium dimorphandrum Donn.Sm. (hormigo tree) and Acrocomia aculeata (Jacq.) Lodd. ex Mart. (coyol palm) | 6 |
| Urban areas | Includes all areas with an urban infrastructure | 7 |
Forest cover and land use maps
Two forest cover and land use maps were generated for the years 1997 and 2017 (Figures 2 and 3) by applying processes related to the radiometric and atmospheric correction, the interpretation of satellite images (Landsat TM and OLI-TIRS), and the supervised maximum-likelihood method. Seven types of vegetal covers and land use were determined: 1. Urban area (𝑍𝑈); 2. Temperate conifer and broadleaf forest (𝐵𝑇𝐶𝐿); 3. Agricultural (𝐴𝐺); 4. Grasslands (𝑃𝐴); 5. Low deciduous tropical forest (𝑆𝐵𝐶); 6. Medium growth semi-deciduous tropical forest (𝑆𝑀𝑆𝐶); and 7. Water bodies (𝐶𝐴).

The images were divided into seven general classes that combined more specific covers (Table 3), for if the study area were to be divided into a larger number of classes, the data contained in the training area would exhibit variability and often polymodal distributions, and, therefore, would detract from the efficiency of the maximum-likelihood algorithm (Campbell, 2007).
Table 3 Surface area in hectares for each vegetal cover and land use per year.
| Covers | Year | |
|---|---|---|
| 1997 | 2017 | |
| BTCL | 115 855 | 110 868 |
| CA | 4 558 | 3 595 |
| AG | 56 697 | 64 607 |
| SMSC | 120 535 | 145 730 |
| PA | 121 770 | 114 880 |
| SBC | 131 623 | 111 144 |
| ZU | 1 643 | 1 857 |
| Total | 552 680 | 552 680 |
Kappa index
Results from the process of evaluation of the thematic reliability show that the forest cover and land use maps for 1997 and 2017 were 79.54 %, 0.71 and 83.40 %, 0.77, respectively. The confidence interval and the Kappa index turned out to be acceptable in all cases (Fm >75 %) and (k<0.4) (Lesschen et al., 2005). It must be mentioned that the validation of these maps was satisfactory, a product of the application of the simple random sampling method (Congalton, 1988), as well as of the field collection and spatial location of the verification sites (sample size) (Valdez et al., 2011).
Change rate
Table 4 lists the forest covers and land use, plus the surface area and the percentage for 1997 and 2017 in each of the assigned categories.
Table 4 Surface distribution of the forest covers and land use in the 1997-2017 period.
| Covers | Land use and vegetation | Change of land use | |||||
|---|---|---|---|---|---|---|---|
| 1997 | 2017 | 1997-2017 | |||||
| Hectare | % | Hectare | % | Hectare | Hectare /year | TC | |
| BTCL | 115 854.70 | 21 | 110 868 | 20.1 | -4 986.70 | -249.3 | -0.2 |
| CA | 4 557.8 | 0.8 | 3 594.8 | 0.7 | -963 | -48.2 | -1.2 |
| AG | 56 696.8 | 10.3 | 64 607 | 11.7 | 7 910.20 | 395.5 | 0.7 |
| SMSC | 120 534.90 | 21.8 | 145 730 | 26.4 | 25 195.10 | 1 259.80 | 1 |
| PA | 121 770.3 | 22 | 114 880 | 20.8 | -6 890.30 | -344.5 | -0.3 |
| SBC | 131 622.6 | 23.8 | 111 144 | 20.1 | -20 478.60 | -1 023.90 | -0.8 |
| ZU | 1 642.70 | 0.3 | 1 856.6 | 0.3 | 213.9 | 10.7 | 0.6 |
| Total | 552 680 | 100 | 552 680 | 100 | |||
The change field refers to the hectares that increased and diminished in each category (Table 4), and annual rate is the increase or reduction in hectares per year, during the analyzed period. As for the cover change rate, the expansion of agricultural areas and grasslands is the main deforestation factor with an impact on the low deciduous forest, with 0.8 %. These values are similar to those cited in other areas of the country.
Deforestation rates of 4.2 % have been estimated in the forest of Los Tuxtlas, Veracruz (Dirzo and García, 1992); of 1.58 to 2.3 % for Huistán and 0.46 to 3.42 % for Chanal, in Chiapas (Ochoa-Gaona and González-Espinosa, 2000). Averages of 3.31 to 2.14 % have been documented for the Lacandona rainforest (Mendoza and Dirzo, 1999), and of 1.4 % for the state of Morelos (Trejo and Dirzo, 2000). The urban areas were the covers with the slightest change, i. e. 0.6 %; this is considered to be the result of the low land availability for the construction of infrastructure in the lower parts of the watersheds, as about 179 487 ha of the surface area are covered with grasslands and agricultural lands, and 8.0 %, by lower deciduous tropical forests.
Change matrix for the 1997-2017 period
The columns of the matrix represent the (aerial) portion of the categories of date 1 (𝐹₁); the rows contain the proportion (surface area) of the categories of date 2 (𝐹₂) (Table 5). The main diagonal corresponds to persistence (in red fonts) of the categories preserved between the dates 𝐹₁ and 𝐹₂ for each period. In the temporal analysis of the dynamic of the changes occurred in a period of twenty years, the grasslands have been observed to maintain a cover of 81 517 ha; the cover that most contributed to this increase was the medium growth semi-deciduous tropical forest, with a surface area of 28 530 ha; while the greatest loss was for the medium growth semi-deciduous tropical forest, which preserved a surface area of 92 906 ha.
Table 5 Cross-tabulation or change matrix for the 1997-2017 period.
| 2017 | |||||||||||
|---|---|---|---|---|---|---|---|---|---|---|---|
| BTCL | CA | AG | SMSC | PA | SBC | ZU | Total | Loss | |||
| 10 | 20 | 30 | 40 | 50 | 60 | 70 | |||||
| 1997 | BTCL | 1 | 99 722 | 0 | 9 187 | 1 959 | 110.88 | 11 146 | |||
| CA | 2 | 3.30 | 47 | 130 | 16 | 92 | 3 595 | 287 | |||
| AG | 3 | 238 | 46.64 | 968 | 4 870 | 11 142 | 745 | 64 607 | 17 962 | ||
| SMSC | 4 | 14 816 | 112 | 207 | 92 906 | 28 530 | 9 160 | 0 | 145 730 | 52 824 | |
| PA | 5 | 1 317 | 591 | 3 630 | 15 487 | 81 517 | 12 249 | 89 | 114 880 | 33 362 | |
| SBC | 6 | 309 | 5 277 | 1 857 | 4 832 | 98 858 | 10 | 111 144 | 12 286 | ||
| ZU | 7 | 890 | 46 | 121 | 799 | 1 857 | 1 058 | ||||
| Total | 115 855 | 4 558 | 56 697 | 120 535 | 121 770 | 131 623 | 1 643 | ||||
| Gain | 16 133 | 1.25 | 10.05 | 27 629 | 40 253 | 32 764 | 844 | ||||
Forest cover and land use change maps for the 1997-2017 period
The end product was a forest cover and land use change map indicating the percentage of change and the percentage to which the analyzed covers were preserved (Figure 4).

In general, Figure 4 shows all the changes observed in the vegetation cover and land use, as well as the structures that were maintained. The total of covers that exhibited changes was 23 %, while 70 % remained unchanged; this is similar to the estimations cited by Camacho-Sanabria et al. (2017) in a study performed in Progreso, Hidalgo State, where 95 % of the cover was preserved and land use changes affected a mere 5 %.
Conclusions
The presence of both medium growth semi-deciduous forest, with 145 730 ha, and temperate conifer and broadleaf forests, with 110 868 ha, is a distinctive feature of the natural resources of the region, where a change process is occurring, in which the largest accretion of cover is originated in the agricultural areas, at a rate of 0.7 %, and is advancing increasingly toward the original vegetation areas, primarily toward the low deciduous tropical forest. However, the degree of conservation of the forest covers is considered to be in a recuperation process, while some are at a stage of maturity, like the medium tropical forest and the temperate forests. This is due to the processes of abandonment of land in the higher parts, and to change of activities among the primary sector toward touristic services in the lower watersheds. For this reason, policies or actions for the long-term preservation of the forest cover must be implemented through the application of land management tools.
Acknowledgements
The authors wish to express their gratitude for the support received from the Laboratory of Ecology, Landscape and Society of the South Coast University Center of the Universidad de Guadalajara, for lending their facilities for carrying out this research.
REFERENCES
Berry, M. W., R. O. Flamm., B. C. Hazen and R. L. MacIntyre. 1996. The Land-Use Change and Analysis System (LUCAS) for Evaluating Landscape Management Decisions. IEEE Computational Science & Engineering 3(1): 24-35. https://pdfs.semanticscholar.org/d6fb/35760721aef65242bd377b27982bea3cc644.pdf (7 de julio de 2018). [ Links ]
Campbell, J. B. 2007. Introduction to Remote Sensing. Guilford Press. New York, NY, USA. 626 p. [ Links ]
Challenger, A. y J. Soberón. 2008. Los ecosistemas terrestres. In: Soberón, J., G. Halffter y J. Llorente-Bousquets (comps.). Capital Natural de México, Vol. 1: Conocimiento actual de la biodiversidad. Conabio. México, D.F., México. pp. 87-108. [ Links ]
Chávez, P. S. 1996. Image-based atmospheric corrections-revisited and improved. Photogrammetric Engineering and Remote Sensing 62(9): 1025-1036. http://www.unc.edu/courses/2008spring/geog/577/001/www/Chavez96-PERS.pdf/ (24 de septiembre de 2018). [ Links ]
Chuvieco, E. 1990. Teledetección Ambiental. La Observación de la Tierra desde el Espacio. Ed. Ariel Ciencia. Barcelona, España. 485 p. [ Links ]
Comisión Estatal del Agua (CEA). 2015. Ficha técnica hidrológica municipal Tomatlán. Comisión estatal del agua del Estado de Jalisco. https://www.ceajalisco.gob.mx/doc/fichas_hidrologicas/region11/tomatlan.pdf (18 de junio de 2018). [ Links ]
Congalton, R. G. 1988. A comparison of sampling scheme use in generating error matrices for assessing the accuracy of maps generated from remotely sensed data. Photogrammetric Engineering and Remote Sensing 54(5): 593-600. https://www.asprs.org/wpcontent/uploads/pers/1988journal/may/1988_may_593-600.pdf (9 de agosto de 2018). [ Links ]
Congalton, R. G. 1991. A review of assessing the accuracy of classifications of remotely sensed data. Remote Sensing of Environment 37(1):35-46. Doi: 10.1016/0034-4257(91)90048-B. [ Links ]
Camacho-Sanabria, R., J. M. Camacho-Sanabria, M. Á. Balderas-Plata y M. Sánchez-López. 2017. Cambios de cobertura y uso de suelo: estudio de caso en Progreso Hidalgo, Estado de México. Madera y Bosques 23 (3): 39-60. Doi: 10.21829/myb.2017.2331516. [ Links ]
Diario Oficial de la Federación (DOF). 2018. Reserva de aguas superficiales para los usos doméstico, público urbano y ambiental o para conservación ecológica. http://dof.gob.mx/nota_detalle.php?codigo=5525357&fecha=06/06/2018 (6 de junio de 2018). [ Links ]
Dirzo, R. and M. C. García. 1992. Rates of Deforestation in Los Tuxtlas, a Neotropical Area in the Southeast México. Conservation Biology (6):84-90. Doi:10.1046/j.1523-1739.1992.610084.x. [ Links ]
García, T. J. y J. F. Mas. 2008. Comparación de metodologías para el mapeo de la cobertura y uso del suelo en el Sureste de México. Investigaciones Geográficas, Boletín del Instituto de Geografía, UNAM (67):7:19. http://www.scielo.org.mx/scielo.php?script=sci_arttext&pid=S0188-46112008000300002&lng=es&nrm=iso (13 de julio de 2018). [ Links ]
Gaspari, F. J. 2002. Ordenamiento territorial en cuencas serranas. Aplicación de Sistemas de Información Geográfica (S.I.G.). Ediciones Cooperativas. Huelvea, España. 147 p. [ Links ]
Gonzaga A., C. 2014. Aplicación de índices de Vegetación derivados de Imágenes Satelitales Landsat 7 ETM+ y ASTER para la caracterización de la Cobertura Vegetal en la Zona Centro de la Provincia De Loja, Ecuador. Tesis de maestría. Facultad de Ingeniería y Facultad de Ciencias Astronómicas y Geofísicas de la Universidad Nacional de La Plata. La Plata, Argentina. 103 p. [ Links ]
Instituto Nacional de Estadística y Geografía (Inegi). 2008. Carta Actual de Uso y Vegetación. Serie IV. México: Instituto Nacional de Estadística Geografía e Informática. https://www.inegi.org.mx/app/mapas/ (8 de octubre de 2018). [ Links ]
Instituto Nacional de Estadística y Geografía (Inegi). 2009. Prontuario de información geográfica municipal de los Estados Unidos Mexicanos, Tomatlán, Jalisco. http://www3.inegi.org.mx/contenidos/app/mexicocifras/datos_geograficos/14/14100.pdf (8 de octubre de 2018). [ Links ]
Jensen, J. 1996. Introductory Digital Image Processing: A Remote Sensing Perspective. Prentice-Hall. Upper Saddle River, NJ, USA. 526 p. [ Links ]
Lesschen, J. P., P. H. Verburg and S. J. Staal. 2005. Statistical methods for analysing the spatial dimension of change: Land use and farming systems. LUCC Report Series Num. 7. Land-Use and Land-Cover Change (LUCC) Project. The International Livestock Research Institute, Nairobi, Kenya and Wageningen University Netherlands. Nairobi, Kenya. 81 p. [ Links ]
Lira, J. 2010. Tratamiento digital de imágenes multiespectrales. Universidad Nacional Autónoma de México. México, D.F., México. 584 p. [ Links ]
Maussel P., J. Kramber and J. Lee. 1990. Optimum band selection for supervised classifiation of multispectral data. Photogrammetric Engineering and Remote Sensing 56(1):55-60. https://www.asprs.org/wp-content/uploads/pers/1990journal/jan/1990_jan_55-60.pdf . (9 de septiembre de 2018). [ Links ]
Mendoza, E. and R. Dirzo. 1999. Deforestation in Lacandonia (southeast México): evidence for the declaration of the northernmost tropical hot-spot. Biodiversity and Conservation 8(12):1621-1641. Doi: 10.1023/A:1008916304504. [ Links ]
Morales H., J. C. 2014. Evaluación del impacto de los fenómenos hidrometeorológicos de la cobertura vegetal de la Región de Bahía de Banderas, Nayarit-Jalisco, México. Tesis de Doctorado. Universidad de Guadalajara. Puerto Vallarta, Jal., México. 75 p. [ Links ]
Ochoa-Gaona, S. and M. González-Espinosa. 2000. Land use and deforestation in the highlands of Chiapas, México. Applied Geography 20(1):17-42. Doi: 10.1016/S0143-6228(99)00017-X. [ Links ]
Organización de las Naciones Unidas para la Alimentación y la agricultura (FAO). 1996. Forest resources assessment 1990. Survey of tropical forest cover and study of change processes. Rome, Italy. 152 p. [ Links ]
Pontius, R., E. Shusas and M. McEachern. 2004. Detecting important categorical land changes while accounting for persistence. Agriculture, Ecosystems & Environment 101(2-3):251-268. Doi:10.1016/j.agee.2003.09.008. [ Links ]
Trejo, I. and R. Dirzo. 2000. Deforestation of seasonally dry tropical forest: a national and local analysis in Mexico. Biological Conservation 94(2):133-142. Doi: 10.1016/S0006-3207(99)00188-3. [ Links ]
Valdez, J., C. Aguirre y G. Ángeles. 2011. Análisis de los cambios en el uso del suelo en la Cuenca del Río Metztitlán (México) usando imágenes de satélite: 1985-2007. Revista Chapingo Serie Ciencias Forestales y del Ambiente 17(3):313-324. Doi:10.5154/r.rchscfa.2010.06.041. [ Links ]
Vargas G., E. 1992. Análisis y clasificación del uso y cobertura de la tierra con interpretación de imágenes. Ed. IGAC. Santa Fé de Bogotá, Colombia. 113 p. [ Links ]
Received: June 29, 2019; Accepted: November 18, 2019
 Este es un artículo publicado en acceso abierto bajo una licencia
Creative Commons
Este es un artículo publicado en acceso abierto bajo una licencia
Creative Commons
