


Serviços Personalizados
Journal
Artigo
 texto em
  Inglês (pdf)
 Artigo em XML
 Referências do artigo
 Enviar este artigo por email
Indicadores
-
 Citado por SciELO
 -
 Acessos
Links relacionados
-
 Similares em
SciELO
Similares em
SciELO
Compartilhar

 Permalink
Revista mexicana de ciencias forestales
versão impressa ISSN 2007-1132
Rev. mex. de cienc. forestales vol.11 no.57 México Jan./Fev. 2020 Epub 20-Jun-2020
https://doi.org/10.29298/rmcf.v11i57.645
Scientific article
Oversize assessment of dry and planed timber of the ejido Pueblo Nuevo, Durango
1Programa de Maestría en Ciencias en Desarrollo Forestal Sustentable. Tecnológico Nacional de México-Instituto Tecnológico de El Salto (ITES). México.
2Doctorado Institucional en Ciencias Agropecuarias y Forestales. Universidad Juárez del Estado de Durango. México.
3Instituto de Silvicultura e Industria de la Madera. Universidad Juárez del Estado de Durango. México.
4Facultad de Ciencias Forestales. Universidad Juárez del Estado de Durango. México.
Timber sawing accuracy varies depending on the working methods, the degree of maintenance and the precision of the sawing equipment, and therefore its implications in planed dry timber have not been documented. The objective of this work was to determine if the saw thickness of 7/8” (22.23 mm) guarantees the obtainment of dry and planed timber with a final size that coincides with the nominal one. A sample of 150 boards of the Pinus genus produced at the La Peña sawmill was monitored during the drying and planing processes in order to determine their sawing accuracy through statistical process control; the volume that did not reach the final nominal size was thus quantified. The total standard deviation (St) of the sawmilling process was found to be 0.85 mm, which is influenced by the fact that the saw cuts are not homogeneous within the boards, and it is difficult to obtain boards with adequate surface quality and dimensional accuracy in the planing process. The quality control procedures showed that 67.50% of the planed boards were within the limits of dimensional quality control (20.92 to 22.32 mm), and 15.83% were above the upper control limit, together representing 83.33% of the total volume with adequate final nominal dimension; while the remaining 16.67% did not reach the final nominal size in dry and planed timber because they were insufficiently thick. It is concluded that the sawing variation in this sawmill compromises up to 17% of the timber.
Key words Sawing quality; statistical process control; efficiency; timber; yield; sawing variation
La calidad dimensional de la madera aserrada es variable en función de los métodos de trabajo, el grado de mantenimiento y precisión de los equipos de asierre; además sus implicaciones en la madera seca y cepillada no se han documentado. El objetivo de este trabajo fue determinar, si el grueso de asierre de 7/8” (22.23 mm) garantiza obtener madera seca y cepillada con dimensión final coincidente a la nominal. A una muestra de 150 tablas de Pinus sp producidas en el aserradero La Peña, se le dio seguimiento durante los procesos de secado y cepillado para conocer la variación dimensional, mediante un control estadístico de procesos; con esos datos se cuantificó el volumen que no alcanzó la dimensión nominal final y se determinó que la desviación estándar total del proceso de aserrío (St) fue de 0.85 mm, en la cual influyó que los cortes de la sierra no son homogéneos dentro de las tablas, lo que dificulta obtener piezas con calidad de superficie y precisión dimensional adecuadas para el cepillado. El control de calidad evidenció que 67.50 % de las tablas cepilladas estuvieron dentro de los límites de control de calidad dimensional (20.92 a 22.32 mm); 15.83 % por encima del límite de control superior, y ambas representaron 83.33 % del volumen total con buena dimensión nominal final; mientras que 16.67 % no la tuvieron, ya que presentaron subdimensiones en grosor. Se concluye que la variación del corte en este aserradero compromete hasta 17 % de la materia prima.
Palabras clave Calidad de aserrío; control estadístico de procesos; eficiencia; madera aserrada; rendimiento; variación de corte
Introduction
Almost half of the volume of roundwood ends up being sawn, while the rest becomes waste and secondary products (Axelsson and Fredriksson, 2017).
Sawmilling is a high-speed process in which some degree of size variation is always generated in sawn wood. This is affected, primarily, by a combination of mechanical and human factors during the movement of the work piece, the vibration of the saw at the time of cutting, and the unrepeatability when sawing thicknesses are assigned (Vuorilehto, 2002; Maness et al., 2004). Controlling the thickness of the freshly sawn wood is most critical; therefore, it is important to use vibration-free equipment, saws in good conditions, and adequate feed rates (López et al., 2016).
Since more than 80 % of the production costs of sawmills are allotted to the purchase of raw materials, it is necessary to reduce waste (Hernández, 2016). For this purpose, the timber size control is essential to maximize quality, output, and productivity, as even a small reduction in the sawing thickness can generate significant savings in the use of raw materials (Okai et al., 2006). Otherwise, the company may be exposed to speculation in the price of the product as a consequence of its failure to meet the final size specifications (Wiedenbeck et al., 2016).
Timber drying a) improves its behavior in the adhesive junctions, the machining and the finish; b) it prevents or delays deterioration and attacks by pathogenic organisms, and c) it reduces its weight and increases its mechanical resistance (Mitchell, 2016).
In order to obtain pieces with a surface quality and size accuracy, the only factor to be considered in planing is the depth of the cut; for this purpose, only a minimal amount of volume is removed from the wood (Axelsson, 2014). This is very important, since a smooth surface favors the finish and increases the resistance of the junctions and gluing, as it allows a larger contact area (Kilic et al., 2006.
Due to the current economic pressures faced by the sawmill industry, the use of statistical control methods in the transformation processes as a strategy to detect cut variation issues and increase the competitiveness of the product appears to be an exception rather than a rule, since only a few, highly competitive sawmills in the world use them to maximize raw materials, minimize production costs, enhance the quality of the product, and locate issues in the sawing equipment (Maness et al., 2003; Young et al., 2007).
Sawmills of the El Salto forest region in Durango lack quality control systems specifically for sawn wood, and, therefore the size quality varies according to the working methods and to the degree of maintenance with which the sawing equipment is operated; this has effects on the dry, planed wood that have not yet been documented. The purpose of the present study was to determine the influence, at the drying and planing stages, of the size quality of a 7/8” (22.23 mm) thickness in the pine wood produced at the La Peña sawmill in Pueblo Nuevo ejido, Durango, based on the assumption that the thickness achieved during the sawing guarantees a good size quality and thus an optimal added value in the final products.
Materials and Methods
Description of the study area and the equipment
The study was performed in the municipality of Pueblo Nuevo, Durango, at the sawmill located in La Peña, within the Pueblo Nuevo ejido; while the drying and planing processes were carried out at the industrial complex of the same ejido located in the city of El Salto, Durango State.
The sawing equipment with which the boards were produced is a horizontal stationary band sawmill (BAKER BP DOMINATOR™ model 3650E) with a capacity for sawing logs with a diameter of up to 36 inches (91.44 cm) and a length of 20.5 feet (6.25 m). The cutter head consists of two 36 inches (91.44 cm) steel flywheels with a thin, 20 feet long × 1.5 inch wide × 0.042 inch thick (6.096 m × 3.81 cm × 1.06 mm), powered by a 50 HP TEFC three-phase electric engine. It is mounted on a steel frame by means of four poles that allow it to move up and down simultaneously, and its forward and backward movements are powered by water. The log feeding system is also hydraulic, and the automatic cut timer is computerized.
The drying chamber (Moore InternationalTM) is thermal and steam-based; it has six lines of heating coils, and its load capacity is of up to 50 000 feet of sawn boards. The furnace has a capacity for 10 000 liters of water supply, and the heater operates with firewood. The timber drying program is an approximation of T13-F5S (Bone et al., 1988).
The sawmill uses a WhitneyTM industrial planer with a 32 inch (81.18 cm) wide work table and a single, vertically moving head of up to 10 inches (25.4 cm), powered by a 30 HP engine, and a forward motion gear with a 16 HP engine that has the capacity to plane 8 linear feet (243.84 cm) in 35 seconds.
Selection of the sampling table
According to Brown (2000a), a sample of 50 to 150 boards is required in order to carry out the timber cut variation analysis and comply with the statistical requirements; thus, 15 sawn boards of Pinus wood were selected at random per day during 10 workdays in order to collect a sample of 150 boards with a nominal thickness of 7/8” (22.23 mm), a nominal width of 6 to 12 inches (15.24 to 30.48 cm), and a nominal length of 8 feet (243.84 cm).
The boards were identified with a progressive control number (from 1 to 150) written on one of its sides and edges, as a reference to facilitate its measurement at the same points during the drying and the planing. Table 1 shows the distribution of the sample boards by nominal width.
Determination of the variation of the sawmilling process
The sawing quality was assessed using the multiple-point measuring method suggested by Brown (2000a). 10 measurements were carried out per board: three on each edge and, equidistantly, along the board, in order to avoid points coinciding with knots, cracks or other defects not caused by the cut; three measurements in width and one in length were made. Based on these data, the total standard deviation (St) of the process -consisting of the deviation standard within (Sw) and between (Sb) the tables- was determined according to Brown (2000b), as follows:
The standard deviation within the tables was determined using Equation (1):
Where:
The variance of each board was estimated using the formula (2):
Where:
The standard deviation between boards was estimated using the Expressions (3):
Where:
The variance of the mean was estimated using the Equation (4):
Where:
The total standard deviation of the process or the sawing variation (St) was determined based on the known values for Sw and Sb, using the expression (5):
Where:
In order to determine the optimal cutting size, a series of reinforcements were added to the nominal size in order to attain a specified final size. These represent the volume that is lost due to the contractions of the wood during the drying, that which is removed during the planing, and that which is lost as an effect of the variation in thickness of the boards due to the cut when the logs are sawed.
The optimal sawing size of green, rough timber (Do) consists of the critical size, which considers only the reinforcements due to planing and contraction, and is complemented by the magnitude of the product between the minimum acceptable size factor and the standard deviation of the process, as shown in Equation (6):
Where:
The thickness of the timber that is lost due to planing ranges between 0.010 and 0.12 inches (0.254 mm to 3.048 mm) (Brown, 2000b). In the present study, 0.031 inches (0.79 mm) were planed per side. For the reinforcement due to contraction of the wood, the average registered value of the thickness of the boards, once dried to an 8 % moisture content, was 9.49 %, applying the following Equation (7) (Zavala, 1991):
Where:
Mean quality control charts
Mean quality control charts were drawn based on the top and bottom control limits, in order to determine the location of the average thickness of each board, within or without these limits during the sawing, drying and planing processes, according to the recommendation of Zavala (1991), Expressions (8) and (9):
Where:
Results
Variation of the cut in sawn wood
Table 2 shows that the standard deviation within the boards (Sw=9.70 mm) influenced the total standard deviation of the process (St=0.85 mm) more than the standard deviation between boards (Sb=0.49 mm).
Table 2 Magnitude of the sizes observed in 7/8” (22.23 mm) thick sawn wood at the La Peña sawmill in Pueblo Nuevo, Durango.
| Nominal thickness | Mean (mm) | Sw (mm) | Sb (mm) | St (mm) | Dc (mm) | Do (mm) |
|---|---|---|---|---|---|---|
| 7/8” (22.23 mm) | 25.54 | 0.70 | 0.49 | 0.85 | 25.59 | 26.99 |
Sw = Standard deviation within the boards; Sb= Standard deviation between boards; St= Total standard deviation of the process; Dc= Critical size; Do = Optimal cut size.
The greatest variability within boards (Sw) indicates that, during the sawing, the cuts along the boards are not homogeneous, which makes it difficult to obtain flat surfaces and a uniform thickness of the wood during the planing.
The estimated optimal cut size (Do) was 26.99 mm; this turned out to be 1.45 mm larger than the average thickness (25.54 mm) registered at the La Peña sawmill, which in turn was similar to the critical size (Dc) or critical thickness of the boards (25.59 mm). This confirmed that only reinforcements due to planing and to contraction of the wood after drying were found at the study site, but not the reinforcement to compensate for the cut variation.
Since the average sawing thickness and the Dc coincide, surely a significant proportion of the sawn boards will not have the final size in dry timber planed with a nominal thickness of 7/8” (22.23 mm); this will have a negative impact on the output of raw materials.
In theory, in order to achieve a confidence interval indicating that at least 95 % of the dry, planed sawn wood meets the expected final size of 7/8” (22.23 cm) at this sawmill, 1.45 mm must be added to the cut size of each board to match the Do. However, this condition may entail a risk, as it may increase the loss of raw materials, and therefore a larger amount of raw materials would be required to compensate for the variation in cuts. For this reason, it was recommend to use an adequate combination in the feed rate of the forward motion system and setting the marker so as to facilitate the obtainment of uniform thicknesses in each cut. Statistically, this will be reflected in the reduction of values of the deviations within the boards (Sw), as well as between boards (Sb).
Distribution of the thickness of the green timber
The variation of the average thickness in sawn boards recorded extreme values of 22.5 to 27.66 in green timber (Figure 1). The result of this situation was that only 98 of the 150 sample boards were within the estimated control limits of 24.88 to 26.20 mm; 26 boards surpassed the top control limit of (26.20 mm), leading to economic losses as they amount to 1.59 delivered board feet that were not charged to the customer due to oversizing; another 26 had a thickness below the bottom control limit (24.88 mm) involving a shortage of 3.41 board feet, and the undersized shipped product was therefore also rejected.
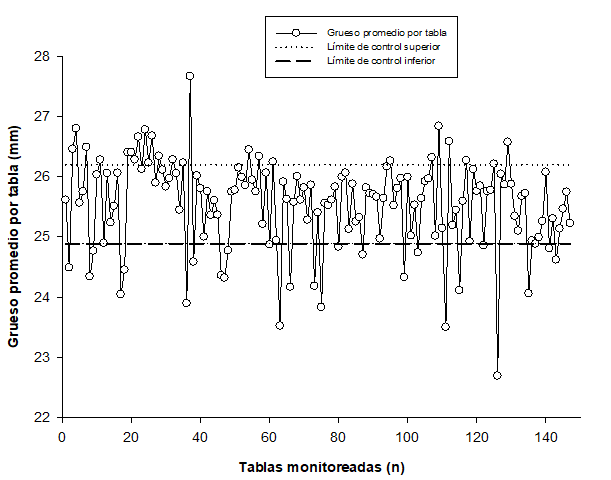
Grosor promedio por tabla = Mean thickness per board; Tablas monitoreadas = Monitored boards; Límite de control superior = Top control limit; Límite de control inferior = Bottom control limit.
Figure 1 Distribution of the thickness of the sawn boards.
This indicates that, of the total of sawn timber with the nominal thickness, only 66.23 % was registered within the size quality control limits; 17.27 % surpassed the top control limit, as the assigned reinforcement was higher than programmed, even taking into account the drying and the planing; together, these amount to 83.50 % of the total with a possibility of attaining the final goal size. The product that did not reach the bottom control limit (16.50 %) represented a potential economic loss in the sawing, drying and planing processes, since it is usually sold as belonging to a category below the programmed one (Table 3).
Table 3 Quantity in board feet and number of boards per nominal width within and outside the sawing quality control limits.
| Classification of the boards* | Nominal width in inches | |||||
|---|---|---|---|---|---|---|
| 6” | 8” | 10” | 12” | Total | % | |
| (15.24 cm) | (20.32 cm) | (25.40 cm) | (30.48 cm) | |||
| Number of boards above the top control limit (bf) | 34.58 | 58.91 | 46.29 | 20.40 | 160.18 | 17.27 |
| (8) | (10) | (6) | (2) | (26) | ||
| Number of boards within the control limits (bf) | 151.16 | 155.66 | 156.62 | 150.87 | 614.31 | 66.23 |
| (35) | (27) | (21) | (15) | (98) | ||
| Number of boards below the bottom control limit (bf) | 28.91 | 48.76 | 27.47 | 47.94 | 153.08 | 16.50 |
| (8) | (9) | (4) | (5) | (26) | ||
| Total number (bf) | 214.65 | 263.33 | 230.38 | 219.21 | 927.57 | 100 |
| (51) | (46) | (31) | (22) | (150) | ||
*The number of boards per nominal width appears between parentheses.
Distribution of the thickness of the green timber
Re-measurement of the boards after the drying process evidenced a slight increase in the number of boards that failed to attain the minimum size for reaching 7/8” (22.23 mm) after the planing. At this stage, 99 boards were located within the estimated quality control limits of 23.81 to 22.42 mm; 24 were above the top control limit, with an oversizing equivalent to 1.49 board feet, while 27 exhibited values below the bottom control limit, with a shortage of 3.48 board feet (Figure 2).
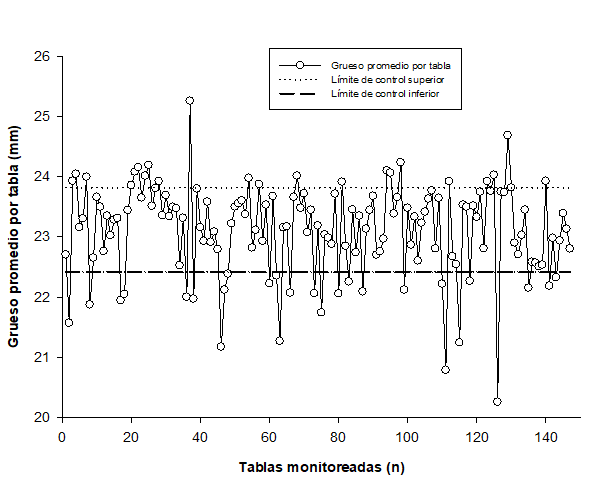
Grosor promedio por tabla = Mean thickness per board; Tablas monitoreadas = Monitored boards; Límite de control superior = Top control limit; Límite de control inferior = Bottom control limit.
Figure 2 Thickness of the boards after the drying.
In the case of dry timber with a moisture content of 8 %, 83.26 % of the boards were observed to reach the 7/8” (22.23 mm) in planed wood, while 16.74 % were below the lowest level of acceptability (Table 4).
Table 4 Quantity in board feet and number of boards per nominal width within and outside the control quality limits in the drying.
| Classification of the boards* | Nominal width in inches | |||||
|---|---|---|---|---|---|---|
| 6” | 8” | 10” | 12” | Total | % | |
| (15.24 cm) | (20.32 cm) | (25.40 cm) | (30.48 cm) | |||
| Number of boards above the top control limit (bf) | 19.55 | 58.87 | 36.88 | 26.43 | 141.73 | 16.88 |
| (5) | (11) | (5) | (3) | (24) | ||
| Number of boards within the control limits (bf) | 140.57 | 140.46 | 147.37 | 129.01 | 557.41 | 66.38 |
| (36) | (27) | (22) | (14) | (99) | ||
| Number of boards below the bottom control limit (bf) | 34.12 | 38.74 | 24.7 | 42.98 | 140.54 | 16.74 |
| (10) | (8) | (4) | (5) | (27) | ||
| Total number (bf) | 194.24 | 238.07 | 208.95 | 198.42 | 839.68 | 100 |
| (51) | (46) | (31) | (22) | (150) | ||
*The number of boards per nominal width appears between parentheses.
Distribution of the thickness of the planed wood
In the last re-measurement of the boards, after the planing, only 123 recorded the nominal size in dry, planed wood with a thickness of 7/8” (22.23 mm); of these, 23 had an excessive thickness equivalent to 1.44 board feet; while 27 boards had planing irregularities, as the planing did not cover the marks of the saw on the sides of the boards with the assigned cut depth, and the undersized boards were equivalent to a shortage of 3.46 board feet (Figure 3).
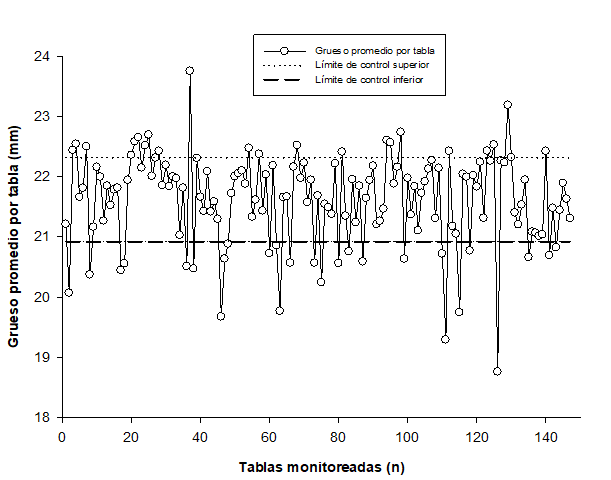
Grosor promedio por tabla = Mean thickness per board; Tablas monitoreadas = Monitored boards; Límite de control superior = Top control limit; Límite de control inferior = Bottom control limit.
Figure 3 Thickness of the boards after planing. This corresponds to an 83.33 % exploitation rate of raw materials and a 16.67 % underutilization (Table 5).
Table 5 Quantity in board feet and number of boards per nominal width within and outside the quality control limits for planing.
| Classification of the boards* | Nominal width in inches | |||||
|---|---|---|---|---|---|---|
| 6” | 8” | 10” | 12” | Total | % | |
| (15.24 cm) | (20.32 cm) | (25.40 cm) | (30.48 cm) | |||
| Number of boards above the top control limit (bf) | 18.35 | 55.2 | 34.59 | 16.18 | 141.73 | 15.83 |
| (5) | (11) | (5) | (2) | (23) | ||
| Number of boards within the control limits (bf) | 131.51 | 131.4 | 137.86 | 129.26 | 530.03 | 67.50 |
| (36) | (27) | (22) | (15) | (100) | ||
| Number of boards below the bottom control limit (bf) | 31.79 | 36.07 | 23.01 | 40.05 | 130.92 | 16.67 |
| (10) | (8) | (4) | (5) | (27) | ||
| Total number (bf) | 181.65 | 222.67 | 195.46 | 185.49 | 785.27 | 100 |
| (51) | (46) | (31) | (22) | (150) | ||
*The number of boards per nominal width appears between parentheses.
The tangential sawing carried out at the La Peña sawmill, which produces most of the boards with sapwood, causes more contraction during the drying; due to this and to the effect of the low size quality on the sawing thickness, some boards that are close to the size quality control limits fail to reach the goal size in dry, planed timber.
Discussion
Ambriz et al. (2018) cite a total standard deviation (St) of the sawing process close to zero when the final sawing thickness and the average cutting thickness are similar. This is considered to be desirable; however, if this deviation is equal to or above 1 mm, corrective actions are required in the process. Although in this study (St) did not attain a value of 1 mm, the estimated 0.85 mm in the variation of the sawing thickness amounted to 17 % of the loss of raw materials. Therefore, the application of corrective actions to the process in order to reduce this variation as much as possible are fully justified. This is endorsed by Kilborn (2002), according to whom, when the variation in the sawing cut exceeds 0.70 mm, it may be related to issues of alignment, maintenance and operation of the machines. For this reason, the variation in the precision in the cut of the saw must not exceed 0.40 mm (Williston, 1988).
For the standard deviation within boards, Smithies (1991) states a deviation of 0.35 mm as the standard in the best British sawmills. The value determined by the present study is twice as high and it shows that the biggest problem of variation of the cut in sawn wood at La Peña occurs within boards. In this regard, the author himself establishes that increasing the variation between boards is more difficult than improving the variation between boards, as there are many factors in the human-machine-saw interaction that, when incorrect, cause the saw to divert its course and affect the cut size; these include: correct tension of the saw, shape and movement of the teeth of the gullet, poor sharpening, uneven work, forward moving speed, alignment of the machine, type of wood, feed system, and resistance of the steel to deformation.
According to Thomsgard and Martínez (2007), the uneven sawing in the thickness of the boards is also due to the wear and deviations of the axes and the wheels of the log holder carts, as well as to that of the hubs of the axles that synchronize the forward and backward movement of the cart caused by the blows received by the angle cart when the logs are loaded or turned over. In the case of horizontal sawmills like the DOMINATOR® type, the damage is due to the upward and downward movement of the cutter head.
Because the La Peña sawmill has a virtually new equipment, no failures due to poor fitting, wear or poor alignment of the mobile parts have been found. Therefore, the problem is most probably related to the human factor, i.e. to lack of skill and mastery of the workers in the operation of the machine. However, it is important to identify the factors that cause the variation observed in the cutting of timber, in order to implement actions to reduce it.
In this regard, when assessing certain corrective actions to minimize the variations in cutting at three sawmills in the El Salto region in Durango, Nájera et al. (2012) determined that a reduction in the feed rate of the logs by the operator of the main saw diminished the variation in the timber cutting by 49 %.
Nájera et al. (2011) estimated the size quality of the 7/8” (22.23 mm) sawn wood at five vertical band sawmills in the sameregion, obtaining values of 1.30 to 1.73 m for the total standard deviation of the process (St), which are respectively 0.45 and 0.8 mm above the St estimated at La Peña, considering even the level of variation in the thickness of the freshly sawn boards; this is a clear indication of a poor size quality in the sawn wood produced in that region.
Conclusions
The total standard deviation of the sawing process (St) of 0.85 mm bespeaks the existence of a variation in the thickness of the timber whereby 17 % of the raw material per undersized and shipped product is compromised.
The problem detected in the undersized sawn timber is the variation in the cutting within the boards (Sw=0.70 mm), which makes it difficult to obtain pieces with an adequate surface quality and size precision during the planing.
Only 83.33 % of all the dry, planed wood attained a final thickness of 7/8” (22.23 mm).
It is important to establish actions tending to reduce the variation in the cutting in order to pinpoint and correct the factors that cause the variation in the thickness of the boards.
REFERENCES
Ambriz E., M. Y. Andrade T. y H. M. Sosa V. 2018. Rendimiento volumétrico e importancia del control de calidad de madera aserrada de Pinus spp. TECNOCIENCIA Chihuahua 12(1): 37-41. [ Links ]
Axelsson A. 2014. How planer settings affect timber properties. BioResources 9(4): 6432-6439. Doi: 10.15376/biores.9.4.6432-6439. [ Links ]
Axelsson, A. and M. Fredriksson. 2017. Potential for increasing volume yield by reducing planing allowance. Wood Material Science & Engineering 12(5): 301-306. Doi:10.1080/17480272.2016.1262448. [ Links ]
Boone, R. S., C. J. Kozlik, P. J. Bois and E. M. Wengert. 1988. Dry kiln schedules for commercial woods: temperate and tropical. Forest Products Laboratory. USDA Forest Service Gen. Tech. Rep. FPL-GTR-57. Madison, WI, USA. 158 p. [ Links ]
Brown T. D. 2000a. Lumber Size Control, Part 1: Measurement Methods. Oregon State University, Extension Service. Corvallis, OR, USA. 11 p. [ Links ]
Brown T. D. 2000b. Lumber Size Control, Part 2: Size Analysis Considerations. Oregon State University, Extension Service. Corvallis, OR, USA. 27 p. [ Links ]
Hernández G., A. 2016. Determinación de los costos del aserrío. Guía básica. Comisión Nacional Forestal-Programa de las Naciones Unidas para el Desarrollo-Fondo para el Medio Ambiente Mundial. México, D.F., México. 71 p. [ Links ]
Kilborn, K. A. 2002. Lumber recovery studies of Alaska sawmills, 1997 to 1999. General Technical Report PNW-GTR-544. USDA Forest Service, Pacific Northwest Research Station. Portland, OR, USA. 15 p. [ Links ]
Kilic, M., S. Hiziroglu and E. Burdurlu. 2006. Effect of machining on surface roughness of wood. Building and Environment, 41(8): 1074-1078. Doi:10.1016/j.buildenv.2005.05.008. [ Links ]
López, N., M. F. Yucta, K. Caraguay y R. Minga. 2016. La variabilidad dimensional y defectos de secado afectan rendimientos en procesos de cepillado de madera de Eucalyptus saligna. Bosque 37(1): 169-178. Doi:10.4067/S0717-92002016000100016. [ Links ]
Maness, T. C., R. A. Kozak and C. Staudhammer. 2003. Applying real-time statistical process control to manufacturing processes exhibiting between and within part size variability in the wood products industry. Quality Engineering 16(1): 113-125. Doi:10.1081/QEN-120020778. [ Links ]
Maness, T. C. , R. A. Kozak and C. Staudhammer. 2004. Reliability testing of statistical process control procedures for manufacturing with multiple sources of variation. Wood and Fiber Science 36(3): 443-458. [ Links ]
Mitchell, P. 2016. Modeling the cupping of lumber. BioResources 11(3): 6416-6425. Doi:10.15376/biores.11.3.6416-6425. [ Links ]
Nájera L., J. A., O. A. Aguirre C., E. J. Treviño G., J. Jiménez P., E. Jurado Y., J. J. Corral R. y B. Vargas L. 2011. Rendimiento volumétrico y calidad dimensional de la madera aserrada en aserraderos de El Salto, Durango. Revista Mexicana de Ciencias Forestales, 2(4): 75-89. Doi:10.29298/rmcf.v2i4.610. [ Links ]
Nájera L., J. A. , J. T. Montañez R., J. Méndez G., F. J. Hernández, B. Vargas L., F. Cruz C. y C. G. Aguirre C. 2012. Evaluación de acciones correctivas tendientes a mejorar la calidad dimensional de la madera aserrada de Pinus spp en Durango, México. Investigación y Ciencia de la Universidad Autónoma de Aguascalientes 54: 22-29. [ Links ]
Okai, R., S. J. Mitchual and K. Frimpong M. 2006. Optimisation techniques for minimising saw teeth deflection and lumber thickness variation. Precision Engineering, 30(1): 39-46. Doi:10.1016/j.precisioneng.2005.05.004. [ Links ]
Smithies, J. N. 1991. Sawmilling accuracy for bandsaws cutting British softwoods. Forestry Commission. HMSO publications. Bulletin 96. London, UK. 32 p. [ Links ]
Thomsgard, P. y R. Martínez. 2007. Guía para el mejoramiento del aserraje. Manual práctico. Proyecto BOLFOR II/CADEFOR. Primera edición. Imprenta El País. Santa Cruz de la Sierra, Bolivia. 32 p. [ Links ]
Vuorilehto, J. 2002. Quality yield capability of a breakdown sawing process. Forest Products Journal 52(4): 77-81. [ Links ]
Wiedenbeck, J., M. S. Scholl, P. R. Blankenhorn and C. D. Ray. 2016. Lumber volume and value recovery from small-diameter black cherry, sugar maple, and red oak logs. BioResources, 12(1): 853-870. Doi:10.15376/biores.12.1.853-870. [ Links ]
Williston, E. M. 1988. Lumber manufacturing, design & operation of sawmills & planer mills. Miller-Freeman Publications. San Francisco, CA, USA. 93 p. [ Links ]
Young, T. M., B. H. Bond and J. Wiedenbeck. 2007. Implementation of a real-time statistical process control system in hardwood sawmills. Forest Products Journal 57(9): 54-63. [ Links ]
Zavala Z., D. 2003. Efecto del sistema de aserrío tradicional en las características de la madera de encinos. Madera y Bosques 9(2): 29-39. Doi:10.21829/myb.2003.921284. [ Links ]
Zavala Z., D. 1991. Manual para el establecimiento de un sistema de control de la variación de refuerzos en madera aserrada. Serie de apoyo académico No. 44. Universidad Autónoma Chapingo. Chapingo, Texcoco, Edo de Méx., México. 50 p. [ Links ]
Received: August 27, 2019; Accepted: November 11, 2019
 Este es un artículo publicado en acceso abierto bajo una licencia Creative Commons
