


Servicios Personalizados
Revista
Articulo
 texto en
  Inglés (pdf)
 Artículo en XML
 Referencias del artículo
 Enviar artículo por email
Indicadores
-
 Citado por SciELO
 -
 Accesos
Links relacionados
-
 Similares en
SciELO
Similares en
SciELO
Compartir

 Permalink
Revista mexicana de ciencias forestales
versión impresa ISSN 2007-1132
Rev. mex. de cienc. forestales vol.10 no.55 México sep./oct. 2019 Epub 14-Feb-2020
https://doi.org/10.29298/rmcf.v10i55.548
Scientific article
Decomposition models of litter from oak and pine forests in Nuevo León State
1Facultad de Ciencias Forestales. Universidad Autónoma de Nuevo León. México
2Facultad de Economía. Universidad Autónoma de Nuevo León. México
The decomposition of leaf litter is important to understand the functioning and productivity of ecosystems because it determines the recycling of nutrients. In the study described here, the degradation of leaf litter during 510 days in three forest communities was evaluated: the oak forest (BE), the pine-oak forest BPE) and the pine forest (BP) in the Iturbide municipality, Nuevo León. In each site five plots of 20 m x 20 m were marked in which 110 bags with 5 g of litter were placed in order to calculate their degradation rate. The results indicate that the degradation was 27 % for BE; 23 % for BPE and 17 % for BP, respectively. A regression analysis was performed for degradation in the sampling period, in which the simple negative exponential model was the one that best fit presented for the three study sites. The degradation rate for 99 % of cases was determined in 17, 22 and 29 years for BE, BPE and BP, respectively. The greatest degradation was recorded in the oak forest, suggesting that the quality of the plant material influences the process.
Key words Regression analysis; litter decomposition; organic matter; pine-oak; decay percentage; decomposition rate
La descomposición de la hojarasca es importante para entender el funcionamiento y la productividad de los ecosistemas, porque determina el reciclaje de nutrimentos. En el estudio que aquí se describe se evaluó la degradación de la hojarasca durante 510 días en tres comunidades forestales: el bosque de encino (BE), el bosque de pino-encino BPE) y el bosque de pino (BP) en el municipio Iturbide, Nuevo León. En cada sitio se marcaron cinco parcelas de 20 m × 20 m en las que se colocaron 110 bolsas con 5 g de hojarasca, con el propósito de calcular su velocidad de degradación. Los resultados indican que la degradación fue de 27 % para BE; de 23 % para BPE y de 17 % para BP. Se realizó un análisis de regresión para la degradación en el periodo de muestreo, en el cual el modelo exponencial negativo simple fue el que mejor ajuste presentó para los tres sitios de estudio. La tasa de degradación para 99 % de los casos se determinó en 17, 22 y 29 años para BE, BPE y BP, respectivamente. En el bosque de encino se registró la mayor degradación, lo que sugiere que la calidad del material vegetal influye en el proceso.
Palabras clave Análisis de regresión; degradación de hojarasca; materia orgánica; pino-encino; porcentaje de degradación; tasa de degradación
Introduction
In the context of ecosystem dynamics, litter production and decomposition are the main processes of nutrients and organic matter transfer to the soil, which are carried out by primary producers through the contribution of plant material to the ground (Ovington, 1962; López et al., 2013).
Primary production, nutrient cycle and soil fertility are greatly regulated by the decomposition of leaf litter (Wang et al., 2008). Likewise, if the decomposition is very slow, the nutrients available for the plants are insufficient, which limits their growth and development (Bubb et al., 1998; Montagnini and Jordan, 2002). In contrast, if nutrients are rapidly released, they can be lost by volatilization and edaphic leaching (Palma et al., 1998).
The functioning of the biogeochemical cycles favors the optimal physical, chemical and biological conditions of the soil by the release of nutrients and decomposition of litter (León et al., 2008).
The combined effect of rainfall and temperature are important factors that determine the rate of plant decomposition, so in dry periods, this transformation becomes slower. Likewise, the climatic variables of the soil such as humidity and temperature are widely related to the rate of decomposition (Gallardo and Pino, 1988).
The decomposition of leaf litter is divided in four stages: crushing, which is the fragmentation of tissues; leaching, which is the loss of the most soluble compounds by water flows; catabolism (mineralization and humification is included), which is the transformation that microorganisms make of organic compounds, that is, they transform nutrients so that they are available to plants; and humification, which is the formation of organic matter by microorganisms (Álvarez, 2001). The nutrient cycle and the decomposition of leaf litter are complex processes that are divided into three steps: decomposition, mineralization and humification (Sánchez et al., 2008; Mishra and Kumar, 2016).
Based on the above, the objective of the present study was to determine the speed of decomposition through different models for 510 days, under the hypothesis that decomposition is faster in the oak forest.
Materials and Methods
Study area
The research was carried out at the Forest School Ecological Campus of the Universidad Autónoma de Nuevo León (UANL), in the Iturbide municipality, Nuevo León, which is located between 24°42´28” N and 99°51´43” W, at 1 600 m high (Figure 1). Pine-oak forests are the predominant vegetation type; soils are Leptosol (35.5 %), Calcisol (2.8 %) and Kastanozem (1.7 %). The average annual temperature is 14 °C and the average annual rainfall, 635 mm (Inegi, 2009).

Environmental variables
Relative humidity (%), air temperature (°C) and soil temperature (°C) at 5 cm deep were recorded using the HOBO automated sensors every hour; rainfall (mm) was recorded by event.
Leaf litter decomposition and collection frequency
The litter bag method (Bocock and Gilbert, 1957) was used; 5 g of freshly fallen litter were collected, which were dried in the open and deposited in 25 cm x 20 cm bags of 1 mm nylon mesh fabric. This opening allows access inside the bags to certain invertebrate detritivorous, but minimizes fragmentation losses (Douce and Crossley, 1982). Due to the effect of time, the difference in weight allows the decomposition of the collected material to be assessed.
In the study area, three conditions were selected by type of temperate forest vegetation: BE for the oak forest; BPE for the pine-oak and BP for the pine forest. The experiment began on December 15th, 2016 and ended on May 9th, 2018.
A homogeneous mixture of litter components (leaves, branches, reproductive structures and other litter components) were deposited in each bag. A total of 110 bags were placed in five experimental plots (20 m × 20 m) per study site, at a rate of 22 bags per plot distributed at random. Each of them settled on the floor surface that was previously cleaned so that the bags were in contact with the substrate.
Litter decomposition was assessed on 12 dates, collecting all the material from two bags per experimental plot every 0, 15, 30, 60, 90, 150, 210, 270, 330, 390, 450 and 510 days, which were they took to the Chemistry Laboratory of the School of Forest Sciences of the UANL, where they were dried at 65 °C in a Felisa oven, model FE-292AD, until they reached a constant weight. With these data, the percentage of weight loss was calculated.
The decomposition rate was determined through Olsons’s (1963) Negative Exponential Simple Model:
Where:
k = Decompositon constant (year-1)
X = Litter mass in a specific time (g)
X0 = Initial litter mass (g)
t = Time expressed in years (years)
The necessary time to decompose 50 and 99% of litter was calculated with the following equations (Olson, 1963):
For decomposition at 50% the following formula was used:
For decomposition at 99% the following formula was used:
Statistical analyses
An analysis of variance was applied to the leaf litter decomposition data; To verify the assumptions of homogeneity of variances, the Kolmogorov-Smirnov and Shapiro Wilk tests (Steel and Torrie, 1980) were used. The non-parametric Kruskal-Wallis test (Ott, 1993) was used because the data did not show normal distribution.
To determine the leaf litter decomposition rate, four models were used: the Simple Negative Exponential proposed by Olson (1963) and three based on the recommendations of Moreno et al. (2018); the root of the mean square error (RECM) and the Pearson Correlation Coefficient were selected, based on the fit of the models and the coefficient of determination (R2).
Statistical analyzes were done with the Statistical Package for the Social Sciences (SPSS, 2016) version 22.0 for Windows.
Results and Discussion
Environmental Variables
Figure 2 shows the mean air temperature, the mean soil temperature and the mean relative humidity, as well as the monthly precipitation recorded during the study period. Rainfall was 719 mm in 2017 and 184 mm at the end of the experiment, with maximum peaks in September and November, with a total of 903 mm. The air temperature ranged from 14 to 23 °C and there was no frost, while the relative humidity was 48 to 85 %. The soil temperature followed the same trend as the environmental one, with variations from 12 to 20 °C.

Litter decomposition
A phase of slow decomposition from day 15 to 90 and greater decomposition until day 510 is observed (Figure 3); the tendency of the process in the three types of forest remains constant. As the time of the test lasted, the loss of biomass increased. At the end of the essay (510 days after it started), decomposition was 27 % for the oak forest, 23 % for pine-oak forest and 17 % for pine forest. According to the Kruskal-Wallis test, the values did not show significant differences on days 0, 15 and 450.
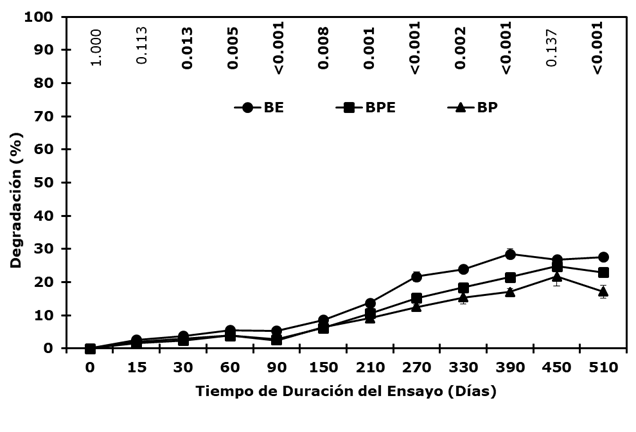
Be = Oak Forest; BPE = Pine-Oak Forest; BE = Oak Forest.
The p-value of the Kruskal-Wallis test to detect differences between forest types at each time of the trial is shown in the graph. Probabilities in bold (upper part) indicate significant differences.
Figure 3 Leaf litter decomposition (%) of the three types of forests in northeastern Mexico. Each value plotted represents the mean (n = 10 ± standard error).
When evaluating the loss of biomass in a temperate forest for one year in two locations in El Salto, Durango, Moreno et al. (2018) calculated decomposition rates of 31 % and 35 %. Likewise, López et al. (2018) reported that in the first 30 and 150 days the greatest loss of biomass of Pinus cooperi C. E. Blanco occured in plots with different intensities of thinning in El Salto, Durango; while Rocha and Ramírez (2009), obtained decomposition results that vary from 34 to 52 % and found no significant differences, for pine-oak forest in Chiapas, Mexico.
Sierra et al. (2009) mention that the initial phase of decomposition presents a more pronounced curve in the loss of biomass and, in the end, the slope is significantly reduced, which means that the slow decomposition of leaf litter is controlled by environmental factors and by litter quality (chemical composition of litter, variables not analyzed in the present study). Ibarra et al. (2011) indicate that the decomposition behavior is due to the fact that all the components of the litter are used, including those of rapid decomposition (leaves and reproductive structures) and those of slow decomposition (twigs and bark).
It also influences the nature of the litter, the C / N ratio of the litter, as well as the content of lignin and tannins, the greater the degree of lignification of the needle the longer the decomposition time.
Dry pine needles have a high lignin content (25.93-30.05 %) (Díaz et al., 2007) and tannins (0.07-0.12 %), precursors of humic substances in organic matter, high C / N ratio (around to 150), also have a low Ca (39.5-54.3 %) and Mg (10.8-18.8 %) content (Bernabé et al., 2013).
Decomposition models
In order to assess decomposition, linear, potential and exponential mathematical models, among which is the Negative Exponential Simple Model by Olson (1963), as well as some other evaluated by Moreno et al. (2018).
The models that were used in the actual research study were:
*Model 1: H(t)= β0 * exp-β1* t By Olson (1963)
*Model 2: H(t)= β0 + β1 (t)
*Model 3: ln H(t)= β0 + β1 ln (t)
*Model 4: H(t)= β0 * tβ1
Where:
H= Part of the remaining litter in t years
t= Time expressed in years.
β0 = Initial weight percentage
β1 = Relative decomposition rate
*Proposed by Moreno et al. (2018).
Table 1 shows the models obtained for the three experimental sites; it shows that the values of the determination coefficient varied from 0.766 to 0.899 and are similar to those recorded by Moreno et al. (2018) with 0.965 to 0.969, as well as those of Del Valle (2003) with 0.966, as well as those of Ibarra et al. (2011) with 0.946 and Martínez et al. (2007) with 0.698 to 0.821. For this reason, the Negative Simple Exponential Model (1) is the best fit according to the determination coefficient and the Pearson correlation coefficient for the three types of forests.
The correlation coefficient was distributed in a range between 0.875 and 0.948 for the model (1). It can be seen that the Negative Simple Exponential Model is the best fit based on the highest value of the Pearson determination coefficient and correlation coefficient, as well as the lowest RECM for the three types of forest.
Table 1 Regression models adjusted for the estimation of the remaining litter fraction during the study period for the three types of forests.
| Site | Model | Coefficients | Confidence ranges | Statisticals | ||||
|---|---|---|---|---|---|---|---|---|
| β0 | β1 | Lower
limit β0 |
Upper
limit β1 |
R2 | RECM | Pearson coefficient |
||
| 1 | 1 | 0.886 | 0.302 | 0.280 | 0.897 | 0.891 | 0.035 | 0.944 |
| 2 | 1 | 0.890 | 0.244 | 0.227 | 0.899 | 0.899 | 0.028 | 0.948 |
| 3 | 1 | 0.894 | 0.184 | 0.163 | 0.906 | 0.766 | 0.035 | 0.875 |
| 1 | 2 | 0.877 | -0.218 | -0.233 | 0.888 | 0.882 | 0.036 | 0.939 |
| 2 | 2 | 0.884 | -0.184 | -0.196 | 0.892 | 0.897 | 0.029 | 0.947 |
| 3 | 2 | 0.891 | -0.146 | -0.162 | 0.902 | 0.765 | 0.036 | 0.875 |
| 1 | 3 | -0.410 | -0.110 | -0.097 | -0.428 | 0.737 | 0.074 | 0.859 |
| 2 | 3 | -0.351 | -0.090 | -0.078 | -0.367 | 0.718 | 0.063 | 0.847 |
| 3 | 3 | -0.286 | -0.066 | -0.054 | -0.302 | 0.577 | 0.063 | 0.760 |
| 1 | 4 | 0.673 | -0.100 | -0.108 | 0.693 | 0.733 | 0.054 | 0.856 |
| 2 | 4 | 0.710 | -0.082 | -0.089 | 0.722 | 0.716 | 0.047 | 0.846 |
| 3 | 4 | 0.757 | -0.061 | -0.074 | 0.767 | 0.613 | 0.046 | 0.782 |
Site 1 = Oak forest; Site 2 = Pine-oak forest and Site 3 = Oak forest; β0, β1 = Coefficients of the model; R2 = determination coefficient; RECM = Root of the mean square error.
Litter decomposition rate
Table 2 shows the different values of k, which corresponds to the decomposition rate in the three types of forest: for BE -0.259, for BPE -0.209 and for BP -0.158. The time required for decomposition at 50 and 99 % was 2.67 to 17.74 years for BE and 4.38 to 29.11 years for BP. The decomposition rate mentioned by Moreno et al. (2018) in Durango was from -0.424 to -0.425, during a year of study in a temperate forest and the time required for decomposition was 1.6 (50 %) to 10.8 years (99 %).
Table 2 Decomposition rate (k) to process 50 and 99% of the litter represented in years in the three types of forest.
| Site | k | t0.5 | t0.99 | |
|---|---|---|---|---|
| BE | -0.259 | 2.67 | 17.76 | |
| BPE | -0.209 | 3.32 | 22.05 | |
| BP | -0.158 | 4.39 | 29.15 |
The prediction of leaf litter decomposition (Figure 4) indicates the distribution of data (relative weight of leaf litter) and the prediction of values for each type of forest (Olson model), during the time of the test. It is possible to notice the dispersion of the data in each type of forest and the prediction that the data should have during the experiment, according to the referred model.

Conclusions
The decomposition of leaf litter in the three types of forest was different during the study period, of which the best results were recorded in the oak; therefore, it is assumed that the quality of said organic material influences the process.
The four models used were good fit (determination coefficient, root mean square error and Pearson correlation coefficient), for the oak and pine-oak forests; but, the opposite was verified for the pine forest, in which the coefficient of determination was lower with respect to the other two types of forest. In this sense, the Negative Simple Exponential Model had the best statistical adjustment and a strong correlation of the Pearson coefficient.
The results of 50 % litter decomposition rate suggest that the process is slower in the pine forest compared to the pine-oak and oak forest, with an approximate difference of one year, which is attributed to the presence of needles.
Acknowledgements
The authors wish to express their gratitude to the Consejo Nacional de Ciencia y Tecnología (Conacyt), for the funding of the projet number 250732 to carry out the actual research and for the support provided to accomplish the doctoral studies of the first author.
REFERENCES
Álvarez S., J. 2001. Descomposición y ciclo de nutrientes en ecosistemas terrestres de México. Acta Zoológica Mexicana 1: 11-27. [ Links ]
Bernabé S., R., L. Ávila C. E. A. y J. G. Rutiaga Q . 2013. Componentes químicos de la madera de cinco especies de pino del municipio de Morelia, Michoacán. Madera y Bosques. 19(2):21-35. doi: 10.21829/myb.2013.192338. [ Links ]
Bocock, K. L. and O. J. W. Gilbert. 1957. The disappearance of leaf litter under different woodland conditions. Plant and Soil. 9:179-185. doi:10.1007/BF01398924. [ Links ]
Bubb, K. A., Z. H. Xu, J. A. Simpson and P. G. Safigna. 1998. Some nutrient dynamics associated with litterfall and litter decomposition in hoop pine plantations of southeast Queensland, Australia. Forest Ecology and Management 110:343-352. doi: 10.1016/S0378-1127(98)00295-3. [ Links ]
Del Valle A., J. I. 2003. Descomposición de la hojarasca fina en bosques pantanosos del pacífico colombiano. Interciencia 28(3):148-153. [ Links ]
Díaz A., S., M. Alessandrini D. y A. Herrera G. 2007. Comportamiento del follaje de Pinus caribaea var. caribaea y Pinus tropicalis en el desarrollo de una metodología para la obtención de cera conífera, pasta clorofila-caroteno y residuo forrajero a escala de banco. Revista Cubana de Química 19(1):81-83. [ Links ]
Douce, G. K. and D. A. Crossley Jr. 1982. The effect of soil fauna on litter mass loss and nutrient dynamics in arctic tundra at Barrow, Alaska. Ecology 63(2):523-537. doi: 10.2307/1938968. [ Links ]
Gallardo, A. y J. Pino. 1988. Importancia del medio físico en la descomposición de la hoja de especies arbóreas. Lagascalia 15:541-547. [ Links ]
Ibarra, M., J. Caldentey y A. Promis. 2011. Descomposición de hojarasca en rodales de Nothofagus pumilio de la región de Magallanes. Bosque 32(3):227-233. doi: 10.4067/S0717-92002011000300004. [ Links ]
Instituto Nacional de Estadística y Geografía (INEGI). 2009. Prontuario de información geográfica municipal de los Estados Unidos Mexicanos. Iturbide, Nuevo León. Clave geoestadística 19030. Aguascalientes, Ags., México. 9 p. [ Links ]
León, J. D., M. C. Díez, J. Castellanos, L. F. Osorio y N. Marín. 2008. Grupos funcionales de microorganismos en suelos degradados por minería de aluvión plantados con Acacia mangium. Suelos Ecuatoriales 38(1):75-80. [ Links ]
López H., J. M., H. González R., R. G. Ramírez L., I. Cantú S., M. V. Gómez M., M. Pando M. y A. E. Estrada C. 2013. Producción de hojarasca y retorno potencial de nutrientes en tres sitios del estado de Nuevo León, México. Polibotánica 35:41-64. [ Links ]
López H., J. M, J. J. Corral R., H. González R., T. G. Domínguez G., M. V. Gómez M. y I. Cantú S. 2018. Depósito y descomposición de hojarasca de Pinus cooperi C. E. Blanco en El Salto, Durango, México. Revista Mexicana de Ciencias Forestales. 9(50):201-222. doi: 10.29298/rmcf.v9i50.249. [ Links ]
Martínez Y., A., S. Núñez and A. Búrquez. 2007. Leaf litter decomposition in a southern Sonoran Desert ecosystem, northwestern Mexico: Effects of habitat and litter quality. Acta Oecologica. 32:291-300. doi: 10.1016/j.actao.2007.05.010. [ Links ]
Mishra, G. and R. Kumar. 2016. Plant litter decomposition: drivers insight to the ecological process. European Journal of Biological Research. 6(3): 176-185. doi: 10.5281/zenodo.58752 [ Links ]
Montagnini, F. y C. F. Jordan. 2002. Reciclaje de nutrientes. In: Guariguata, M. R. y G. Kattan. (Eds.) Ecología y Conservación de Bosques Neotropicales. Editorial Tecnológica. Cartago, Costa Rica. pp. 167-191. [ Links ]
Moreno V., M. E., T. G. Domínguez G., M. S. Alvarado, J. G. Colín, S. Corral R. y H. González R. 2018. Aporte y descomposición de hojarasca en bosques templados de la región de El Salto, Durango. Revista Mexicana de Ciencias Forestales 9(47):70-93. doi:10.29298/rmcf.v9i47.180. [ Links ]
Olson, J. S. 1963. Energy storage and the balance of producers and decomposers in ecological systems. Ecology. 44:322-331. doi:10.2307/1932179. [ Links ]
Ott, L. 1993. An introduction to statistical methods and data analysis. Duxbury Press. Boston, MA USA. 775 p. [ Links ]
Ovington, J. D. 1962. Quantitative ecology and the woodland ecosystem concept. Advances in Ecological Research. 1:103-192. [ Links ]
Palma, R. M., J. Prause, A. V. Fontanive and M. P. Jiménez. 1998. Litter fall and litter decomposition in a forest of the Parque Chaqueño Argentino. Forest Ecology and Management 106(2-3):205-210. doi:10.1016/S0378-1127(97)00312-5. [ Links ]
Rocha L., A. G. y N. Ramírez M. 2009. Producción y descomposición de hojarasca en diferentes condiciones sucesionales del bosque de pino-encino en Chiapas, México. Boletín de la Sociedad Botánica de México. 84:1-12. doi: 10.17129/botsci.2287. [ Links ]
Sánchez, S., G. Crespo, M. Hernández y Y. García 2008. Factores bióticos y abióticos que influyen en la descomposición de la hojarasca en pastizales. Pastos y Forrajes. 31(2): 99-118. [ Links ]
Sierra R., O., J. E. Mancera P. y A. Santos M. 2009. Velocidad de descomposición de la hojarasca en diferentes sustratos de manglar durante la época de lluvias en San Andrés Isla, Caribe Colombiano. Boletín de Investigaciones Marinas y Costeras. 38(1):59-84. [ Links ]
Statistical Package for the Social Sciences (SPSS). 2016. SPSS Statistics. Standard released (Version 22). For Windows. SPSS Inc. Chicago, IL, USA. n/p. [ Links ]
Steel, R. G. D. and J. H. Torrie. 1980. Principles and procedures of statistics. A biometrical approach. McGraw-Hill Book Company. New York, NY, USA. 633 p. [ Links ]
Wang, Q., S. Wang and Y. Huang. 2008. Comparisons of litter fall, litter decomposition and nutrient return in a monoculture Cunninghamia lanceolata and a mixed stand in southern China. Forest Ecology and Management 255:1210-1218. doi:10.1016/j.foreco.2007.10.026. [ Links ]
Received: March 22, 2019; Accepted: August 06, 2019
 Este es un artículo publicado en acceso abierto bajo una licencia
Creative Commons
Este es un artículo publicado en acceso abierto bajo una licencia
Creative Commons
