


Servicios Personalizados
Revista
Articulo
 texto en
  Inglés (pdf)
 Artículo en XML
 Referencias del artículo
 Enviar artículo por email
Indicadores
-
 Citado por SciELO
 -
 Accesos
Links relacionados
-
 Similares en
SciELO
Similares en
SciELO
Compartir

 Permalink
Revista mexicana de ciencias forestales
versión impresa ISSN 2007-1132
Rev. mex. de cienc. forestales vol.10 no.54 México jul./ago. 2019
https://doi.org/10.29298/rmcf.v10i54.590
Articles
Distribution and spatial correlation of tree species along an altitudinal gradient in the Selva Lacandona, Chiapas
1Posgrado en Ciencias Forestales, Colegio de Postgraduados, Campus Montecillo, México.
2Facultad Maya de Estudios Agropecuarios, Universidad Autónoma de Chiapas, México.
3Laboratorio de Etnobotánica Ecológica, Jardín Botánico, Instituto de Biología, Universidad Nacional Autónoma de México, México.
In this paper the distribution and spatial correlation patterns of tree species
along an altitudinal gradient in the Metzabok Protected Natural
Area (PNA) in the Selva Lacandona, Chiapas State was analyzed.
A 20 × 50 m sampling unit (SU) was installed in each altitudinal strata (AS),
and divided into 10 sampling subunits (SSU) of 10 x 10 m targeting pole-sized
trees. Within each SSU, one 5 × 5 m plot was installed to register the saplings,
and within this, another two 2 × 2 m plots were established for the sampling of
seedlings. The spatial distribution of pole-sized trees, saplings and seedlings
was analyzed with the Morisita-Horn index; whereas the distribution and spatial
correlation of pole-sized trees by height categories (lower, middle and higher)
and AS was evaluated using Ripley’s univariate
K(t) and bivariate K
12
(t) functions. The mean spatial pattern of the
pole-sized class for the three height categories along the altitudinal gradient
was clumped (
Key words: Protected Natural Area of Metzabok; community dynamics; spatial ecology; Ripley´s K(t) function; Morisita-Horn index; distribution patterns
Se analizó el patrón de distribución y correlación espacial de las especies
arbóreas a lo largo de un gradiente altitudinal en el Área Natural Protegida
(ANP) Metzabok, Selva Lacandona, Chiapas. En cada estrato altitudinal (EA) se
instaló una unidad de muestreo de 20 × 50 m, que fue dividida en 10 subunidades
de muestreo (SUM) de 10 × 10 m, donde se registraron los fustales. En las SUM se
delimitó un cuadro de 5 × 5 m para el registro de latizales, y en su interior se
establecieron dos cuadros de 2 × 2 m para el reconocimiento de brinzales. La
distribución espacial de fustales, latizales y brinzales se analizó con el
índice de Morisita-Horn; mientras que, la distribución y
correlación espacial de los fustales por categorías de altura (inferior,
intermedia y superior) y EA se evaluó mediante la función univariada
K(t) y bivariada K
12
(t) de Ripley. El patrón espacial
promedio de la clase fustal para las tres categorías de altura a lo largo del
gradiente altitudinal fue agregado (
Palabras clave: Área Natural Protegida Metzabok; dinámica de comunidades; ecología espacial; función K(t) de Ripley; índice Morisita-Horn; patrones de distribución
Introduction
Spatial ecology offers a variety of tools to assess the degree of aggregation that make it possible to infer the scale of variation of the ecological parameters (Ver Hoef et al., 2018). In general, these tools are methods that break down the variability of a parameter, defining the analysis scales in terms of different radii of action in which the distance to the nearest neighbors is established (Dale and Fortin, 2014). All the methods determine and describe the spatial patters that allow assessing hypotheses regarding various ecological processes associated to the forest dynamics of an ecosystem (Rozas and Camarero, 2005; Martensen et al., 2017).
According to Condit et al. (2002), the analysis of the spatial pattern describes the horizontal distribution of the individuals in a community in quantitative terms and is essential for understanding how a group of species uses the resources in its surroundings. Hubbell (2001) cites three general distribution patterns: i) random, in which individuals are distributed haphazardly due to the environmental homogeneity, following a non-selective pattern; ii) uniform, occurring at certain distances as a result of negative interactions between individuals, and iii) aggregate, in which the individuals of a species are isolated from other species by the limitation of its dispersion or the specialization of their habitat.
There are various methods for identifying the spatial patterns in the form of indexes (Aguirre-Calderón, 2002; Rozas and Camarero, 2005; Ledo et al., 2012; Dale and Fortin, 2014); two of the most robust are the Morisita-Horn index (Morisita, 1959), which estimates the variation of the type and intensity of the pattern along a scalar spatial gradient, and Ripley’s K function, which analyzes the distance to the nearest neighbor and informs about the spatial pattern observed as a function of distance d (Ripley, 1977; Dixon, 2013).
It has been said that, in the tropical rain forests, species are distributed according to abundance hierarchies; usually, the lowest number of species corresponds to rare taxa, while there are few abundant taxa and many with an intermediate abundance (Martínez-Ramos and Álvarez-Buylla, 1995; Franklin and Rey, 2007; Yili et al., 2013). Certain authors (John et al., 2007; Blach-Overgaard et al., 2010) suggest that the main limiting factors for the display of a given spatial pattern by a certain species are either abiotic (altitude, latitude, temperature, luminosity, precipitation, evapotranspiration, soil type, topography and slope) or biotic (competition within and between species and depredation).
According to Fossa (2004) and Hernández et al. (2018), the assessment of spatial patterns along altitude gradients is an essential tool for predicting the behavior of the species and the dynamics of the vegetal flow between strata, particularly in the face of climate change scenarios and for conservation purposes (Cruz, 2013). Meta-analyses at a global level have suggested that tree species are being displaced toward higher altitudes as a result of the climate change, and precisely the higher areas of the tropics are where these changes have been reported with the greatest consistency, due to the reduction of the interval of distribution of these taxa (Parmesan, 2006; Brown et al., 2016).
According to Montañez et al. (2010), the higher the altitude, the greater the probability of finding a clumped pattern of tree individuals; therefore, it is inferred that the distribution pattern necessarily must be different in the lower tropical lands (Hubbell, 2001). Consequently, those species that prove unsuccessful to adapt to these environmental changes will disappear as a result of physiological stress (Parmesan, 2006; Brown et al., 2015), while the current interspecies relationships of those that do adapt successfully will be disturbed (Root et al., 2003).
In Mexico, Martínez-Ramos and Álvarez-Buylla (1995) point out that trees in humid rain forests generally have a clumped distribution because they exhibit a low dispersion and a high mortality during the early stages. In contrast, Zarco et al. (2010) cite a mainly random distribution for tree species in the tropical forest of Tabasco, although at certain sites they observed a clumped pattern in the lower stratum. This is similar to the results obtained by Martínez-Ramos (2006), who recorded a clumped pattern at the Montes Azules Biosphere Reserve in Chiapas, which he relates to land with an irregular topography and with the availability of sunlight for the undergrowth. Despite this research, studies on the spatial distribution along the altitude gradients are scarce across the country (Hernández et al., 2018), even more so in the tropical rain forests.
This highlights the importance of identifying the spatial distribution patterns of tree species in the tropical rain forests, given the high functional and structural complexity of these environments (Condit et al., 2002; Lohbek et al., 2015), as well as the threats that they face (Arroyo-Rodríguez et al., 2017).
Particularly in Chiapas, the Selva Lacandona is one of the most fragile systems; its forest cover has decreased by 70 % in the last decades due to the expansion of agriculture and livestock breeding expansion and to illegal timber extraction (Martínez-Ramos, 2006); the same factors affect several of their protected natural areas, as in the case of the Metzabok Flora and Fauna Protection Area (Conanp, 2006).
The purpose of the present research is to analyze and describe the distribution and spatial correlation pattern along an altitude gradient of the tree species in the Metzabok Protected Natural Area, in the Selva Lacandona of Chiapas. The spatial distribution pattern is expected to differ between development stages (seedling, sapling, and pole-sized tree) and height categories (lower, intermediate, higher), and along the altitude gradient, regardless of the index utilized.
Materials and Methods
Study area
The present research was carried out at the Metzabok Protected Natural Area (PNA), located in the northeast of the Selva Lacandona (17°08’ 36’’N and 91°34’42’’ W), in the Lacandona sub-community of Puerto Bello Metzabok, Ocosingo, Chiapas. This PNA has a surface area of 3 368 ha, at an altitude of 545 to 950 m (Conanp, 2006). The climate is Af(m)w”(i)g, warm humid with rains throughout the year, a mean annual temperature of 24 °C and a mean annual precipitation of 3 160 mm (García, 2004). The soil types are redzins, luvisols, gleysols, vertisols, cambisols and litosols (Sánchez-Gutiérrez et al., 2017). According to the classification by Miranda and Hernández-X (2014), the predominant vegetation is high evergreen tropical rain forest.
Altitude stratification and sampling
Five altitude strata were determined (AS1= < 600 masl, AS2= 600-700 masl, AS3= 700-800 masl, AS4= 800-900 masl, and AS5= > 900 masl) based on the generation of level curves at intervals of 100 m using the Global Mapper software, version 15. In each stratum, a 20 × 50 m (1 000 m2) sampling unit (SU) was installed, as shown in Figure 1; these sampling units were divided into ten 10 × 10 m (100 m2) sampling sub-units (SSU). In each SSU, all individuals of the stem class (reproductive trees) with normal diameter (DN) ≥ 2.5 cm were measured with diametric tape (Richter Messwerkzeuge, 283D/10M model) and located by their Cartesian coordinates (x, y) (Linzaga -Román et al., 2011; Dale and Fortin, 2014); the lower left corner of the plane was taken with respect to the slope of each SU as the origin (0, 0), as suggested by Ruiz-Aquino et al. (2015). Within Each SSU, a 5 × 5 m square was installed at random in order to register its saplings (young trees with a ND of < 2.5 cm and a height of > 1.5 m), and in each of these squares, two 2 × 2 m squares were established for the inspection of individuals classified as seedlings (with a height of < 1.5 m) (Zarco et al., 2010).

Simbología = Simbology; Unidad de muestro = Sampling unit; Cuerpos de agua = Bodies of water; EA = AS
Figure 1 Location of the sampling units (SU) in each altitude stratum (AS) of the Metzabok Protected Natural Area, in the Selva Lacandona of Chiapas.
The taxonomic identity of the individuals was determined with the support of the staff of the “ECOSCH-H” Herbarium of the Colegio de la Frontera Sur (Ecosur) (College of the Southern Border) in San Cristóbal de las Casas, Chiapas. The nomenclature was validated on the website Tropicos.org of the Missouri Botanical Garden (2008).
Spatial distribution analysis
Three height categories (lower, intermediate, higher) ―obtained from the inflection curves in the paper by Sánchez-Gutiérrez et al. (2017) ― were used for estimating the spatial distribution of the pole-sized trees. The spatial distribution pattern of the seedling and sapling development stages, as well as the height categories of the pole-sized trees, were determined using the Morisita-Horn index (Morisita, 1959); when their value is equal to 1, the distribution is random; when it is > 1, it is clumped, and when it is < 1, it is uniform (Morisita, 1959; Zarco et al., 2010; Rivera-Fernández et al., 2012). The Morisita-Horn index is defined in Equation (1):
Where:
q = Number of squares
ni = Number of individuals in the i th square
N = Total number of individuals in all the q squares
In order to obtain a more statistically robust and graphically representative index (Rozas and Camarero, 2005; Ledo et al., 2012; Dale and Fortin, 2014), Ripley’s K(t) function was also calculated (Ripley, 1977) for the spatial distribution of the height categories of the pole-sized trees, based on Equation (2):
Where:
n = Number of individuals of the sampling unit (SU-A)
(A( = Surface area of the SU-A (m2)
u ij = Distance between the ith and j th individual in the SU-A
t = Distance between two trees (m)
I t (u) = 1 if u ( t and 0 u > t
W ij = Proportion of the circumference of a circle with a center in SU-A (the summation of two the pairs of individuals ≤ t)
The variance was established by using the transformation of the square root of Ripley’s K(t), and the significance of the L(t) was determined based on Monte Carlo simulations (Besag, 1977). The maximum and minimum limits of L(t) were defined with a confidence interval of 99 %:
Where:
K(t) = Ripley’s univariate function
π = 3.1416
t = Distance (m)
If the value of L(t) = 0, the spatial pattern with a t radium is random; L(t) > 0 indicates clumping and L(t) < 0 indicates a uniform pattern.
Spatial correlation
The spatial correlation between height categories (lower-intermediate, lower-higher, and intermediate-higher) of the pole-sized tree species was analyzed using the L 12 (t) bivariate function, derived from the K 12 (t) function (Ripley, 1977):
Where:
K 12 (t) = Ripley’s bivariate function
π = 3.1416
t = Distance (m)
A L 12 (t) value = 0 indicates that the two groups are spatially independent; L 12 (t) > 0 refers to a positive association (attraction), and L 12 (t) < 0 expressed a negative association (repulsion). The significance (p ≤ 0.01) of L 12 (t) was determined with Monte Carlo simulations (Besag, 1977; Dale and Fortin, 2014), and the maximum and minimum limits were defined with a 99 % confidence interval. Ripley’s univariate and bivariate patterns were generated with the Toolbox software (Fisher, 2000).
Results and Discussion
Spatial distribution patterns of tree species
According to the Morisita-Horn index, the spatial distribution pattern of the
tree species for pole-sized tree species in all five AS and for all three
height categories (lower, intermediate and higher) had a clumped average
behavior (
Table 1 Values of the Morisita-Horn index for pole-sized trees (height categories: lower, intermediate, higher), saplings and seedlings in five altitude strata (AS) of the Metzabok Protected Natural Area in the Selva Lacandona, Chiapas.
| Altitude stratum (AS) | Pole-sized trees | Saplings | Seedlings | ||
|---|---|---|---|---|---|
| Lower | Intermediate | Higher | |||
| AS1 (< 600) | 1 | 1 | 1.1 | 1.3 | 1.1 |
| AS2 (600 - 700) | 1 | 1.3 | 1.3 | 1.1 | 1.1 |
| AS3 (700 - 800) | 1 | 1 | 0.8 | 1.1 | 1.2 |
| AS4 (800 - 900) | 1.1 | 1 | 1 | 1.1 | 1.6 |
| AS5 (> 900) | 1.3 | 1 | 0.8 | 1.0 | 1.0 |
It is worth noting that the general pattern recorded in the present study shows the differences when analyzed by AS. The lower height category exhibited a random and a clumped pattern at a lower and higher altitude, respectively (AS4 and 5) (Table 1). The cause of the clumped pattern is considered to be the clearings formed by natural disturbances: the fall or death of trees, pests and diseases (Brown et al., 2015); these are colonized by pioneer species, whose regeneration depends on sunlight and seeds with a lower range of dispersion (Hubbell, 2001).
However, the presence of both spatial patterns (random and clumped) in the present studio can also be the result of human activities that have modified the habitat and directly affected the survival, reproduction and establishment of the species, as proven by Pavón-Hernández and Rico-Gray (2004) for a transformed landscape in the state of Veracruz, Mexico.
The intermediate height category exhibited a random behavior
Other studies (Blach‐Overgaard et al., 2010) have shown that the cause of the clumped pattern in tropical rain forests is the fact that the rainy season is associated to strong winds, which promote the falling of trees, whereby microclimates are formed that favor repopulation in clusters. According to Martínez-Ramos (2006), the clumped pattern is related to the topographic and edaphic characteristics; however, it has also been suggested that it can be due to deficient dispersion mechanisms of seeds and low seed depredation (Franklin and Rey, 2007; Hosaka et al., 2017).
For the higher height category, the distribution of the species (Sebastiana longicuspis Standl, Pseudolmedia spuria (Sw.) Griseb, Manilkara zapota (L.) Royen and Pouteria reticulata (Engl.) Eyma) was uniform at a higher altitude and clumped at a lower altitude (Table 1). The clumped pattern in this category is considered to be caused by closeness to the community, as these are areas where the commoners extract timber for domestic use ―a situation that generates the formation of clearings which are taken up by a group of species (Dialium guianense (Aubl.) Sandwith, Heliocarpus appendiculatus Turcz. and Pseudolmedia oxiphyllaria Donn. Sm.) that need direct sunlight to grow and develop (Conanp, 2006; Rivera-Fernández et al., 2012).
The sapling and seedling development stages profiled a clumped pattern, except for the last AS5 (> 900 masl), in which a random behavior was observed (Table 1). The clearings allow entry of the sunlight, which affects the incorporation and growth of undergrowth plants (Martínez-Ramos, 2006), as in the case of saplings and seedlings. Therefore, any alteration of the characteristics of the canopy has an impact on germination, growth rate, survival and the distribution of the plants (Brienen and Zuidema, 2006; Yili et al., 2013), given the specific dominant conditions within the clearing that promote the clustering of the species.
Martínez-Ramos (2006) cites that the clumped pattern is greater in small individuals (with a ND of 1 to 5 cm) than in larger individuals (ND ≥ 10 cm), which have a random distribution. Actually, in the random pattern, individuals are totally independent from the position of any other individual in the population; this behavior occurs only in certain species of temperate forests (Hernández et al., 2018), but it is very common in tree individuals of tropical rain forests (Franklin and Rey, 2007; Yili et al., 2013).
The results of this study suggest a certain tendency with altitude gradients and indicate that, at the Metzabok PNA, there is a climate variation by gradient that modifies the structure and the makeup of the rain forest; this agrees with other studies on tree structure, composition and diversity performed in the same study area (Martínez-Ramos, 2006; Sánchez-Gutiérrez et al., 2017). While in Costa Rica, Cruz (2010) found that, at altitudes between 400 and 900 m, there is no influence of the altitude gradient on the spatial distribution pattern; he also explains that this may be due to the fact that the altitude interval is relatively small, and therefore, the climate conditions do not vary between strata. Consequently, it has been suggested that studies on the vegetation by altitude gradients should be carried out in large geographical expanses (Fossa, 2004).
Spatial distribution of tree species with Ripley’s K(t) function
According to Ripley’s univariate K(t) function, the spatial distribution of the three height categories of pole-sized trees exhibited a significant pattern (p ≤ 0.01) ―clumped, random or uniform― at different distances, which implies that the suggested hypothesis is accepted (Figure 2). This is a similar result to that obtained with the Morisita-Horn index for pole-sized trees (Table 1).

Distancia = Distance; Inferior = Lower; Intermedia = Intermediate; Superior = Higher.
Figure 2 L(t) univariate distribution values for the three height categories of pole-sized trees in five altitude strata (AS) of the Metzabok Protected Natural Area in the Selva Lacandona of Chiapas.
In general, the lower height category had a clumped pattern, with variation at different distances and altitude strata (Figure 2). AS1 and 4 have a clumped distribution at distances of 1 to 6 m, and a uniform distribution at distances of more than 7 m; AS2 had a random behavior, and the distribution of AS3 was uniform at distances of 1 to 2 m, and a clumped distribution at distances of 3 to 10 m (Figure 2). AS5 had a clumped distribution at all the distances.
The variation in the distribution patterns in the different AS is related to the clearings generated by the intermediate and higher categories, since, having been affected by some disturbance (such as the falling of branches or of the whole tree, tree fellings or death due to pests and diseases), these surfaces are repopulated by species that demand light and which change their initial (clumped) pattern into a random pattern through death processes (Franklin and Rey, 2007; Barreto-Silva et al., 2014). Within the study area, the clearings are colonized by R. guatemalensis (S. Watson) Bartlett, which coincides with the results obtained by Zarco et al. (2010) in rain forests of Tabasco, according to whom this species grows and is prevalent in the lower stratum of rain forests where disturbs occur.
The intermediate height category had a mostly random distribution, although at shorter distances the trees adopt a uniform pattern, with the exception of AS2, which as a clumped distribution at distances of 2 to 10 m (Figure 2). The random distribution in this category is due mainly to the timber extraction that took place in the study area during the 1970s (Conanp, 2006), which promoted the mortality of a heterogeneous group of species in space. On the other hand, clumped patterns may be a response to the environmental variability between strata and are ecologically common in large individuals (Dixon, 2013).
In the higher height category, AS1 and 2 exhibited a clumped pattern at distances of less than 8 m (Figure 2), due both to the natural death of certain old trees and to the selective extraction of precious woods such as mahogany (Swietenia macrophylla King) and cedar (Cedrela odorata L.). In fact, in the years 1975 and 1984, the exploitation of 55 000 m3 and 20 000 m3 of common tropical species in the Selva Lacandona was authorized (Vásquez-Sánchez et al., 1992), and the timber exploitation by the population of certain areas of the PNA for purposes of building homes is ongoing (Conanp, 2006); these populations leave clusters of the species M. zapota, P. reticulata, Manilkara chicle (Pittier) Gilly and Brosimun alicastrum Sw standing because their wood is hard and dense, and therefore difficult to handle, which renders them less valuable.
This agrees with the findings of Franklin and Rey (2007) and of Dale and Fortin (2014), according to whom the logical evolution of the spatial pattern with the increasing age of the individuals is caused by the accumulated effect of the disturbances, competition and attack by pathogens. Therefore, a random pattern can change into a clumped or uniform pattern, according to the environmental and anthropic characteristics of the habitat.
Although a uniform behavior is rare in natural assemblies, it may be found in stable environments with minimal disturbances (Antos and Parish, 2002). Indeed, the model proposed by Janzen (1970) states that the consequence of the mortality of trees is a uniform distribution of the surviving adult individuals, as was corroborated by Lan et al. (2009) in the tropical rain forests of China, where they observed that these tend to follow a uniform distribution in environments with multiple species.
The extremely variable spatial pattern registered in AS3, 4 and 5 (Figure 2) may be due to the difficulty to access these strata, as there are no records of timber exploitation, and it is possible to find Calophyllum brasiliense Cambess., Terminalia amazonia (J.F. Gmel.) Exell, Guatteria anomala R.E. Fr., M. chicle and M. zapota individuals with a diameter of up to 190 cm and heights above 50 m. Certain authors (Rozas and Camarero, 2005; Linzaga-Román et al., 2011) propose that such a variable behavior in the distribution pattern is accounted for by the topographic factors of the site. Thus, it may be suggested that the distribution of species at the Metzabok PNA can be associated to the environmental heterogeneity induced by the relief and by the disturbances produced in each site, as suggested by Montáñez et al. (2010) and Barreto-Silva et al. (2014) for certain tropical rain forests of Colombia.
Spatial correlation patterns
According to the spatial correlation of Ripley’s K 12 (t) function, the bivariates of the AS2, 3 and 5 of the lower-intermediate height category indicated spatial repulsion in distances of less than 2 m and attraction of between 3 and 10 m (Figure 3). The repulsion at a small scale between the two categories would be a consequence of the density-dependent mortality of the seedlings located beneath the crowns of the intermediate and higher height categories; therefore, species of the lower height categories (Myriocarpa longipes Liebm. and Piper psilorhachis C. DC.) colonize the available spaces, except under the crown of taxa of the higher categories, such as C. brasiliense, T. amazonia and G. anomala (Lan et al., 2009).
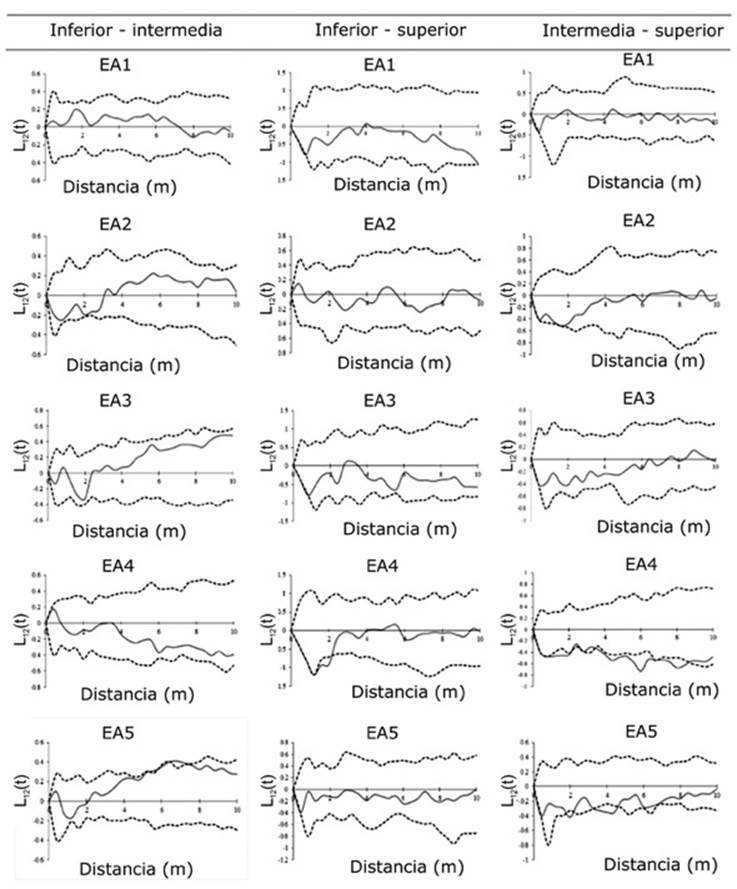
Distancia = Distance; EA = AS; Inferior-Intermedia = Lower-intermediate; Inferior-Superior = Lower-higher; Intermedia- Superior = Intermediate-higher.
Figure 3 Matrix of the ratio of the bivariate L 12 (t) distribution to the three height categories of the pole-sized tree species in five altitude strata (AS) of the Metzabok Protected Natural Area in the Selva Lacandona of Chiapas.
This behavior can also be caused by depredation processes, as it is more likely that the predators will eliminate those individuals that are closest to the seed tree (Hosaka et al., 2017); this would explain the existence of repulsion between the lower-higher category at near distances, and of attraction in the intermediate-higher, as the distance to the parent tree increases (Rozas and Camarero, 2005; Barreto-Silva et al., 2014).
This contrasts with the AS1 and 4, in which the correlation pattern was independent, as it was the same that was observed for all the strata of the lower-higher category. In the intermediate-superior category (Haematoxylum campechianum L. and Hauya elegans DC. vs. D. guianense and Pouteria durlandii (Standl.) Baehni, respectively), negative associations (repulsion) occur at different distances; this was more noticeable in the AS4 (Figure 3). This type of behavior is perhaps a response to the high mortality of seeds and lower individuals close to the higher trees. Diseases and depredation are concentrated in the vicinity of the parent trees, which causes density-dependent mortality, as there is a higher probability of survival and seed-producing adults (Janzen, 1970; Franklin and Rey, 2007; Hosaka et al., 2017).
Conclusions
The spatial distribution pattern of the tree species is related to the altitude, but it is also influenced by natural and anthropic disturbances. The species of the sapling (Chamaedorea oblongata Mart., Chamaedorea pinnatifrons (Jacq.) Oerst., P. oxiphyllaria and Chionanthus oblanceolatus (B. L. Rob.) P.S. Green), and seedling (R. guatemalensis, Eugenia acapulcensis Steud., Aphananthe monoica (Hemsl.) J.-F. Leroy and P. reticulata), development stages respectively, are found in a cluster arrangement because most of them grow in disturbed areas with the presence of clearings, though under the canopy of residual pole-sized trees, because their growth and development require more sunlight.
The spatial correlation pattern between height categories is variable. In the lower-intermediate category (with dominant species like R. guatemalensis and P. psilorhachis vs. Garcinia intermedia (Pittier) Hammel and Trophis mexicana (Liebm.) Bureau) and intermediate-higher (with dominance by H. campechianum L. and H. elegans vs. D. guianense and P. durlandii), there is repulsion at a shorter distance, due to the shade cast by taller individuals, which prevents the entry of sunlight, and an attraction at a longer distance, promoted mainly by a higher probability of survival to attack by predators.
Based on the results, it is possible to propose reforestation strategies and forest restoration strategies that will consider the positive interactions of the ecological assemblies formed by saplings, seedlings, and pole-sized trees in the various height categories and altitude gradients, in order to preserve the structure and spatial composition of the Selva Lacandona.
Acknowledgments
The authors wish to express their gratitude to the Consejo Nacional de Ciencia y Tecnología for the doctoral scholarship granted to the first author for carrying out this research (grantee No. 347396), as well as to the Colegio de Postgraduados, Montecillo Campus, for the partial funding of the field work.
REFERENCES
Aguirre-Calderón, O. A. 2002. Índices para la caracterización de la estructura del estrato arbóreo de ecosistemas forestales. Ciencia Forestal en México 27(92): 5-27. [ Links ]
Arroyo‐Rodríguez, V., F. P. L. Melo, M. Martínez‐Ramos, F. Bongers, R. L Chazdon, J. A .Meave, N. Norden, B. A. Santos, I. R. Leal and M. Tabarelli . 2017. Multiple successional pathways in human‐modified tropical landscapes: new insights from forest succession, forest fragmentation and landscape ecology research. Biological Reviews 92(1):326-340. https://doi.org/10.1111/brv.12231. [ Links ]
Antos, J. A. and R. Parish, 2002. Structure and dynamics of a nearly steady-state subalpine forest in south-central British Columbia, Canada. Oecologia 130(1): 126-135. https://doi.org/10.1007/s004420100787. [ Links ]
Barreto-Silva, J. S., D. Cárdenas-López y A. J. Duque-Montoya. 2014. Patrones de distribución de especies arbóreas de dosel y sotobosque a escala local en bosques de tierra firme, Amazonia colombiana. Revista de Biología Tropical 62(1): 373-383. [ Links ]
Besag, J. 1977. Contribution to the discussion on Dr. Ripley’s paper. Journal of the Royal Statistical Society B 39(2): 192-212. https://doi.org/10.1111/j.2517-6161.1977.tb01616.x. [ Links ]
Blach‐Overgaard, A., S. Jens‐Christian, J. Dransfield, M. Greve and H. Balslev. 2010. Determinants of palm species distributions across Africa: the relative roles of climate, non‐climatic environmental factors, and spatial constraints. Ecography 33(2): 380-391. https://doi.org/10.1111/j.1600-0587.2010.06273.x. [ Links ]
Brienen, R. J. W. and P. A. Zuidema. 2006. Lifetime growth patterns and ages of Bolivian rain forest trees obtained by tree ring analysis. Journal of Ecology 94(2): 481-493. https://doi.org/10.1111/j.1365-2745.2005.01080.x. [ Links ]
Brown, C. J., M. I. O'Connor, E. S. Poloczanska, D. S. Schoeman, L. B. Buckley, M. T. Burrows, C. M. Duarte, B. S. Halpern, J. M. Pandolfi, C. Parmesan and A. J. Richardson. 2015. Ecological and methodological drivers of species’ distribution and phenology responses to climate change. Global Change Biology 22(4): 1548-1560. https://doi.org/10.1111/gcb.13184. [ Links ]
Comisión Nacional de Áreas Naturales Protegidas (CONANP). 2006. Programa de Conservación y Manejo del Área de Protección de Flora y Fauna Metzabok. CONANP-SEMARNAT. México, D.F., México. 179 p. [ Links ]
Condit, R., N. Pitman, E. Leigh, J. Chave, J. Terborgh, R. B. Foster, P. Núñez, S. Aguilar, R. Valencia, G. Villa, H. Muller-Laundau, E. Losos and S. P. Hubbell. 2002. Beta-Diversity in tropical forest trees. Science 295: 666-668. https://doi.org/10.1126/science.1066854. [ Links ]
Cruz, B. F. 2013. Distribución espacial de la regeneración natural de especies arbóreas dentro del gradiente altitudinal Caribe-Villa Mills, Costa Rica y su relación con variables bioclimáticas. Tesis de Maestría. Centro Agronómico Tropical de Investigación y Enseñanza (CATIE). Turrialba, Costa Rica . 130 p. [ Links ]
Dale, M. R. and M. J. Fortin. 2014. Spatial Analysis: A Guide for Ecologists. 2nd edition. Cambridge University Press. Cambridge, UK. 438 p. [ Links ]
Dixon, P. M. 2013. Ripley's K function. Encyclopedia of Environmetrics 3:1796-1803. https://doi.org/10.1002/9781118445112.stat07751. [ Links ]
Fisher, M. 2000. Toolbox: Software available for sophisticated spatial statistics. University of the South Pacific. Suva, Fiji. 28 p. [ Links ]
Fossa, A. M. 2004. Biodiversity patterns of vascular plant species in mountain vegetation in the Faroe Islands. Diversity and Distributions 10(3): 217-223. https://doi.org/10.1111/j.1366-9516.2004.00080.x. [ Links ]
Franklin, J. and S. J. Rey. 2007. Spatial patterns of tropical forest trees in Western Polynesia suggest recruitment limitations during secondary succession. Journal of Tropical Ecology 23(1): 1-12. https://doi.org/10.1017/S0266467406003774. [ Links ]
García, E. 2004. Modificaciones al Sistema de Clasificación Climática de Köppen (para adaptarlo a las condiciones de la República Mexicana). Serie Libros. Núm. 6. Instituto de Geografía, Universidad Nacional Autónoma de México. México, D.F., México. 98 p. [ Links ]
Hernández, F., C. B. Navarro, R. Peña y A. Nájera. 2018. Patrón de distribución espacial de las especies arbóreas de la región de El Salto, Durango. Revista Mexicana de Ciencias Forestales 9(47): 169-186. https://doi.org/10.29298/rmcf.v9i47.161. [ Links ]
Hosaka, T., T. Yumoto, Y. Chen, I. F. Sun, S. J. Wright, S. Numata and M. N. Supardi. 2017. Responses of pre‐dispersal seed predators to sequential flowering of Dipterocarps in Malaysia. Biotropica 49(2): 177-185. https://doi.org/10.1111/btp.12371. [ Links ]
Hubbell, S. P. 2001. The Unified Neutral Theory of Biodiversity and Biogeography. Series Monographs in Population Biology. Princeton University Press. Princeton, NJ USA. 448 p. [ Links ]
Janzen, D. H. 1970. Herbivores and the Number of Tree Species in Tropical Forests. American Naturalist 104: 501-528. [ Links ]
John, R., J. W. Dalling, K. E. Harms, J. B. Yavitt, R. F. Stallard, M. Mirabello, S. P. Hubbell, R. Valencia, H. Navarrete, M. Vallejo and R. B. Foster. 2007. Soil nutrients influence spatial distributions of tropical tree species. Proceedings of the national Academy of Sciences of the United States of America 104(3): 864-869. https://doi.org/10.1073/pnas.0604666104. [ Links ]
Lan, G., H. Zhu, M. Cao, Y. Hu, H. Wang, X. Deng, S. Zhou, J, Cui, J. Huang, Y. He, L. Liu, H. Xu and J. Song. 2009. Spatial dispersion patterns of trees in a tropical rainforest in Xishuangbanna, southwest China. Ecological Research 24(5): 1117-1124. https://doi.org/10.1007/s11284-009-0590-9. [ Links ]
Ledo, A., S. Condés y F. Montes. 2012. Revisión de índices de distribución espacial usados en inventarios forestales y su aplicación en bosques tropicales. Revista Peruana de Biología 19(1): 113-124. [ Links ]
Linzaga-Román, B. E., G. Ángeles-Pérez, C. Catalán-Heverástico y P. Hernández de la Rosa. 2011. Estructura espacial de Pachycereus weberi (Coult.) Backeb., en la Cañada del Zopilote, Guerrero. Revista Chapingo Serie Ciencias Forestales y del Ambiente 17(2): 189-198. http://dx.doi.org/10.5154/r.rchscfa.2010.06.039. [ Links ]
Lohbeck, M., E. Lebrija-Trejos, M. Martínez-Ramos, J. A. Meave, L. Poorter and F. Bongers. 2015. Functional trait strategies of trees in dry and wet tropical forests are similar but differ in their consequences for succession. PloS ONE 10(4): e0123741. https://doi.org/10.1371/journal.pone.0123741. [ Links ]
Martensen, A. C., S. Saura and M. J. Fortin. 2017. Spatio-temporal connectivity: Assessing the amount of reachable habitat in dynamic landscapes. Methods in Ecology and Evolution 8(10): 1253-1264. https://doi.org/10.1111/2041-210X.12799. [ Links ]
Martínez-Ramos, M. 2006. Aspectos ecológicos de la selva húmeda en la región Lacandona: perspectivas para su estudio y conservación, en K. Oyama y A. Castillo (eds.). Manejo, conservación y restauración de recursos naturales en México. Perspectivas desde la investigación científica. Siglo XXI Editores. México, D. F., México. pp. 292-325. [ Links ]
Martínez-Ramos, M . y E. Álvarez-Buylla. 1995. Ecología de poblaciones de plantas en una selva húmeda de México. Boletín de la Sociedad Botánica de México 56: 121-153. http://dx.doi.org/10.17129/botsci.1469. [ Links ]
Miranda, F. y E. Hernández-X. 2014. Los tipos de vegetación de México y su clasificación. Fondo de Cultura Económica y Comisión Nacional para el Conocimiento y Uso de la Biodiversidad. México, D.F., México. 214 p. [ Links ]
Montañez, V. R. A., V. C. Y. Escudero y M. A. J. Duque 2010. Patrones de Distribución Espacial de Especies Arbóreas en Bosques de Alta Montaña del Departamento de Antioquia, Colombia. Revista Facultad Nacional de Agronomía Medellín 63 (2): 5629-5638. [ Links ]
Morisita, M. 1959. Measuring of the dispersion and analysis of distribution patterns. Memories of the Faculty ofScience , Kyushu University. Series E Biology 2: 215-235. [ Links ]
Parmesan, C. 2006. Ecological and evolutionary responses to recent climate change. Annual Review of Ecology, Evolution and Systematics 37(1): 637-669. [ Links ]
Pavón-Hernández, N. P. y V. Rico-Gray. 2004. Distribución espacial de Tilia mexicana schlecht. (Tiliaceae) en el paisaje del centro del estado de Veracruz, México. Universidad y Ciencia 20(39): 29-32. [ Links ]
Ripley, B. D. 1977. Modelling spatial patterns. Journal of the Royal Statistical Society Series B (Methodological) 39:172-212. [ Links ]
Rivera-Fernández, A., P. Octavio-Aguilar, N. G. Sánchez-Coello, L. R. Sánchez-Velásquez, S. M. Vázquez-Torres y L. G. Iglesias-Andreu. 2012. Estructura poblacional y distribución espacial de Ceratozamia mexicana Brongn. (Zamiaceae) en un ambiente conservado y en uno perturbado. Tropical and Subtropical Agroecosystems 15(2):110-117. [ Links ]
Root, T., J. Price, K. Hall, S. Schneider, C. Rosenzweig and J. Pounds. 2003. Fingerprints of global warming on wild animals and plants. Nature 421: 57-60. https://doi.org/10.1038/nature01333. [ Links ]
Rozas, V. y J. J. Camarero. 2005. Técnicas de análisis espacial de patrones de puntos aplicadas en ecología forestal. Investigación Agraria. Sistemas y Recursos Forestales 14(1): 79-97. [ Links ]
Ruiz-Aquino, F., J. I. Valdez-Hernández, A. Romero-Manzanares, F. Manzano-Méndez and M. E. Fuentes-López. 2015. Spatial distribution of two oak species and ecological attributes of pine-oak woodlands from Ixtlán de Juárez, Oaxaca. Revista Chapingo Serie Ciencias Forestales y del Ambiente 21(1): 67-80. http://dx.doi.org/10.5154/r.rchscfa.2014.05.023. [ Links ]
Sánchez-Gutiérrez, F., A. Valenzuela-Gómez, J. I. Valdez-Hernández y C. A. González-González. 2017. Estructura y diversidad de especies arbóreas del sitio arqueológico “El Mirador”, Selva Lacandona, Chiapas. Polibotánica 44: 79-94. https://doi.org/10.18387/polibotanica.44.6. [ Links ]
Vásquez-Sánchez, M. A., I. J. March y M. A. Lazcano-Barrero. 1992. Características socioeconómicas de la Selva Lacandona. Ecosfera 1: 287-323. [ Links ]
Ver Hoef, J. M., E. E. Peterson, M. B. Hooten, E. M. Hanks and M. J. Fortin. 2018. Spatial autoregressive models for statistical inference from ecological data. Ecological Monographs 88(1): 36-59. https://doi.org/10.1002/ecm.1283. [ Links ]
Yili G., J. Lu, S. B. Franklin, Q. Wang, Y. Xu, K. Zhang, D. Bao, X. Qiao, H. Huang, Z. Lu and M. Jiang. 2013. Spatial distribution of tree species in a species-rich subtropical mountain forest in central China. Canadian Journal of Forestry Research 43(9): 826-835. https://doi.org/10.1139/cjfr-2013-0084. [ Links ]
Zarco, V. M., J. I. Valdez-Hernández, G. Ángeles y C. O. Castillo . 2010. Estructura y diversidad de la vegetación arbórea del parque estatal Agua Blanca, Macuspana, Tabasco. Universidad y Ciencia 26(1): 1-17. [ Links ]
Received: June 12, 2019; Accepted: July 19, 2019
 Este es un artículo publicado en acceso abierto bajo una licencia
Creative Commons
Este es un artículo publicado en acceso abierto bajo una licencia
Creative Commons
