


Services on Demand
Journal
Article
 text in
  English (pdf)
 Article in xml format
 Article references
 Send this article by e-mail
Indicators
-
 Cited by SciELO
 -
 Access statistics
Related links
-
 Similars in
SciELO
Similars in
SciELO
Share

 Permalink
Revista mexicana de ciencias forestales
Print version ISSN 2007-1132
Rev. mex. de cienc. forestales vol.10 n.54 México Jul./Aug. 2019
https://doi.org/10.29298/rmcf.v10i54.149
Articles
Structure of a forest ecosystem and its relationship with the carbon stock in Northeastern Mexico
1Facultad de Ciencias Forestales. Universidad Autónoma de Nuevo León, México.
2Campo Experimental Valle de México. Instituto Nacional de Investigaciones Forestales, Agrícolas y Pecuarias. México.
3Facultad de Ciencias Forestales. Universidad Juárez del Estado de Durango. México.
There is a positive relationship between the horizontal and vertical diversity of vegetation with the carbon stock (CS). The objective was to characterize a forest ecosystem and generate a model that describes the behavior of the CS in relation to the diversity of vegetation through diversity indexes. 10 sampling sites 2 500 m2 were established. Basal area (G), Carbon stock (CS), and Shannon-Wiener (H') and Pretzsch (A) indexes was calculated. Site 3 had the highest G with 49.01 ± 7.74 m2 ha-1, and site 8 had a G of (22.67 ± 2.5 m2 ha-1). Site 3 had the highest value CS (123.48 ± 17.19 Mg ha-1), site 8 had the lowest CS with 58.35 ± 5.75 Mg ha-1. Site 2 had the highest value A = 2.53, with A max = 3.5, and site 6 had the lowest values (A = 1.5 and A max = 2.48). Site 2 had the highest values H '= 1.78 and H' max = 2.40; site 8 had the lowest (H' = 0.83 and H' max = 1.10). Site 3 is characterized by northeast aspect and slope > 100 %, while sites 6 and 8 have northeast-east aspect and slopes of 20 to 40 %. The best regression model between the CS and H’, and for A was an exponential one with R2 = 0.62 and R2 =0.59 (respectively). We conclude that there is a relation between the CS and the studied indexes.
Key words: Carbon stock; basal area; mixed forest; Nuevo León; Pretzsch index; Shannon-Wiener index
Existe una relación positiva entre el contenido de carbono (CC) y la diversidad horizontal y vertical de la vegetación. El objetivo fue caracterizar un ecosistema forestal y generar un modelo que describa el comportamiento del CC con la diversidad de la vegetación, a través de índices de diversidad. Se establecieron 10 sitios de muestreo de 2 500 m2, y se calculó la altura promedio, diámetro normal promedio (d 1.30), área basal (G), contenido de carbono (CC) e índices de Shannon-Wiener (H’) y Pretzsch (A). El sitio 3 tuvo mayor G, con 49.01±7.74 m2 ha-1; y el 8 la menor (22.67 ± 2.5 m2 ha-1), a este último también le correspondió el más bajo de CC, con 58.35±5.75 Mg ha-1; mientras que, el 3 tuvo el valor más alto (123.48±17.19 Mg ha-1). En relación a los índices, el sitio 2 registró un A=2.53, con un A max =3.5, y el 6 tuvo valores inferiores (A=1.5 y A max =2.48); para el índice de Shannon-Wiener el mayor valor se presentó en el sitio 2: H’=1.78 y H’ max =2.40, y el más bajo en el 8 (H’=0.83 y H’ max =1.10). El sitio 3 se caracteriza por tener exposición noreste y pendiente >100 %, en tanto que en los sitios 6 y 8 es noreste-este y pendientes de 20 a 40 %. Los mejores modelos de regresión entre CC y H’ y A, fueron de tipo exponencial, con un R2=0.62 y R2=0.59, respectivamente. Se concluye que sí existe una relación entre CC y los índices estudiados.
Palabras clave: Almacenes de carbono; área basal; bosques mixtos; Nuevo León; índice de Pretzsch; índice de Shannon-Wiener
Introduction
Due to its high fragility, structure is one of the most relevant aspects of forest areas, and therefore it is easily modified. Usually, it refers to the form in which the attributes of the trees are distributed in the ecosystems (Bettinger et al., 2008; Gadow et al., 2011). The importance of the biological structure lies in its self-organization, which involves the regeneration, growth and mortality of the trees, as well as a variety of interactions between individuals, which in turn affects the properties of the ecosystem ((João and Carvalho, 2011; Gadow et al., 2011). These include biomass production, carbon storage, vegetal diversity, and water uptake, among others; and the quality of these ecosystem services depends, to a greater extent, on the management for attaining a given purpose (Ruiqiang et al., 2014). Therefore, it is necessary to carry out a correct characterization of the structure of the ecosystems that serves as a basis for appropriate decision-making in the management of forest resources (Jiménez et al., 2001; Wehenkel et al., 2011; Bannister and Donoso, 2013), in order to increase the carbon stock that can be stored by a forest without deteriorating the diversity of vegetation.
The management of the forest for the timber production does not oppose management geared at increasing the carbon stock, and much less, if the increase in carbon stock has an impact in terms of loss of diversity of the tree stratum.
The characterization of these ecosystems can be carried out by using indexes that measure elements of their diversity and are indicators of the quality and quantity of the ecosystem resources (Magurran, 1988). Furthermore, they make it possible to compare natural communities with communities modified through forest management (Halffter, 1998), whereby conservation and sustainable management strategies can be designed at a local level (Moreno, 2001). In this sense, the proposed hypothesis is that there is a relationship between the horizontal and vertical diversity of vegetation and the carbon stock, since an increase in the former augments both the surface area and the strata present in a forest, which result in efficient carbon storage. The objective was, therefore, to assess the structure of a forest ecosystem and generate a model that describes the behavior of the carbon stock in relation to the diversity of the vegetation, through diversity indexes, in a forest of northeastern Mexico, and which may serve as a new tool for making adequate forest management decisions.
Materials and Methods
The study area is located in the south of the state of Nuevo León, whose geographic location is between 23°45’, 25°32’ N and 99°27’, 100°25’ W (Figure 1). The climate is semi-cold subhumid with summer rains [C(E)(w)], with a mean annual temperature of 16 to 18 °C and a mean annual precipitation of 400 to 1 200 mm (García, 2004). The vegetation of the region consists of pine-oak and oak-pine forests, and small areas where the genera Abies, Pseudotsuga and Picea occur (Inegi, 2016).
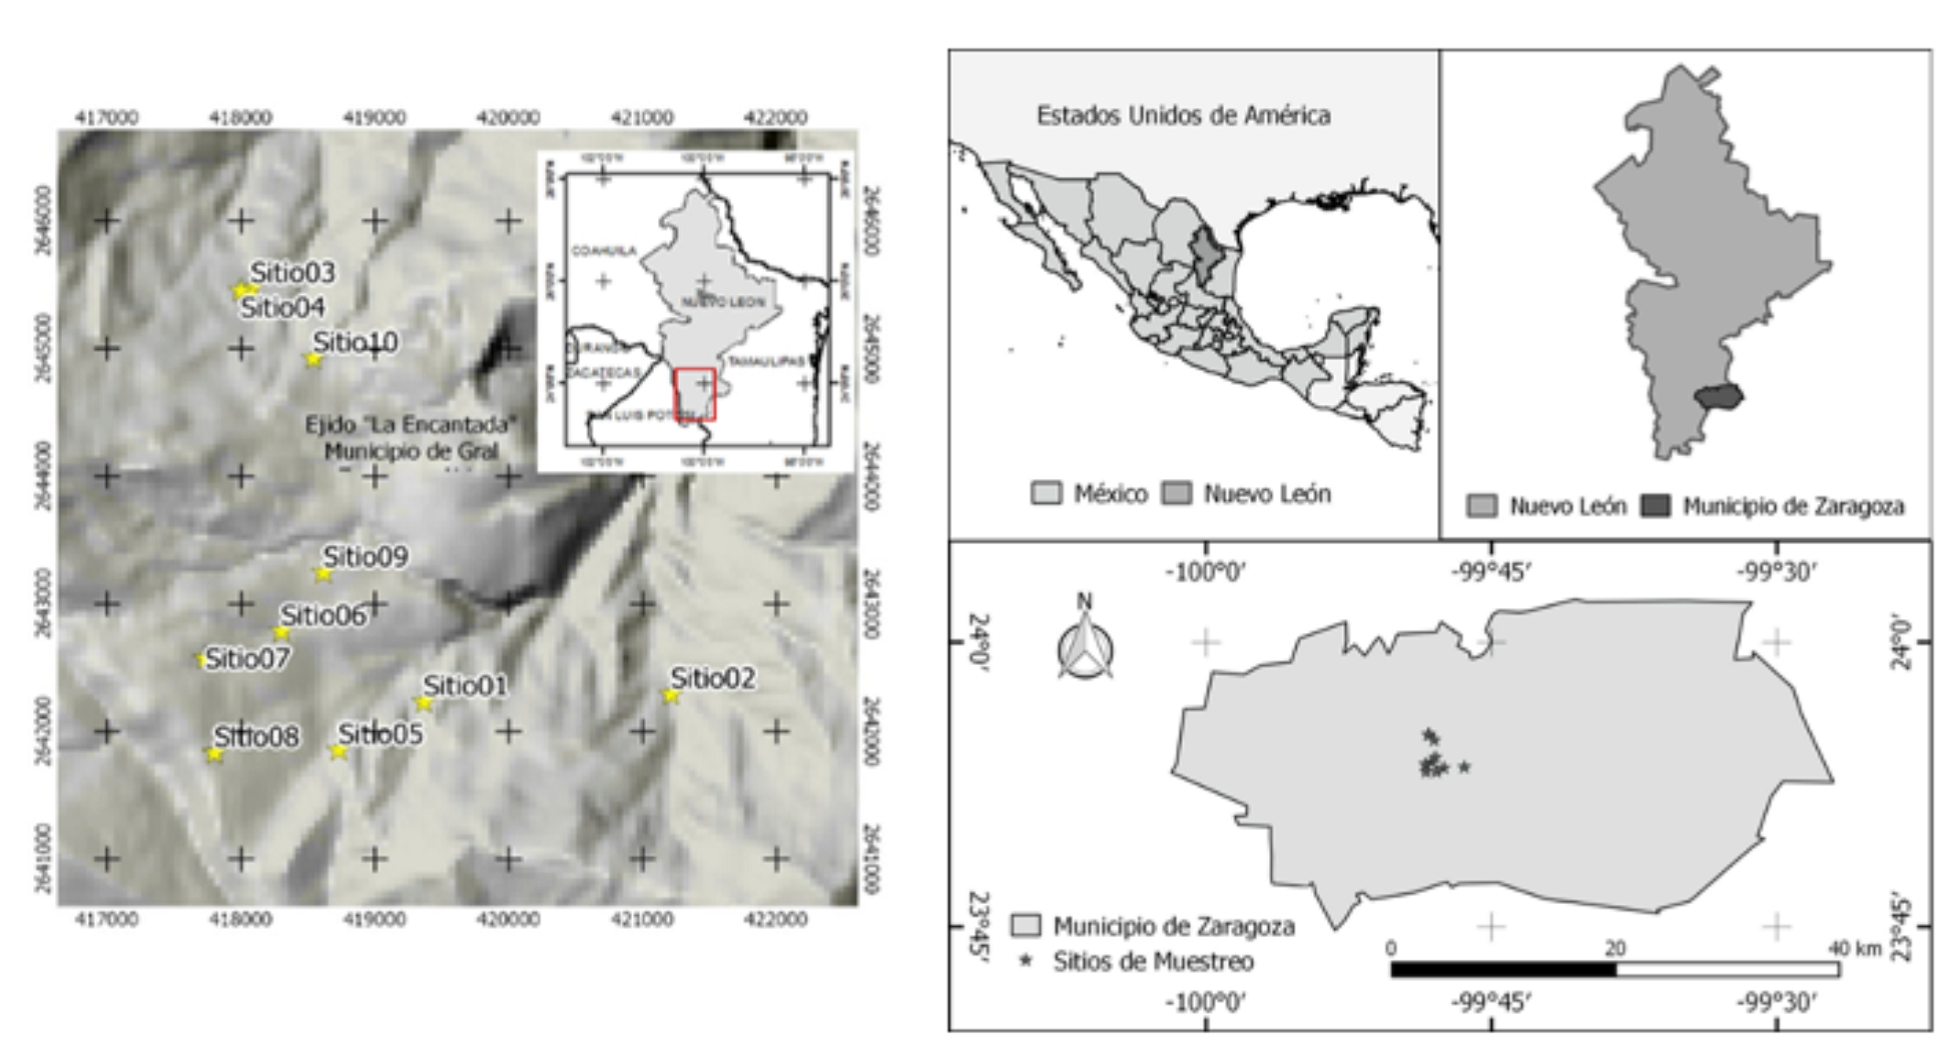
10 sampling sites were established, each with a surface area of 2 500 m2 (50 × 50 m) geographycally located with a GarminTM 62 GPS in different physiographic conditions (Table 1), according to the parameters utilized at the forest and soil research sites (Corral-Rivas et al., 2009). In order to measure the slope of each site, an electronic HaglöfTM clinometer was used; a BruntonTM compass to define its orientation was used as well. Normal diameter (d 1.30 ) was taken with a Forestry Suppliers IncTM diametric tape and total height with a Vertez IIITM hypsometer in every tree having a normal diameter > 7.5 cm. The similarity assessment between the sampling sites was performed in terms of the physiographic characteristics; for this purpose, a hierarchic cluster analysis was carried out using the block-distance measure, and Ward’s clustering method, with its respective similarity dendrogram was utilized (IBM Corporation, 2013).
Table 1 Physiographic characteristics of the sampling sites.
| Site | TMU-X | TMU-Y | Altitude (masl) | Exposure | Slope (%) |
|---|---|---|---|---|---|
| 1 | 419 365 | 2 642 230 | 2 600-2 700 | Northeast | 0 - 20 |
| 2 | 421 211 | 2 642 230 | < 2 500 | North | > 100 |
| 3 | 418 074 | 2 642 783 | 2 500-2 600 | North | > 100 |
| 4 | 417 997 | 2 645 453 | 2 500-2 600 | Northeast | 0 - 20 |
| 5 | 418 729 | 2 641 853 | 2 700-2 800 | Northwest | 0 - 20 |
| 6 | 418 301 | 2 642 783 | 2 700-2 800 | Northeast | 20 - 40 |
| 7 | 417 732 | 2 642 572 | > 2 900 | East | 20 - 40 |
| 8 | 417 801 | 2 641 831 | > 2 900 | East | 0 - 20 |
| 9 | 418 615 | 2 643 242 | 2 700-2 800 | East | 20 - 40 |
| 10 | 418 540 | 2 644 924 | 2 600-2 700 | Northeast | 40 - 60 |
The height and average height, the basimetric area (G) and the carbon stock (CS) were estimated; the data dispersion was obtained for each, through the standard deviation at the sampling site level. The horizontal (Shannon-Wiener) and vertical (Pretzsch) species diversity indexes and the importance value index (IVI) were determined.
The basal area was estimated as the sum per unit of surface area of all the stems, at the normal diameter level (Equation 1).
Where:
G = Basal area
d = Normal diameter
π = Constant (3.1416)
n = Number of trees present within the sampling site
The stored carbon was quantified using the allometric equations of the main species, previously generated by various authors; in the case of thos/e for which there were no specific expressions in the study region, the expressions developed in other areas of the country with a temperate-cold climate were used for the taxon of interest (Table 2).
Table 2 Allometric equations by species.
| Species | Equation | Autor |
|---|---|---|
| Picea martinezii T. F. Patterson |
|
Zianis et al. (2005) |
| Abies vejarii Martínez |
|
Avendaño et al. (2009) |
| Pseudotsuga menziesii (Mirb.) Franco |
|
Návar (2009) |
| Cupressus arizonica Greene |
|
Vigil (2010) |
| Pinus ayacahuite Ehrenb. ex Schltdl. |
|
Návar (2009) |
| Pinus teocote Schiede ex Schltdl et Cham. |
|
Aguirre-Calderón y Jiménez-Pérez (2011) |
| Pinus pseudostrobus Lindl. |
|
Aguirre-Calderón y Jiménez-Pérez (2011) |
| Taxus globosa Schltdl |
|
Volume of a cone |
| Quercus spp |
|
Tomás (2013) |
| Otras hojosas |
|
Probosque (1990) |
V = Volume (m3 ha-1); AB = Aerial biomass (Mg ha-1); CS = Carbon stock (Mg ha-1); D = Diameter at breast height (m); H = Total height (m); R = Radius (D/2).
Half the tree species had allometric equations for estimating the CS; for the remaining species, the equations used for calculating the biomass multiplied by a factor (0.50) were utilized (IPCC, 2016). In the case of Picea martinezii T. F. Patterson, Taxus globosa Schltdl. and other leafy species, only volume equations have been generated; hence the multiplication by the factor 0.50 in order to obtain the approximate biomass (Silva-Arredondo and Návar-Cháidez, 2009). Oaks and other broadleaves were grouped into a single equation. Both the basal area and the carbon stock were calculated for each sampling site, subsequently extrapolating these estimates to a hectare in order to make inferences and comparisons with similar studies.
The importance value index (IVI) is a synthetic structural index developed mainly for the purpose of organizing the dominance of each species in mixed stands by hierarchies; it was calculated by adding the relative abundance, the relative density, and the relative frequency (Curtis and McIntosh, 1951) (Equation 2):
Where:
A rel = Relative abundance
D rel = Relative density
F rel = Relative frequency
For the estimation of relative abundance, the following equations, 3 and 4, were used:
Where:
A i = Absolute abundance
N i = Number of individuals of species i
S = Sampling surface area (ha)
A rel = Relative abundance of species i with respect to total abundance
Dominance was assessed with equations 5 and 6:
Where:
D i = Absolute dominance
Ab i = Basimetric area of species i
S = Sampled surface area (ha).
D rel = Relative dominance of species i with respect to total dominance
Relative frequency was assessed using equations 7 and 8:
Where
F i = Absolute frequency (percentage of presence at the sampling site)
f i = Number of sites where species i is present
S = Sampled surface area (ha)
N = Number of sampling sites
F rel = Relative frequency of species i with respect to total frequency
The horizontal diversity index of species is defined as the number of taxa in a surface area unit; it has two main components: richness (number of species) and equitability (number of individuals of a single species). One of the most commonly used is the Shannon-Wiener index (H’) (Shannon and Weaver, 1949) (Equation 9):
Where:
S = Number of species present
P i = Proportion of the species
p i = n i /N
n i = Number of individuals of species i
N = Total number of individuals
The vertical distribution of the species was estimated using the Pretzsch index (A) (Pretzsch, 2009), which uses different heights for detecting changes in diversity in the different strata of the forest (Equation 10).
Where:
S = Number of species present
Z = Number of height strata
pij = Percentage of species in each area
pij= nij/N
nij = Number of individuals of specie i in stratum j
N = Total number of individuals
Subsequently, a statistical model describing the relationship between them was generated. The analyses were carried out using the statistical package SPSS® version 22.0 (IBM Corporation, 2013). A variance analyses of a factor was applied, and the means were compared using Tukey’s test, whereby significant differences were obtained (p<0.05) (Zar, 2010).
Results and Discussion
Based on the similarity dendrogram, five groups were observed (Figure 2); the two with the largest difference (> 80 %) were sites 2 and 3, and 1 and 5. The former group was characterized by a north exposure, with slopes above 100 % and an altitude interval of 2 500 to 2 600 m; the latter group had a northeast exposure and slopes of 0 to 20 %, with an altitude interval of 2 600 to 2 800 m.

A third group was integrated with the sites of greatest similarity (of less than 30 %), which had an east exposure, an altitude above 2 900 m, and a slope of 0 to 40 %, although sites 7 and 8 were discriminated.
Sites 6 and 9 constituted the fourth group, located at an altitude gradient of 2 700 to 2 900 m, with a slope ranging between 20 and 40 %. Lastly, the fifth group comprised sites 4 and 10, which had a northeast exposure and an altitude interval of 2 500 to 2 700 masl.
In regard to the Importance Value Index (IVI), the highest specific weight was for the Pinus (sites 5, 6, 7, 8, 9), Quercus (sites 4, 10), Picea (site 1), Abies (site 2), and Cupressus genera (site 3). The species with the highest importance in most of the sampled sites were: Pinus teocote Schiede ex Schldl. et Cham. (sites 6 to 10) and Quercus cordifolia Trel. (8, 9 and 10) (Table 3). This behavior of the vegetation is due to the fact that these are mixed pine-oak forests.
Table 3 Ratio of species by sampling site and their IVI value.
| Species | Site | |||||||||
|---|---|---|---|---|---|---|---|---|---|---|
| 1 | 2 | 3 | 4 | 5 | 6 | 7 | 8 | 9 | 10 | |
| Abies vejarii Martínez | 16.81 | 33.04 | 32.31 | 6.24 | 1.80 | |||||
| Arbutus xalapensis HBK. | 1.06 | 7.60 | 4.50 | 11.14 | 12.22 | 6.24 | 7.53 | 4.73 | ||
| Carpinus caroliana Walter | 1.08 | |||||||||
| Cupressus arizonica Greene | 34.17 | 0.71 | ||||||||
| Picea martinezii T. F. Patterson | 29.06 | 8.53 | ||||||||
| Pinus pseudostrobus Lindl. | 1.52 | 14.13 | 4.12 | 11.46 | ||||||
| Pinus ayacahuite Ehrenb. ex Schltdl. | 12.67 | 2.15 | 12.07 | 1.07 | 37.60 | 4.21 | 12.94 | |||
| Pinus teocote Schiede ex Schltdl. et Cham. | 5.05 | 2.77 | 54.01 | 44.23 | 50.35 | 42.30 | 16.36 | |||
| Populus tremuloides Michx. | 3.45 | |||||||||
| Pseudotsuga menziesii (Mirb.) Franco | 9.83 | 1.61 | 9.10 | 1.74 | 4.14 | |||||
| Quercus affinis Scheidw. | 18.63 | 19.24 | 9.32 | 62.81 | 10.03 | |||||
| Quercus cordifolia Trel. | 43.41 | 41.85 | 50.36 | |||||||
| Quercus germana Schltdl. & Cham. | 8.92 | |||||||||
| Quercus greggii Trel. | 7.08 | |||||||||
| Quercus laeta Liebm. | 2.42 | 20.99 | ||||||||
| Quercus mexicana Humb. & Bonpl. | 15.68 | |||||||||
| Quercus polymorpha Cham. & Schltdl. | 6.96 | |||||||||
| Quercus sideroxyla Humb. & Bonpl. | 23.90 | 33.06 | 22.55 | |||||||
| Taxus globosa Schltdl | 13.01 | 9.58 | 1.50 | |||||||
| Ulmus crassifolia Nutt. | 1.07 | |||||||||
The highest number of species, 11, was registered at site 2, which was followed by site 4, with 10 species. Both sites have a north-northeast exposure and an altitude interval of 2 500 to 2 700 m. The site with the lowest number of taxa was 8, where only three species were identified and which has an east exposure and an altitude above 2 900 masl; sites 6 and 7 had four species; at the remaining sites, the number of taxa ranged between five and seven each (Table 3). This behavior shows that the higher the altitude, the lower the number of species per site (less diversity). At all the sites there was at least one taxon of the genus Pinus and one of the genus Quercus. Arbutus xalapensis was observed at eight sites; Pinus teocote (four of these with the highest IVI value), and P. ayacahuite at seven sites. The least abundant species (one per site) were: Quercus germana, Q. greggii, Q. mexicana, Q. polymorpha, Carpinus caroliana and Ulmus sp.
Most average heights ranged between 11.2 and 14.2 m, except at sites 1 and 3, where they were 16.9 to 20.5 m; the latter formed lush stands, dominated by Cupressus arizonica and Picea martinezii at locations with a north-northeast exposure. The largest average diameters were obtained from sites 3 and 9, where Cupressus arizonica and Pinus teocote are dominant (35.9 and 32.4 cm, respectively), while site 4 exhibited the smallest average diameter, of 18.1 cm; the dominant species at this site was Quercus affinis; the exposure of the site is northeast, and the altitude is less than 2 700 m.
The basimetrc area exhibited significant differences between the 10 sites (p=0.109); site 3 attained the highest value, with 49.01±7.74 m2 ha-1, and a greater presence of Cupressus arizonica. The lowest basal area was for site 8, with 22.67±2.5 m2 ha-1, consisting mainly of Pinus teocote, with an east exposure and an altitude >2 900 m. These figures are similar to those cited by Encinas-Domínguez et al. (2008) for a sacred fir forest in Coahuila (29.69 m2 ha-1); however, they are lower than those documented by Aguirre et al. (2003) for mixed forest in the northeast of the country (35.9 a 48.2 m2 ha-1), although these agree with the figures corresponding to site 3 (Table 4).
Table 4 Structural variables by site.
| Site | Average height (m) | Average diameter (cm) | G (m2 ha-1) | CS (Mg ha-1) | Pretzsch Index | Shannon’s Index |
|---|---|---|---|---|---|---|
| 1 | 16.96 ± 0.82 a | 23.94 ± 0.87 a | 23.20 ± 7.28 a | 83.90 ± 24.00 a | 2.40 | 1.37 |
| 2 | 14.21 ± 0.68 a,b | 21.29 ± 1.70 a,b | 29.94 ± 9.29 a | 111.23 ± 37.25 a | 2.53 | 1.78 |
| 3 | 20.57 ± 0.81 c | 35.96 ± 2.00 c | 49.01 ± 7.74 a | 123.49 ± 17.19 a | 2.32 | 1.48 |
| 4 | 12.43 ± 0.44 b | 18.10 ± 0.47 b | 31.89 ± 2.03 a | 71.31 ± 5.10 a | 2.01 | 1.23 |
| 5 | 13.02 ± 0.33 b | 24.27 ± 1.22 a,d | 33.44 ± 4.49 a | 94.70 ± 14.06 a | 2.27 | 1.57 |
| 6 | 13.92 ± 0.59 a,b | 29.53 ± 1.04 d,e | 27.01 ± 6.57 a | 71.73 ± 18.83 a | 1.50 | 0.95 |
| 7 | 12.10 ± 0.75 b | 24.61 ± 0.70 a,d | 33.22 ± 1.55 a | 91.81 ± 3.09 a | 2.21 | 1.26 |
| 8 | 13.00 ± 0.96 b | 25.86 ± 1.17 a,d | 22.67 ± 2.50 a | 58.36 ± 5.75 a | 1.61 | 0.83 |
| 9 | 13.42 ± 0.57 b | 32.45 ± 0.42 c,e | 28.68 ± 2.23 a | 82.95 ± 10.39 a | 1.85 | 0.91 |
| 10 | 11.28 ± 0.42 b | 21.50 ± 0.89 a,b | 28.70 ± 4.85 a | 81.46 ± 14.81 a | 2.27 | 1.36 |
G = Basimetric area; CS = Carbon stock. Means followed by different letters (a, b, c, d, e) indicate different levels of significance for p<0.05.
The average carbon stock in the 10 sites showed differences (p=0.354). The largest stock was found at site 3, with 123.48±17.19 Mg ha-1; followed by site 2, with 111.22±37.26 Mg ha-1; the representative species were Cupressus arizonica and Abies vejarii, respectively; these also registered the highest IVI value per site. The exposure was north, and the slopes were above 100 %. Certain authors like Razo-Zárate et al. (2013) cite values of 62.6 Mg ha-1 and 166.6 Mg ha-1 for similarly conserved and disturbed forests, respectively. Site 8 had the lowest CS, with 58.35±5.75 Mg ha-1, with Pinus teocote as it is the dominant species; it also had the lowest basimetric area. These sites have an altitude above 2 900 masl, with an east exposure, and they consist of stands with medium sized trees, compared to sites 3 and 2 (Table 4).
The Shannon-Wiener index at site 2 was H’=1.78 and H’ max =2.4, which are considered to be high, with 11 species -an evidence of a great diversity; it also had the second highest value for carbon stock. Whereas the lowest values were for site 8, with H’=0.83 and H’ max =1.1 (Figure 3a), with only three species; however, the values between H’ and H’max are similar, corresponding to a homogeneous distribution. These results are higher than those reported by Santibañez-Andrade et al. (2015) for a pine forest in the Valley of Mexico (H’=1.02-1.28). While López-Hernández et al. (2017) cite values of H’=1.37 in temperate forests under management; these figures are similar to the values obtained for sites 1, 3, 4, 7 and 10.
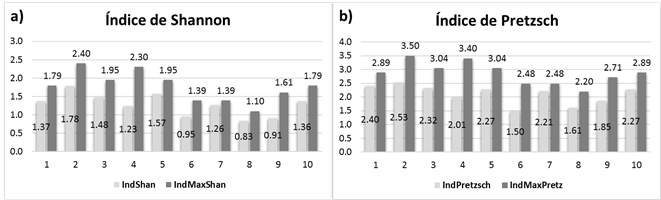
Figure 3 Diversity index charts and their maximum value per site; a) horizontal index (Shannon-Wiener), and b) vertical index (Pretzsch).
For the vertical structure, the values of the A (Pretzsch) index were calculated, these represent the diversity of species by vertical stratum. Site 2 had the highest A value (A=2.53 y A max =3.5); it is therefore not considered to be an even stand in terms of the tree heights. It also had the highest registers for horizontal diversity (H index); therefore, it is a stand with a broad vertical and horizontal diversity, with high dasometric values (average height, average diameter, basal area, and carbon stock), mainly due to its physiographic condition, which corresponds to an altitude below 2 500 m, i.e. lower than that of the rest of the studied sites. The lowest value (A=1.5 and A max =2.48) was estimated for site 6 (Figure 3b), although it is very similar to that of site 8 (A=1.61 and A max =2.20); this represented a mean uniformity that corresponds to the poorest conditions of the forest as to tree diversity, due mainly to its physiographic conditions (a slope of 20 to 40 % and an altitude of 2 700 to 2 900 m).
The high values for Pretzsch index suggest a larger diversity of species in the vertical structure; such was the case of 10 species at site 2 which, however, were not evenly distributed in all the strata. The values of site 7, whose A and A max are very similar, reflect a homogeneous distribution of the species in the three strata. These results agree with those cited by Rubio et al. (2014), with A max =3.74 and A=2.01 in mixed forests; however, they are high, compared with those of Villavicencio et al. (2006), who obtained A=2 y A max =2.7 for a pine-oak forest, where oak trees were dominant in all three strata.
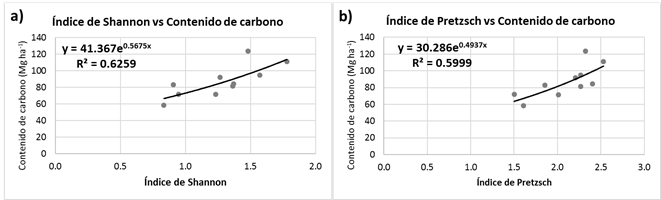
In order to describe the relationship between the carbon shock and the horizontal and vertical diversity, several regression models were generated. In the case of the Shannon-Wiener index, the best model was an exponential one (y=41.367e0.5675x), with a R2=0.62 (Figure 4a); for the Pretzsch index, it also was an exponential model (y=30.286e0.4937x), with a R2=0.59 (Figure 4b). They both had low R2, but a tendency was observed to exist between the studied variables (Figure 4) in which the carbon stock increases with larger diversity indexes. These positive ratios are due to the fact that there is a homogeneous distribution of the tree species within the study sites; furthermore, they are distributed through the three assessed vertical strata and they cover a larger surface area both vertically and horizontally.
Conclusions
It is concluded that there are variations in the composition and structure within the studied ecosystems, which consist primarily of pine-oak associations. In general, they are made up of medium-sized individuals (11 to 14 high) with 20-30 cm diameters.
There is a relationship between the carbon stock and the horizontal (Shannon-Wiener, H’) and vertical (Pretzsch, A) diversity indexes. Although the generated models have a low R2 (0.59 for H’ and 0.62 for A), they do reflect the relationship between the carbon stock and the diversity of tree species, both horizontal and vertical, and they evidence that the CS increases as the indexes become higher; therefore, one of the strategies to follow in the management plans would be to have evenly distributed species in the entire area and in the different vertical strata.
Acknowledgements
The authors wish to express their gratitude to the School of Forest Scences of the Universidad Autónoma de Nuevo León (UANL) for the facilities provided for the development of the field work
REFERENCES
Aguirre-Calderón, Ó. A. y J. Jiménez-Pérez. 2011. Evaluación del contenido de carbono en bosques del sur de Nuevo León. Revista Mexicana de Ciencias Forestales 2(6): 73-83. [ Links ]
Aguirre C., Ó. A., J. Pérez J., H. Kramer y A. Akça. 2003. Análisis estructural de ecosistemas forestales en Cerro del Potosí, Nuevo León, México. Ciencia UANL 6(2): 219-225. [ Links ]
Avendaño H., D. M., M. Acosta M., F. Carrillo A. y J. D. Etchevers B. 2009. Estimación de la biomasa y carbono en un bosque de Abies religiosa. Revista Fitotecnia Mexicana 32(3): 233-238. [ Links ]
Bannister, J. R. and P. J. Donoso. 2013. Forest Typification to Characterize the Structure and Composition of Old-growth Evergreen Forests on Chiloe Island, North Patagonia (Chile). Forests 4(4): 1087-1105. https://doi.org/10.3390/f4041087. [ Links ]
Bettinger, P., K. Boston, J. Siry and D. Grebner. 2008. Forest Management and Planning. Academic Press-Elsevier. San Diego, CA USA. 360 p. [ Links ]
Corral-Rivas, J. J., B. Vargas-Larreta, C. Wehenkel, Ó. A. Aguirre-Calderón, J. G. Álvarez-González y A. Rojo-Alboreca. 2009. Guía para el Estableciemiento de Sitios de Investigación Forestal y de Suelos en Bosques del Estado de Durango.Editorial UJED. El Salto, Durango, México. 81 p. [ Links ]
Curtis, J. T. and R. P. McIntosh. 1951. An Upland Forest Continuum in the Prairie-Forest Border Region of Wisconsin. Ecology 32(3): 476-496. [ Links ]
Encinas-Domínguez, J. A., F. J. Encina-Domínguez, E. Mata-Rocha and J. Valdes-Reyna. 2008. Aspectos estructurales, composición florística y caracterización ecológica del bosque de oyamel de la sierra de Zapalinamé, Coahuila, México. Boletín de la Sociedad Botánica de México 83: 13-24. [ Links ]
Gadow, K., v., S. Sánchez O. y J. G. Álvarez G. 2007. Estructura y Crecimiento del Bosque. https://www.researchgate.net/publication/265270198 Favor de dar VoBo y colocar la fecha de consulta (10 de agosto de 2017). [ Links ]
Gadow, K. v., C. Yu Zhang, C. Wehenke l, A. Pommerening, J. Corral-Rivas, M. Korol and X. H. Zhao. 2011. Forest Structure and Diversity. In: Pukkala, T, K. V. Gadow, J. Finland and M. Tomé (eds.). Continuous Cover Forestry. Series Managing Forest Ecosystems. Vol. 24. Springer. Heidelberg, Germany. pp. 29-83. [ Links ]
García, E. 2004. Modificaciones al sistema de clasificación climática de Köppen México 5a edición. Instituto de Geografia-UNAM. México, D.F., México. 90 p. [ Links ]
Halffter, G. 1998. A strategy for measuring landscape biodiversity. Biology International 36: 3-17. [ Links ]
IBM Corporation. 2013. IBM SPSS Statistics 22 Brief Guide. http://www.sussex.ac.uk/its/pdfs/SPSS_Brief_Guide_22.pdf (23 de diciembre de 2016). [ Links ]
Instituto Nacional de Geografía y Estadística (INEGI). 2016. Anuario Estadístico del Estado de Nuevo León. México: INEGI. http://www.datatur.sectur.gob.mx/ITxEF_Docs/NL_ANUARIO_PDF16.pdf (19 de julio de 2017). [ Links ]
Intergovernmental Panel on Climate Change (IPCC). 1996. Report of the twelfth session of the Intergovernmental Panel on Climate Change. Reference manual and work book of the IPPC 1996 revised guidelines for national greenhouse gas inventories. 11-13 September. Mexico City, Mexico. 73 p. [ Links ]
Jiménez, J., O. Aguirre and H. Kramer. 2001. Análisis de la estructura horizontal y vertical en un ecosistema multicohortal de pino-encino en el norte de México. Investigación Agraria. Sistemas y Recursos Forestales 10(2): 355-366. [ Links ]
João, P. and F. Carvalho. 2011. Composition and structure of natural mixed-oak stands in northern and central Portugal. Forest Ecologyand Management 262: 1928-1937. https://doi.org/10.1016/j.foreco.2011.04.020. [ Links ]
López-Hernández, J. A., Ó A. Aguirre-Calderón, E. Alanís-Rodríguez, J. C. Monarrez-González, M. A. González-Tagle and J. Jiménez-Pérez. 2017. Composición y diversidad de especies forestales en bosques templados de Puebla, México. Madera y Bosques 23: 39-51. https://doi.org/10.21829/myb.2017.2311518. [ Links ]
Magurran, A. E. 1988. Ecological Diversity and Its Measurement. Princeton University Press. Princeton, NJ, USA. 179 p. [ Links ]
Moreno, C. E. 2001. Métodos para medir la biodiversidad. Vol. 1. M&T-Manuales y Tesis SEA. Zaragoza, España. 84 p. [ Links ]
Návar, J. 2009. Allometric equations for tree species and carbon stocks for forests of northwestern Mexico. Forest Ecology and Management 257: 427-434. https://doi.org/10.1016/j.foreco.2008.09.028. [ Links ]
Pretzsch, H. 2009. Forest Dynamics, Growth and Yield. From Measurement to Model. Springer-Verlag Berlin Heidelberg. Berlin, Germany. https://doi.org/10.1007/978-3-540-88307-4. [ Links ]
PROBOSQUE. 1990. Segundo estudio dasonómico del Estado de México. SEDEMEX. Toluca, Edo. de Méx., México. 334 p. [ Links ]
Razo-Zárate, R., A. J. Gordillo-Martínez, R. Rodríguez-Laguna, C. C. Maycotte-Morales and O. A. Acevedo-Sandoval. 2013. Escenarios de carbono para el bosque de oyamel del Parque Nacional El Chico, Hidalgo, México. Revista Latinoamericana de Recursos Naturales 9(1):17-21. [ Links ]
Rubio C., E. A., M. A. González T., J. Jiménez P., E. Alanís R. y D. Y. Flores Á. 2014. Diversidad y distribución vertical de especies vegetales mediante el índice de Pretzsch. Ciencia UANL 65: 34-41. [ Links ]
Ruiqiang, N., Y. Baiketuerhan, C. Zhang, X. Zhao and K. v. Gadow. 2014. Analysing structural diversity in two temperate forest in northeastern China. Forest Ecology and Management 316: 139-147. https://doi.org/https://dx.doi.org/10.1016/j.foreco.2013.10.012. [ Links ]
Santibañez-Andrade, G., S. Castillo-Argüero y Y. Martínez-Orea. 2015. Evaluación del estado de conservación de la vegetación de los bosques de una cuenca heterogénea del Valle de México. Bosque 36(2): 299-313. https://doi.org/10.4067/S0717-92002015000200015 [ Links ]
Shannon, C. E. and W. Weaver. 1949. The Matematical Theory of Communication. University of Illinois Press Urban and Chicago. Chicago, IL, USA. 663 p. [ Links ]
Silva-Arredondo, F. M. y J. de J. Návar-Cháidez. 2009. Estimación de factores de expansión de carbono en comunidades forestales templadas del norte de Durango, México. Revista Chapingo Serie Ciencias Forestales y del Ambiente 15(2):155-160. [ Links ]
Tomás M., C. E. 2013. Estimación de biomasa y carbono mediante ecuaciones alométricas en Quercus laurina Humb. y Quercus rugosa Née en predios bajo manejo del ejido San Pablo Ixayoc, Estado de México. Tesis ingeniero forestal. Universidad Autónoma Chapingo. Chapingo, Edo. de Méx., México. 54 p. [ Links ]
Vigil N., N. 2010. Estimación de biomasa y contenido de carbono en Cupressus lindleyi Klotzsch ex Endl. en el campo forestal experimental Las Cruces, Texcoco, México. Tesis ingeniero forestal. Universidad Autónoma Chapingo. Chapingo, Edo. de Méx., México. 61 p. [ Links ]
Villavicencio G., R., P. Bauche P., A. Gallegos R., A. L. Santiago P. y F. M. Huerta M. 2006. Caracterización estructural y diversidad de comunidades arbóreas de La Sierra de Quila Departamento. Boletín IBUG 13(1): 67-76. [ Links ]
Wehenkel, C., J. J Corral-Rivas, J. C. Hernández-Díaz and K. v. Gadow. 2011. Estimating balanced structure areas in multi-species forests on the Sierra Madre Occidental , Mexico. Annals of Forest Science 68: 385-394. https://doi.org/10.1007/s13595-011-0027-9. [ Links ]
Zar, J. H. 2010. Biostatistical analysis. 5th ed. Prentice Hall. Englewood Cliffs, NJ, USA. 663 p. [ Links ]
Zianis, D., P. Muukkonen, R. Mäkipää and M. Mencuccini. 2005. Biomass and Stem Volume Equations for Tree Species in Europe. Silva Fennica. Monographs 4. Tammer-Paino. Tampere, Finland. 63 p. [ Links ]
Received: January 12, 2018; Accepted: June 28, 2019
 Este es un artículo publicado en acceso abierto bajo una licencia
Creative Commons
Este es un artículo publicado en acceso abierto bajo una licencia
Creative Commons
