


Servicios Personalizados
Revista
Articulo
 texto en
  Inglés (pdf)
 Artículo en XML
 Referencias del artículo
 Enviar artículo por email
Indicadores
-
 Citado por SciELO
 -
 Accesos
Links relacionados
-
 Similares en
SciELO
Similares en
SciELO
Compartir

 Permalink
Revista mexicana de ciencias forestales
versión impresa ISSN 2007-1132
Rev. mex. de cienc. forestales vol.10 no.53 México may./jun. 2019
https://doi.org/10.29298/rmcf.v10i53.173
Articles
Diversity and vertical structure of the pine-oak forest in Guadalupe y Calvo, Chihuahua
1Facultad de Ciencias Agrícolas y Forestales, Universidad Autónoma de Chihuahua. México.
Areas with and with no forest management from UMAFOR 0808 Guadalupe y Calvo, Chihuahua; under the Mexican Management Method of Irregular Forests (MMOBI) were evaluated. The information from 95 clusters of the National Forest and Soil Inventory (2004-2009) in areas with management and 27 unmanaged conglomerates were analyzed and compared. The vertical structure was determined by means of natural regeneration, strata of tree height and sociological position. The species with a continuous distribution from the lower stratum of regeneration to the upper tree stratum in the forest under management were: Pinus durangensis, P. arizonica, P. ayacahuite, P. herrerae, and P.engelmannii; while in the forest without management were: P. durangensis, and P. arizonica. The main differences found among the studied forests is the average height in the upper tree stratum; since in the managed forests it was 30.16 m, while in the unmanaged forest its value was 21.86 m. In addition, greater regeneration of P. durangensis was observed in the areas under management. Regarding the diversity of species between both forests, it was found that there is no significant difference (p>0.05). Therefore, it is concluded that according to the analyzed information, the regulation of timber exploitation with the MMOBI allows to maintain structural and species diversity, similar to that of a natural forest without management.
Key words: Effect of forest management; Mexican Management Method of Irregular Forests; Pinus durangensis Martínez; sociological position; natural regeneration; Sierra Madre Occidental
Se evaluaron áreas con y sin manejo forestal de la Umafor 0808 Guadalupe y Calvo, Chihuahua; gestionadas mediante el Método Mexicano de Ordenación de Bosques Irregulares (MMOBI). Se analizó y comparó la información de conglomerados del Inventario Nacional Forestal y de Suelos (2004-2009); 95 en masas con manejo y 27 sin manejo. Se determinó la estructura vertical por medio de la regeneración natural, pisos de altura de los árboles y posición sociológica. Las especies con distribución continua, desde el piso inferior de la regeneración hasta el piso arbóreo superior en el bosque con manejo fueron: Pinus durangensis, P. arizonica, P. ayacahuite, P. herrerae y P.engelmannii; mientras que, en el bosque sin manejo se registraron: P. durangensis y P. arizonica. Las principales diferencias entre los bosques estudiados correspondieron al promedio de altura en el piso arbóreo superior; en los bosques con manejo fue de 30.16 m y en los sin manejo, su valor fue de 21.86 m; además, se observó una mayor regeneración de P. durangensis en los primeros. Respecto a la diversidad de especies, no hubo diferencia significativa entre ambos tipos de bosque (P>0.05). Por lo anterior, se concluye que, de acuerdo con la información analizada, la regulación del aprovechamiento maderable con el MMOBI permite mantener la diversidad estructural y de especies, similar a la de un bosque natural sin manejo.
Palabras clave: Efecto del manejo forestal; Método Mexicano de Ordenación de Bosques Irregulares; Pinus durangensis Martínez; posición sociológica; regeneración natural; Sierra Madre Occidental
Introduction
Distributed in the Sierra Madre Occidental (SMO) are 24 Pinus taxa (46 % of the national total), 54 of Quercus (34 %) and seven of Arbutus (100 %), which are the main physiognomic components of the forests in this region. Pine forests cover 30 197 km2, which represent 12 % of the surface area of the SMO, at an altitude between 1 600 and 3 320 masl, while pine-oak forests cover 76 265 km2, i.e. 30 % (González et al., 2012). Both types of vegetation grow in temperate semi-cold and temperate semi-dry climates. They have a great biodiversity and provide considerable ecological and economic benefits (Semarnat, 2012).
The state of Chihuahua has an area of 24.7 million hectares, of which 7.08 million (28.66 %) are temperate forests. The pine and pine-oak forests are the main ecosystems under exploitation and provide a great diversity of environmental goods and services to rural and urban communities (Gobierno del Estado de Chihuahua et al., 2016). Forest Management Unit (Umafor) No. 0808, in the Guadalupe y Calvo municipality, Chihuahua, is one of the most relevant for its contribution to the timber production of the state. Thus, as indicated by Delgado et al. (2016), it is important to know the structure, composition and diversity of tree species of these forests in order to plan their sustainable management and determine their conservation status.
Jiménez et al. (2001) indicate that the Importance Value Index, among other parameters, determines the horizontal structure of plant communities. On the other hand, Del Río et al. (2003) suggest that a description of the vertical structure of its components is necessary to characterize a multicohortal and uneven-aged community.
Forest use modifies the forest in terms of its structure, composition and growth dynamics (Del Río et al., 2003; Folke et al., 2004). At the stand level, irregular management practices focus more on forming a vertical structure that creates heterogeneous masses. It is important to note that multicohort stands are properly distributed across the entire landscape. A balanced vertical structure is achieved by regenerating fractions of the stand at different times at the level of individuals, groups or strips (Aguirre, 1997).
For the planning, management and conservation of arboreal communities, the study of floristic structure and diversity is important (Villavicencio et al., 2006). On the other hand, the assessment of diversity contributes to know the effect of forest exploitation on tree species and determine the practices that allow achieving sustainable forest management (Aguirre et al., 2008).
Therefore, the purpose of this study was to determine if the vertical structure and diversity of the irregular pine-oak forest is different between forests with and without forest management.
Materials and Methods
Study Area
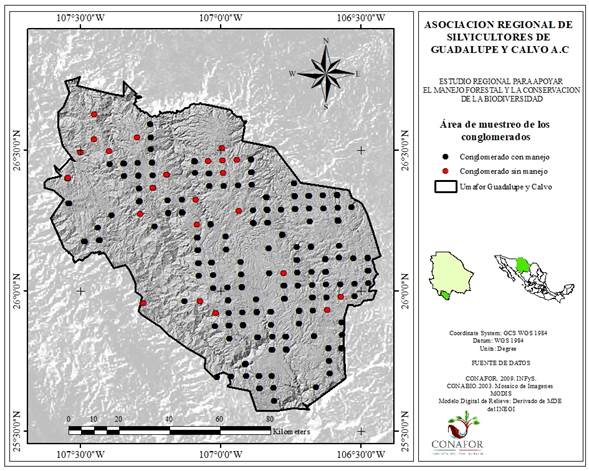
The work was carried out in the Forest Management Unit (Umafor) No. 0808, located in the Guadalupe y Calvo municipality, in the south of the state of Chihuahua (Figure 1). This Umafor has an area of 904 780 ha, with four main climates: warm, semi-dry, semi-warm and temperate, of which the last two predominate (Asociación Regional de Silvicultores de Guadalupe y Calvo A.C.- Conafor-ProÁrbol- Secretaría de Desarrollo Rural del Gobierno del Estado de Chihuahua-Semarnat, 2009). The main soil types were classified according to the definition of soil units proposed by FAO / UNESCO are: Acrisol, Pheozem, Regosol, Planosol, Litosol and Cambisol.
The type of vegetation analyzed was pine-oak forest, which provides the industry with a wide variety of raw materials of great economic importance.
Sample analysis
Data from the National Forest and Soil Inventory 2004-2009 (Scale 1: 250 000) were used, extracting those corresponding to pine-oak forest. There were 95 clusters under management and 27 without management (Figure 1), which make up a network of points distributed every 5 km; each one consists of four sites of 400 m2 for the inventory of trees, one central and the remaining three arranged in the form of an inverted "Y" with respect to the north. Additionally, In order to evaluate repopulation, a concentric site of 12.56 m2 was plotted within each site (Figure 2).

For the analysis of the information, the following data were used: treatment (with or without handling), gender, species, normal diameter and total height. Within the sample plots of 400 m2, all trees with a diameter, at 1.30 m in height, equal to or larger than 7.5 cm, were inventoried.
In the repopulation inventory, frequency was recorded by genus and species present, based on height ranges. In order for an individual to be considered as part of the repopulation within the sub-plot of 12.56 m2, it should have height equal to or greater than 25 cm and normal diameter of less than 7.5 cm.
Data analysis
The vertical structure of the forest was evaluated with tree species and natural regeneration. The arboreal stratum was divided into layers of height, according to the methodology of Lamprecht (1990), which considers the maximum height and divides it into three different layers, as indicated below:
Upper layer (height> 2/3 of the upper height)
Medium layer (height between 2/3 and 1/3 of the upper height)
Low layer (height <1/3 of the top height)
Natural regeneration was divided into three size categories: lower, 0.25 to 1.5 m; medium, 1.50 to 2.75 m; and higher, above 2.75 m, as long as the normal diameter measures less than 7.5 cm, according to the data analysis criteria of the national forest and soil inventory (Conafor, 2012).
To determine the Phytosociological Value of each species per layer, it was carried out according to Finol (1976):
Where:
VFe = Phytosociological Value of the species in the layer
n = Number of individuals of the species in the layer
N = Total number of individuals in the layer
e = Species
In the determination of the sociological position of the arboreal stratum, the method of Finol (1971) was used, which assigns to each layer a phytosociological value that is obtained by dividing the number of individuals of each layer by the total number of individuals. The corresponding formula is the following:
Where:
VFi = Phytosociological Value of the layer
n = Number of individuals of the layer
N = Total number of individuals on the three layers
i = Layer
The relative sociological position was determined using the following formula:
Where:
PSr = Relative sociological position of the layer
VF = Phytosociological Value of the lower (i), medium (m), upper (s); layer
n = Number of individuals of the lower (i), medium (m), upper (s); layer
In order to calculate the absolute sociological position of each species in the tree stratum, the phytosociological values of each layer were added. These values were estimated based on the VF of the layer in question and the number of individuals of the species in that same layer:
Where:
PSa = Absolute sociological position of each species
VF = Phytosociological Value of the lower (i), medium (m), upper (s); layer
n = Number of the individuals of each species
The relative sociological position (PSre) of one species in the forest (considering the three layers) was determined as the percentage over the total sum of the absolute values:
Where:
PSre = Relative sociological position of each species
PSa = Absolute sociological position of each species
The calculations of the Absolute Size Category of Natural Regeneration (CTaRN for its acronym in Spanish) and the Phytosociological Value were made in a similar way to that of the tree stratum:
Where:
CTaRN = Absolute Size Category of Natural Regeneration
VFrn = Phytosociological Value of the low (i), medium (m) and superior size category (s)
n = Number of individuals of the Size Category of Natural Regeneration
The Phytosociological Value of natural regeneration was determined according to the formula:
Where:
VFrn(j) = Phytosociological Value of the j size category
Nj = Total number of individuals of the j size category
N = Total number of individuals of natural regeneration
Shannon-Wiener Index
The calculation of alpha diversity was made with the Shannon-Wiener index (Magurran, 1988). This index is used to assess the diversity of a community, consider the number of species (richness) and their relative abundance. Its value increases with the number of species and with the equity of these (Moreno, 2001). This calculation was made with the PAST 3.15 software:
Where:
H = Shannon-Wiener diversity index
pi = Rate of individuals or relative abundance of the jth species and it is estimated through ni/N
ni = Total of individuals of the jth species
N = Total number of sampled individuals
Pielou Index
This index evaluates the uniformity of the relative abundance of the species determined with the Shannon-Wiener index. It acquires values ranging from 0 to 1, where one corresponds to the maximum equity of all species (Magurran, 1988):
Where:
J = Pielou index
H’ = Shannon-Wiener index
S = Species richness
Hutchenson diversity t test
The contrast of the diversity between forests with and without management, estimated by the Shannon-Wiener index, was determined by the Hutchenson t test, which establishes whether the difference between two samples is significant (p ≤ 0.05). This is based on the variance and degrees of freedom calculated for the Shannon-Wiener index (Hutchenson, 1970; Magurran, 1988).
Where:
Results and Discussion
The height layers were defined according to the maximum height of the forest under management and without management, which were 42.0 and 30.5 m, respectively (Table 1).
Table 1 Height layers of the pine-oak forest in UMAFOR No. 0808.
| Layer | Under management (m) |
Without management (m) |
|---|---|---|
| Lower | 0.0-14.0 | 0.0-10.16 |
| Medium | 14.1-28.1 | 10.17-20.33 |
| Upper | >28.1 m | >20.33 |
Based on the relative Phytosociological Value (VFr), the predominant species in the lower forest layer under management were Pinus durangensis Martínez with 18.42 %, Quercus sideroxyla Humb. & Bonpl 10.05 %, Quercus fulva Liebm. 9.91 %, Pinus arizonica Engelm. 8.31 % and Arbutus xalapensis Kunth 8.02 %.
In the medium layer, the outstanding species were Pinus durangensis with 31.37 %; Pinus arizonica, with 13.36 %; Pinus lumholtzii Robins & Fern, with 8.53 %, and Pinus ayacahuite Ehrenb. ex Schltdl., with 6.98 %.
In the upper layer, Pinus arizonica was the most abundant, with 39.39 %, having presence in all the layers of the vertical structure. However, it was not the most dominant species in the lower and middle layers. The second place is occupied by Pinus durangensis with 27.27 %, followed by Pinus engelmannii, with 15.15 %, and by Pinus leiophylla Schl. & Cham (9.09 %) and Pinus ayacahuite (3.03 %). The genus that contributes the most is Pinus, followed by Quercus, with more than 80 % in each of the layers.
According to Lamprecht (1990), there are species that exhibit continuous vertical distribution behavior, that is, they are present in all the layers. Also, Acosta et al. (2006) state that a species ensures its permanence in the composition and structure of the forest if it is present in all of its layers. In the present study the species with continuous vertical distribution are: Pinus durangensis, Pinus arizonica, Pinus leiophylla, Pinus ayacahuite, Pinus herrerae Martínez, Pinus engelmannii and Pinus chihuahuana Engelm. On the other hand, Alanís-Rodríguez et al. (2010) mentions that, in post-fire restored areas in Pinus-Quercus forests, not all species are found in all layers.
In the managed pine-oak forest, the lower layer had the highest percentage of individuals, with 84.22 %; the middle layer had 15.32 %, and the upper layer had 0.44 % (Figure 3). In this regard, Acosta et al. (2006) mention that when the number of individuals in the lower layer is greater than those in the middle layer, it corresponds to a forest in regeneration, as observed in the present study.

In the unmanaged forest, the lower layer represents 67.67 % and the following species predominated: Pinus durangensis (19.13 %), Arbutus xalapensis (12.28 %), Quercus fulva (12.12 %), Quercus sideroxyla (8.93 %) and Pinus arizonica (6.85 %). All these species were important in the managed forests as well.
The medium layer comprises 28.61%, and Pinus durangensis was the most important species with 29.16 %, followed by Pinus herrerae with 11.93 %, Pinus arizonica 7.38 %, Pinus lumholtzii 5.49 % and Pinus teocote Schiede ex Schltdl. & Cham. with 5.49 %.
Finally, the upper layer comprises only 3.61 % and is made up of Pinus durangensis, with an important value of 64.17 %; Pinus teocote Schiede ex Schltdl, with 11.94 %; Pinus herrerae, with 8.95 %; Pinus lumholtzii and Pinus engelmannii, with 2.98 %, and Juniperus deppeana Steud and Pinus oocarpa Shiede, with 1.43 %. This implies that the Pinus genus is present in all the layers, predominating in the upper layer and therefore, according to Human (2000), this genus belongs to this stratum. In coincidence with the area under management, Pinus and Quercus were structural dominants.
Most of the individuals were concentrated in the lower layer, which coincides with what Castellanos-Bolaños et al. (2010) reported for a temperate cold climate forest in Oaxaca, as did Zarco-Espinosa et al. (2010) in relation to the tree structure of an unmanaged tropical forest in southeastern Mexico. According to these authors, most tree species are represented by a few small, scattered individuals. In this regard, in the present study the species that had a continuous distribution in the unmanaged forest were Pinus durangensis, Pinus arizonica, Pinus herrerae, Juniperus deppeana, Pinus lumholtzii, Pinus teocote, Pinus engelmannii and Pinus oocarpa. As in the forest under management, the lower height layer recorded the highest percentage of individuals, of 67.67 % (Figure 2).
The analysis of the relative sociological position found that the most common species in the three layers of the vertical structure of the managed forest were Pinus durangensis (18.87 %), Quercus sideroxyla (9.91 %), Quercus fulva (9.59 %), Pinus arizonica (8.49 %) and Arbutus xalepensis (7.75 %), and those with the least presence were Quercus coccolobifolia Trel (2.08 %), Pinus engelmannii (1.95 %), and Alnus acuminata Kunth (1.77 %). In addition, there are 25 more species with a lower participation (Table 2). Alonso-Torrens et al. (2016) found that the most dominant species are those of the Pinaceae family.
Table 2 Abundance and relative sociological position (PSr) of the pine-oak forest with and without management.
| Species | Forest with management | Forest without management | ||
|---|---|---|---|---|
| Abund. (%) | PSr. (%) | Abund. (%) | PSr. (%) | |
| Pinus durangensis Martínez | 20.44 | 18.87 | 23.81 | 20.95 |
| Quercus sideroxyla Humb. & Bonpl. | 9.35 | 9.91 | 7.52 | 8.37 |
| Quercus fulva Liebm. | 8.42 | 9.59 | 9.42 | 10.95 |
| Pinus arizonica Engelm. | 9.22 | 8.49 | 7.03 | 6.99 |
| Arbutus xalapensis Kunth | 6.77 | 7.75 | 8.82 | 10.72 |
| Pinus lumholtzii B.L.Robins & Fernald | 6.21 | 5.91 | 3.92 | 3.63 |
| Pinus leiophylla Schltdl. & Cham. | 5.36 | 5.72 | 1.79 | 1.65 |
| Pinus ayacahuite Ehrenb. ex Schltdl. | 5.62 | 5.44 | 3.37 | 3.12 |
| Juniperus deppeana Steud. | 4.52 | 5.06 | 3.26 | 3.70 |
| Quercus crassifolia Bonpl. | 2.74 | 3.01 | 5.61 | 6.30 |
| Pinus herrerae Martínez | 3.36 | 2.87 | 5.77 | 4.36 |
| Quercus rugosa Née | 2.41 | 2.62 | 2.94 | 3.36 |
| Quercus arizonica Sarg. | 2.35 | 2.56 | 4.35 | 5.37 |
| Quercus coccolobifolia Trel. | 1.81 | 2.08 | 0.81 | 0.78 |
| Pinus engelmannii Carr. | 2.51 | 1.96 | 1.25 | 0.96 |
| Alnus acuminata Kunth. | 1.63 | 1.77 | 1.14 | 0.95 |
| Pinus chihuahuana Engelm. | 1.20 | 0.97 | 0.32 | 0.25 |
| Pinus teocote Schiede ex Schltdl. & Cham. | 1.16 | 0.97 | 2.77 | 1.82 |
| Alnus oblongifolia Torr. | 0.63 | 0.57 | 1.64 | 1.77 |
| Arbutus arizonica (A.Gray) Sarg. | 0.41 | 0.47 | 0.05 | 0.06 |
| Quercus acuminata Roxb. | 0.40 | 0.40 | 0.59 | 0.51 |
| Quercus hypoleucoides A.Camus | 0.39 | 0.37 | 0.05 | 0.06 |
| Pseudotsuga menziesii (Mirb.) Franco | 0.47 | 0.35 | 0.00 | 0.00 |
| Alnus firmifolia Fernald | 0.30 | 0.30 | 0.00 | 0.00 |
| Pinus oocarpa Shiede ex Schltdl. | 0.52 | 0.29 | 1.19 | 0.84 |
| Quercus depressipes Trel. | 0.23 | 0.26 | 0.00 | 0.00 |
| Quercus durifolia Seemen ex Loes. | 0.34 | 0.25 | 0.05 | 0.06 |
| Arbutus glandulosa | 0.20 | 0.23 | 0.00 | 0.00 |
| Quercus viminea Trel. | 0.22 | 0.23 | 0.76 | 0.67 |
| Pinus douglasiana Martínez | 0.20 | 0.16 | 1.08 | 0.97 |
| Pinus cooperi C.E.Blanco | 0.14 | 0.16 | 0.00 | 0.00 |
| Abies durangensis Martínez | 0.11 | 0.13 | 0.00 | 0.00 |
| Juniperus monosperma (Engelm.)Sarg. | 0.19 | 0.10 | 0.00 | 0.00 |
| Quercus laeta Liebm. | 0.09 | 0.09 | 0.00 | 0.00 |
| Quercus tarahumara Spellenb., J.D.Bacon & Breedlove | 0.03 | 0.04 | 0.00 | 0.00 |
| Quercus salicifolia Née | 0.02 | 0.03 | 0.00 | 0.00 |
| Quercus felipensis Trel. | 0.01 | 0.01 | 0.00 | 0.00 |
| Quercus radiata Trel. | 0.01 | 0.01 | 0.54 | 0.68 |
| Quercus leiophylla A.D.C. | 0.01 | 0.00 | 0.00 | 0.00 |
| Quercus tuberculata Liebm. | 0.00 | 0.00 | 0.10 | 0.09 |
| Acacia brandegeana I.M.Johnst. | 0.00 | 0.00 | 0.05 | 0.06 |
| Total | 100.0 | 100.00 | 100.00 | 100.00 |
In the pine-oak forest without management, the results indicate that the species with the greatest presence in the three levels were: Pinus durangensis, with 20.76 %, Quercus fulva, 10.86 %, Arbutus xalapensis, 10.62 %, Quercus sideroxyla 8.30 %, and Pinus arizonica, with 6.93 %; while Pinus teocote, with 1.80%; Pinus leiophylla, with 1.64 %, and Quercus candicans Née, with 1.31 %, were the species with the least presence. In addition, other 19 species had a phytosociological value of less than 1%.
In the natural regeneration of the managed forest, the lower layer had the highest percentage of individuals, with 74.96 %; the medium layer had 15.66 %, and the upper layer, 9.38 %; while the unmanaged forest had a similar behavior, with values of 76.69 %, 18.16 % and 5.15 % respectively. This is considered reasonable because, as individuals grow, competition increases and therefore mortality does too.
On the other hand, the Pinus and Quercus genera predominate in the three regeneration levels of the forest with and without management, where Pinus durangensis stands out as the dominant species, except in the lower layer of the unmanaged forest, where Quercus rugosa dominates.
In regard to natural regeneration, of the total number of species present in the forest under management, the lowest category of regeneration has 93.93 % of the species present, and 75.60 % of them reach the arboreal level. The middle and upper categories of regeneration have 60.60 % of the said species present in the regeneration, and 41.78 % of them are consolidated as trees. It is also important to indicate that, of the seven species that have continuous vertical distribution in the tree stratum, only P. leiophylla and P. chihuahuana do not occur in the three levels of regeneration. This ensures the permanence of the five species found in all regeneration and woodland flats in the forests studied.
The lowest layer of the unmanaged forest has 91.30 % of the total species with regeneration, and only 51.21 % of them reach the arboreal layer; the middle layer has 65.21 % of the species with regeneration, and only 36.58 % become consolidated as trees. The lower layer of regeneration gathered 34.78 % of the species, of which only 19.51 % are grouped in the arboreal layer. In this case, the only species that has a continuous vertical distribution, both in regeneration and in the tree stratum, are Pinus durangensis and Pinus arizonica, which implies their competitive advantage over the rest of the species.
These results coincide with those of Hernández (2007), who reveals a homogenization of the forest after the application of the treatments, in this case with and without management, and also reports that it benefits the species of economic importance slightly. This agrees with what was indicated by Taylor (2016), who in a conifer forest in the Highlands of Chiapas, found an absence of many tree species, which is due to the forms of management utilized, i.e. through selective felling and promotion of the regeneration of fast-growing species with the highest economic value, such as pines.
The richness of the arboreal stratum with and without management was 41 and 34 species respectively. The values obtained for the Shannon-Wiener diversity index (H') were 2.773 and 2.723 for both forests, which are similar to those described by Hernández-Salas et al. (2013) for forests under management, with similar characteristics, in northwestern Mexico. Likewise, Graciano et al. (2017) determined a richness of 12 species and an H’ of 1.74 for a mixed pine-oak forest of Durango, and Méndez et al. (2018) reported a richness of five species and an H’ of 0.78 for a forest of the same type in the Sierra Madre del Sur.
On the other hand, with the Pielou index, values of 0.7468 and 0.7721 were obtained in forests with and without management, respectively. Based on this, and because the values of this index range from 0 to 1, we infer that in the present study the equitability of the abundance of their species is medium to high.
As for the statistical analysis carried out using the Hutchenson t test for the Shannon-Wiener diversity index, the difference between pine-oak forest with and without management was not significant (P> 0.05).
Conclusions
In the managed forest, five pine species with continuous vertical distribution are presented, both in the regeneration and in the tree stratum, while in the forest without management, only two of these pine species maintain this distribution.
Pinus durangensis is the predominant species considering the three levels of regeneration and trees, both in managed and unmanaged forests.
The vertical structure of the forests studied is similar in terms of the percentage of individuals per layer, with a greater number of individuals in the lower layer of regeneration and woodland, which means that they are considered regenerating forests.
The species with the best sociological position with and without management are Pinus durangensis, Quercus sideroxyla, Quercus fulva, Pinus arizonica and Arbutus xalapensis; they are also the most abundant.
The forests that are being exploited through the MMOBI maintain a statistically similar diversity to that of the unmanaged forest.
Acknowledgements
The authors wish to express their gratitude to the National Forestry Commission (Comisión Nacional Forestal) in Chihuahua for the data provided form the 2005 - 2009 National Inventory of Forests and Soils (Inventario Nacional Forestal y de Suelos 2005 - 2009) and to Umafor No. 0808 for granting access to its internal documents.
REFERENCES
Acosta, V. H., P. A. Araujo y M. C. Iturre. 2006. Caracteres estructurales de las masas. Serie didáctica Núm. 22. Universidad Nacional de Santiago del Estero, Argentina. http://fcf.unse.edu.ar/archivos/series-didacticas/SD-22-Caracteres-estructurales-ACOSTA.pdf (11 de marzo de 2019). [ Links ]
Aguirre C., O. 1997. Hacia el manejo de ecosistemas forestales. Madera y Bosques 3(2): 3-11. [ Links ]
Aguirre C., O., J. Corral-Rivas, B. Vargas L. y J. Jiménez P. 2008. Evaluación de modelos de diversidad-abundancia del estrato arbóreo en un bosque de niebla. Revista Fitotecnia Mexicana 31(3): 281-289. [ Links ]
Alanís-Rodríguez, E., J. Jiménez-Pérez, M. Pando-Moreno, O. A. Aguirre-Calderón, E. J. Treviño-Garza y P. A. Canizales-Velázquez. 2010. Análisis de la diversidad arbórea en áreas restauradas post-incendio en el parque ecológico Chipinque, México. Acta Biológica Colombiana 15(2): 309-324. [ Links ]
Asociación Regional de Silvicultores de Guadalupe y Calvo A.C.-Comisión nacional Forestal-ProÁrbol-Secretaría de Desarrollo Rural del Gobierno del Estado de Chihuahua-Secretaría de Medio Ambiente y Recursos Naturales (Asociación Regional de Silvicultores de Guadalupe y Calvo A.C.- Conafor-ProÁrbol- Secretaría de Desarrollo Rural del Gobierno del Estado de Chihuahua-Semarnat). 2009. Unidad de Manejo Forestal 0808 Guadalupe y Calvo (Umafor 0808). Estudio regional forestal: unidad de manejo forestal Núm. 0808 “Guadalupe y Calvo, Chihuahua”. http://www.conafor.gob.mx:8080/documentos/docs/9/1147ERF_UMAFOR0808.pdf (18 de junio de 2017). [ Links ]
Castellanos-Bolaños, J. F., E. J. Treviño-Garza, O. A. Aguirre-Calderón, J. Jiménez-Pérez y A. Velázquez-Martínez. 2010. Diversidad arbórea y estructura espacial de bosques de pino-encino en Ixtlán de Juárez, Oaxaca. Revista Mexicana de Ciencias Forestales 1 (2): 39-52. http://www.scielo.org.mx/scielo.php?script=sci_arttext&pid=S200711322010000200004&lng=es&tlng=es (15 de diciembre de 2017). [ Links ]
Comisión Nacional Forestal (Conafor). 2012. Inventario nacional forestal y de suelo. Informe 2004 -2009. http://www.ccmss.org.mx/descargas/Inventario_nacional_forestal_y_de_suelos_informe_2004_-_2009_.pdf (9 de julio 2017). [ Links ]
Del Río, M., F. Montes, I. Cañellas y G. Montero. 2003. Revisión: Índices de diversidad estructural en masas forestales. Investigación Agraria. Sistemas y Recursos Forestales 12(1): 159-176. [ Links ]
Delgado Z., D. A., S. A. Heynes S., M. D. Mares Q., N. L. Piedra L., F. I. Retana R., K. Rodríguez C., A. I. Villanueva H., M. S. González E. y L. Ruacho G. 2016. Diversidad y estructura arbórea de dos rodales en Pueblo Nuevo, Durango. Revista Mexicana de Ciencias Forestales 7(33): 94-107. [ Links ]
Finol U., H. 1971. Nuevos parámetros a considerarse en el análisis estructural de las selvas vírgenes tropicales. Revista Forestal Venezolana 14(21): 29-42. [ Links ]
Finol U., H. 1976. Métodos de regeneración natural en algunos tipos de bosques venezolanos. Revista Forestal Venezolana 19(26): 17-44. [ Links ]
Folke, C., S. Carpenter, B. Walker, M. Scheffer, T. Elmqvist, L. Gunderson and C. S. Holling. 2004. Regime shifts, resilience, and biodiversity in ecosystem management. Annual Review of Ecology, Evolution, and Systematics 35: 557-581. [ Links ]
Gobierno del Estado de Chihuahua, C. Luján A., J. M. Olivas G. y S. Vázquez A. 2016. Programa de Desarrollo Forestal Sustentable Chihuahua 2015. Gobierno del Estado de Chihuahua, Secretaría de Desarrollo Rural, Dirección de Desarrollo Forestal. Chihuahua, Méx. http://www.cnf.gob.mx:8090/snif/seif_chihuahua/normateca/instrumentos-de-planeacion/programadedesarrolloforestalsustentable (21 de junio de 2018). [ Links ]
González E., M. S., M. González E., J. A. Tena F., L. Ruacho G. e I. L. López E. 2012. Vegetación de la Sierra Madre Occidental, México: Una síntesis. Acta Botánica Mexicana 100: 351-403. [ Links ]
Graciano, G., O. A. Aguirre, E. Alanís y J. E. Lujan. 2017. Composición, estructura y diversidad de especies arbóreas en un bosque templado del Noroeste de México. Ecosistemas y Recursos Agropecuarios 4(12):535-542. [ Links ]
Hernández L., I. 2007. Cambios en la estructura y composición del bosque bajo dos tratamientos silviculturales en la comunidad de Capulálpam de Méndez, Ixtlán, Oaxaca, México. Tesis de Maestría. CATIE, Turrialba, Costa Rica. http://www.sidalc.net/cgi-bin/wxis.exe/?IsisScript=orton.xis&method=post&formato=2&cantidad=1&expresion=mfn=083182 (8 de marzo de 2019). [ Links ]
Hernández-Salas, J., O. A. Aguirre-Calderón, E. Alanís-Rodríguez, J. Jiménez-Pérez, E. J. Treviño-Garza, M. A. González-Tagle, C. Luján-Álvarez, J. M. Olivas-García y A. Domínguez-Pereda. 2013. Efecto del manejo forestal en la diversidad y composición arbórea de un bosque templado del noroeste de México. Revista Chapingo serie ciencias forestales y del ambiente 19(2):189-199. [ Links ]
Humano, C. A. 2000. Modelado de la dinámica y producción forestal de la selva Pedemontana de Yungas, Argentina. Tesis de Maestría. Universidad de Buenos Aires, Argentina. http://ri.agro.uba.ar/files/download/tesis/maestria/2013humanocristianariel.pdf (8 de marzo de 2019). [ Links ]
Hutchenson, K. 1970. A test for comparing diversities based on the Shannon formula. Journal of Theorical Biology 29:151-154. [ Links ]
Jiménez J., O. Aguirre y H. Kramer. 2001. Análisis de la estructura horizontal y vertical en un ecosistema multicohortal de pino-encino en el norte de México. Investigación Agraria. Sistemas y Recursos Forestales 10(2): 355-366. [ Links ]
Lamprecht, H. 1990. Silvicultura en los trópicos: Los ecosistemas forestales en los bosques tropicales y sus especies arbóreas, posibilidades y métodos para un aprovechamiento sostenido. Carrillo, A. (Trad.). GTZ (Cooperación Técnica Alemana). Eschborn, Alemania. 335 p. [ Links ]
Magurran, A. E. 1988. Ecological Diversity and its Measurement. Princeton University Press. Princeton, NJ, USA. 175 p. [ Links ]
Méndez O., C., C. A. Mora D., E. Alanís R., J. Jiménez P., O. A. Aguirre C., E. J. Treviño G. y M. Á. Pequeño L. 2018. Fitodiversidad y estructura de un bosque de pino-encino en la Sierra Madre del Sur, México. Revista Mexicana de Ciencias Forestales 9(50). https://doi.org/https://doi.org/10.29298/rmcf.v9i50.236. [ Links ]
Moreno, C. E. 2001. Métodos para medir la biodiversidad. Vol.1. M&T-Manuales y Tesis SEA. Sociedad Entomológica Aragonesa (SEA). Zaragoza, España. 84 p. [ Links ]
Secretaría de Medio Ambiente y Recursos Naturales (Semarnat). 2012. Bosques. http://www.semarnat.gob.mx/archivosanteriores/galeria/Documents/seccion/ecosistemas/Bosque/bosque.html (28 de abril de 2018). [ Links ]
Taylor A, N. E. 2016. Estructura y composición de bosques en paisajes manejados de Los Altos de Chiapas. Maestría en Recursos Naturales y Desarrollo Rural. El Colegio de la Frontera Sur. Campus Lerma, México. 38 p. [ Links ]
Villavicencio G., R., P. Bauche P., A. Gallegos R., A. L. Santiago P. y F. M. Huerta M. 2006. Caracterización estructural y diversidad de comunidades arbóreas de la Sierra de Quila. Boletín Ibugana 13(1): 67-76. [ Links ]
Zarco-Espinoza, V. M., J. L. Valdez-Hernández, G. Ángeles-Pérez y O. Castillo-Acosta. 2010. Estructura y diversidad de la vegetación arbórea del Parque Estatal Agua Blanca, Macuspana, Tabasco. Universidad y Ciencia 26(1): 1-17. http://www.scielo.org.mx/pdf/uc/v26n1/v26n1a1.pdf (8 de marzo de 2019). [ Links ]
Received: December 15, 2017; Accepted: March 29, 2019
 Este es un artículo publicado en acceso abierto bajo una licencia Creative Commons
