


Services on Demand
Journal
Article
 text in
  English (pdf)
 Article in xml format
 Article references
 Send this article by e-mail
Indicators
-
 Cited by SciELO
 -
 Access statistics
Related links
-
 Similars in
SciELO
Similars in
SciELO
Share

 Permalink
Revista mexicana de ciencias forestales
Print version ISSN 2007-1132
Rev. mex. de cienc. forestales vol.10 n.52 México Mar./Apr. 2019
https://doi.org/10.29298/rmcf.v10i52.469
Articles
Safe behavior practices in the sawmill industry of El Salto, Durango, Mexico
1Programa de Ingeniería Forestal. Tecnológico Nacional de México-Instituto Tecnológico de El Salto. México.
2Instituto de Silvicultura e Industria de la Madera de la Universidad Juárez del Estado de Durango. México.
Although the workers of the sawmill industry from El Salto, Durango, Mexico are exposed to different risks, they have not been evaluated to determine the level of safety. Therefore, the objective of this study was to know the applied of safe behavior practices of workers in the workplaces at 11 sawmills. In order to do this, two checklists generated from the occupational safety and health regulations were applied to evaluate by direct observations of safe and unsafe worker acts. The first checklist was related to use of personal protective equipment (PPE) and the second to safety conditions in the workplace. With this information, the percentage of safe behavior and security control graphics were determined; additionally, contingency tables and association tests between categorical Chisquare variables were prepared. The results showed that since only 31 % of the workers use PPE so that the safe behavior practices of the forestry worker are considered very low. Gloves for protection hands were the most used; meanwhile, respiratory and noise protection devices were the least used. Similarly, workplaces safety conditions were considered very low with 36 %. The signage of the work area of fire extinguishers and protection of machinery turned out to be the most critical aspects. It is important to change the unsafe behavior of the workforce to minimize the possibility of injury and accidents.
Key words: Unsafe act; unsafe condition; personal protective equipment; risk factors; occupational risk; forestry worker
Los trabajadores de la industria del aserrío de El Salto, Durango, México están expuestos a diferentes riesgos; sin embargo, estos no se han evaluado para determinar el nivel de seguridad. El objetivo del presente estudio fue conocer la ejecución de prácticas seguras por parte de los operadores en 11 aserraderos. Para ello, se realizaron observaciones directas sobre actos seguros e inseguros con dos listas de verificación: la primera, sobre el uso de equipo de protección personal (EPP) y la segunda, referente a las condiciones de seguridad del puesto de trabajo; ambas generadas a partir de la normatividad en seguridad y salud en el trabajo. Con esa información se determinó el porcentaje de comportamiento seguro y los gráficos de control de seguridad; adicionalmente, se elaboraron tablas de contingencia y pruebas de asociación entre variables categóricas de Chi-cuadrado. Los resultados mostraron que las prácticas de comportamiento seguro del trabajador forestal son muy bajas, pues en el uso de EPP alcanzaron apenas 31 %, en las que los guantes para protección de las manos fue el equipo de mayor uso, y los dispositivos tanto para protección respiratoria como los usados contra el ruido, resultaron los menos utilizados. Las condiciones de seguridad también resultaron muy bajas, con 36 %; sobresalen como las más críticas: la señalización del área de trabajo, la disponibilidad de extintores y la protección de maquinaria. Es importante cambiar el comportamiento inseguro de la planta laboral para minimizar la posibilidad de lesiones y accidentes.
Palabras clave: Acto inseguro; condición insegura; equipo de protección personal; factores de riesgo; riesgo laboral; trabajador forestal
Introduction
Forestry workers in the sawmill industry, especially in developing countries, face challenges for the prevention and control of occupational hazards and diseases because they work long hours in stressful environments (Diwe et al., 2016); they are exposed to a variety of hazards, such as: the absence of protections for both the workers and the machines, a lack of risk assessment and supervision at the workplace, unsafe methods for the performance of their work, among others (Chinniah, 2015).
Theoretically, the operators must be mindful of their work environment in order to create safety-related cognitive models and regulate their actions through behavior practices that may allow them to maintain a safe environment (Varonen and Mattila, 2000). However, the perceptions in regard to health and safety at the workplace have been ignored, largely because they are considered a waste of time; nevertheless, it is clear that the identification and measurement of accident precursors is a powerful proactive management tool for analyzing the safety climate at the workplace (Coyle et al., 1995).
Since the timber manufacture industry is mainly focused on production, there are often conflicts between productivity and the safety of the employees; the effects suggest that a greater emphasis in productivity is related to a high number of incidents (Evans et al., 2005); however, little or no attention is given to the various working conditions that are related to good safety practices (Kwame et al., 2014).
The primary purpose of measuring safety at the enterprises is to develop intervention strategies in order to avoid potential accidents. In this regard, recognition of the signs that precede an accident offers the possibility of improving safety (Grabowski et al., 2007). Therefore, we should highlight that employers and other actors who participate in the forestry manufacturing sector must support the actions required to guarantee compliance with safety regulations, as well as the well-being of the workers, in order to maintain a healthy, productive and resilient workforce (Adebola, 2014; Mylek and Schirmer, 2015).
The measurement of safe and unsafe actions is based on the behavior assessment method with a focus on work safety and environmental management, which revolves around the behavior of the employees as the cause of most work-related injuries, diseases and environmental deterioration (Fleming and Lardner, 2001). The observation of safe and unsafe behaviors is used by many companies to detect unsafe actions associated with personal or industrial accidents and to design intervention strategies, whose implementation in a natural environment calls for much rigor in both the development and the application of assessment instruments (Castilla, 2012).
There is a lack of information about the safety practices carried out at each workplace at the sawmills of the region of El Salto, Pueblo Nuevo, Durango; therefore, the purpose of this study was to determine the percentage of safe behavior by the workers in the use of personal protective equipment (PPE) and the safety conditions of the workplaces at 11 sawmills in that important forest region, and to render this tool a valuable instrument of diagnose to be utilized frequently as an aid to identify risk elements in order to ensure the ongoing improvement of the safety status of the sawmills, based on the reduction of occupational hazards and their consequences.
Materials and methods
Description of the study area
The present study was carried out in the municipality of Pueblo Nuevo, in the state of Durango, Mexico. The analysis considered 11 sawmills, six of which produce large pieces of sawn wood using vertical towers for band saws with a width of 127.00 to 254.00 mm (5 to 10”) wide of a variety of brands such as MAQPARSA®, HULMAQ® model 54x8, TROSATM, Herrera Durango Workshops, metalworking industry as well as a BAKER BP DOMINATOR ™ model 3650E horizontal main saw for thin-cut tapes 1.5 "(3.81 cm) wide. Sawn wood is divided into six categories, according to its quality, thickness and nominal length, or is commercialized as mill-run (mixed kinds) (Nájera-Luna et al., 2011). The other five sawmills produce components for pallets, using vertical saws for 4.13 cm (1⅝”) wide belts HULMAQ TM, TROSATM model -B-, Tinajero, S. A model A-21 and rebuilt mechanical industries, as well as multiple HULMAQ saws (Haro et al., 2015). Table 1 shows the human team occupying the various job posts in each sawmill and the observations made in each.
Table 1 Job posts and observations analyzed by sawmill.
| Sawmill | OP | AOP | GA | OIWS | OIPPE |
|---|---|---|---|---|---|
| La Victoria | 7 | 7 | 3 | 56 | 182 |
| El Diamante | 3 | 3 | 3 | 53 | 178 |
| García | 3 | 3 | 2 | 42 | 177 |
| Quintana I | 4 | 4 | 2 | 54 | 176 |
| Pueblo Nuevo | 2 | 2 | 1 | 48 | 172 |
| Quintana II | 4 | 4 | 2 | 54 | 186 |
| La Peña | 11 | 2 | 1 | 56 | 182 |
| El Potro | 4 | 3 | 2 | 54 | 189 |
| PROMADESA | 4 | 2 | 2 | 56 | 168 |
| Gil Meza | 4 | 2 | 2 | 56 | 168 |
| San Francisco | 4 | 4 | 2 | 60 | 180 |
| Total | 50 | 36 | 22 | 589 | 1958 |
OP = Machinery and equipment operator; AOP = Assistant operator; GA = General assistant; OIWS = Observations made during the inspection of the work station; OIPPE =Observations made during the inspection of the use of personal protective equipment.
All those workers who hold the most specialized job posts, in which decision making is a priority, were considered as operators: workers who operate chainsaws, jigsaws, swing saws, log cutters, trimmers, edgers, zip saws, resaws, and lift trucks. Assistant operators are all those workers who receive a direct instruction from the main operator of each type of machinery, while general assistants are those people in charge, mainly, of cleaning, ordering, distributing, and organizing the raw materials and various other materials.
Safe and unsafe behaviors
Data were collected through direct observations at each workplace at the 11 sawmills in order to document safe and unsafe behaviors by applying two checklists based on the norm NOM-017-STPS-2008 (STPS, 2008), in relation to the use and management of personal protective equipment at the workplace, as well as on the standards for the assessment of compliance with the 2015 Guidelines for implementing the occupational safety and health provisions (STPS, 2015), in order to evaluate the safety conditions at the workplace. The former included the frequency in the use of PPE by the workers, and the latter considered the safety of the workplace.
The sampling took place during the period of May and June 2018 at three random times during the day (morning, noon, and afternoon), and as unpredictably as possible through long periods of observation, in order to prevent a bias in the results and the occurrence of safe behavior exclusively during the assessment period (Lane and Bachmann, 1998).
In order to estimate the percentage of realization of safe practices, a trained observer registered the safe and unsafe actions exhibited by the workers by applying the checklists. The percentage of safe behaviors was estimated as suggested by Glendon and Litherland (2001), according to the mathematical equation 1:
Where:
Safety control charts
Safety control charts, also known as control diagrams of behavioral results (DCRC, Spanish acronym), were made according to the technique
recommended by Mejías-Herrera and Fernández-Clúa (2001), which consists in the estimation of the upper and lower limits of control of safe and unsafe behaviors using the equations 2 and 3:
Where:
2 = Times the standard deviation for a 95 % confidence interval.
Statistical analysis
The collected data were utilized to develop crosstabs or contingency tables including frequencies and percentages within the assessed categories. Non-parametric Chi square tests were also used to determine the association and independence from the degree of relationship between two category variables (Janicak, 2007). The asymptotic method and Fisher’s exact test were used for this purpose whenever more than 20 % of the expected frequencies had values below 5 (Sharpe, 2015). The category variable corresponding to the type of job post (operators, assistant operators, and general assistants) was related to each of the items of the checklists for safety of the workplace, as well as with the frequency in the use of PPE (for hands, ears, eyes, nose, body, and feet) in each one of the studied sawmills. The data were analyzed using the SPSS statistical package, version 19 (IBM Corp., 2010).
Results and Discussion
Safe behavior practices in the use of PPE by job post
The results showed that the percentage of safe behavior among sawmill workers of the El Salto, Durango region, is extremely low, particularly for hearing, eye, head, body, and respiratory protections. The average safe behavior percentage for the use of protective gloves when performing certain work activities was 72 %; although one would expect machinery and equipment operators to wear protective gloves most frequently, it was the assistant operators who exhibited the best safe behavior in the use of this protective equipment (82 %). The use of hearing protections for reducing the noise of the machinery and the use of masks to reduce sawdust and smoke inhalation were the least frequent, with safe behavior percentages of merely 6 % and 8 %, respectively. The percentage for the use of facial protection was 19 %; 8 % for head protection; 60 % for safety footwear, and 47 % for full-body protection. Out of the seven items evaluated in the checklist applied to the observation of safe behavior by the workers, five were shown to be related to the job posts (p<0.05), and only the frequency in the use of respiratory and full-body protections were unrelated to the job posts (p>0.05) (Table 2).
Table 2 Safe behavior practices in the use of PPE.
| Item | Job post | p* | ||
|---|---|---|---|---|
| Equipment operator | Assistant operator | General assistant | ||
| Frequency in the use of protective gloves at the workplace n (%) | ||||
| Yes | 579 (29.6) | 601 (30.7) | 242 (12.4) | 0.0001* |
| No | 269 (13.7) | 134 (6.8) | 133 (6.8) | |
| SB (%) | 68.28 | 81.77 | 64.53 | |
| Frequency in the use of hearing protective devices at the workplace n (%) | ||||
| Yes | 53 (2.7) | 82 (4.2) | 7 (0.4) | 0.0001* |
| No | 795 (40.6) | 653 (33.4) | 368 (18.8) | |
| SB (%) | 6.25 | 11.16 | 1.87 | |
| Frequency in the use of facial protective devices at the workplace n (%) | ||||
| Yes | 190 (9.7) | 194 (9.9) | 33 (1.7) | 0.0001* |
| No | 658 (33.6) | 541 (27.6) | 342 (17.5) | |
| SB (%) | 22.41 | 26.39 | 8.8 | |
| Frequency in the use of respiratory protective devices at the workplace n (%) | ||||
| Yes | 8 (0.9) | 7 (0.4) | 2 (0.1) | 0.7390 |
| No | 840 (42.9) | 728 (37.2) | 373 (19.1) | |
| SB (%) | 0.94 | 0.95 | 0.58 | |
| Frequency in the use of head protection at the workplace n (%) | ||||
| Yes | 93 (4.7) | 40 (2.0) | 32 (1.6) | 0.0001* |
| No | 755 (38.6) | 695 (35.5) | 343 (17.5) | |
| SB (%) | 10.97 | 5.44 | 8.53 | |
| Frequency in the use of safety footwear at the workplace n (%) | ||||
| Yes | 578 (29.5) | 452 (23.1) | 184 (9.4) | 0.0001* |
| No | 270 (13.8) | 283 (14.5) | 191 (9.8) | |
| SB (%) | 68.16 | 61.50 | 49.07 | |
| Frequency in the use of full-body protection at the workplace n (%) | ||||
| Yes | 423 (21.6) | 328 (16.8) | 175 (8.9) | 0.1090 |
| No | 425 (21.7) | 407 (20.8) | 200 (10.2) | |
| SB (%) | 49.88 | 44.63 | 46.67 | |
*Chi2 test, significant (p<0.05). SB = Safe behavior
This can be explained by the argument of Meliá (2007), according to whom, although people have the ability and knowledge to work in a safe manner, they often choose unsafe behaviors. This was confirmed in the evaluated sawmills, where some workers who have personal protective equipment tend not to wear it; this is because the managers do not enforce the use of PPE or encourage their employees to promote safe behaviors in regard both to themselves and to their work station. According to Ocon and McFarlane (2007), encouragement of the acquisition of safety habits by the workers consists in granting incentives to those who carry out safe behavior practices frequently; these positive reinforcements are meant to increase the likelihood of such behaviors to be repeated, learned and replicated in order to reduce the number of unsafe actions.
However, in the studied region, incentives are only applied to productivity, at the expense of safety, potentially encouraging unsafe behavior by the workers, since they are rewarded for it (Sawacha et al., 1999). Certain employees can be usually seen to perform unsafe actions or to omit the use of personal protective equipment, either encouraged by their coworkers to flaunt their ‘self-esteem’ in this manner or in order to avoid discomfort or hassles while working. Therefore, incentives to productivity needs to be granted in a way that is compatible with safe behavior (Choudhry and Fang, 2008).
Safe behavior practices in the use of PPE by sawmill
The sawmills with the highest percentage of PPE use were: a) La Victoria, with 90 % use of protective gloves and 26 % use of hearing protections; b) Promadesa, with 67 % use of safety goggles; c) La Peña, with 7 % use of masks to protect the respiratory system, 86 % of use of safety hard hats, and 78 % use of full-body protections such as belts, aprons, and thick coveralls; d) the use of industrial safety footwear (97 %) at the Quintana I sawmill was prominent. These data confirm that the unsafe behaviors incurred by sawmill workers in the region of El Salto, Durango, consist in the failure to wear protective masks against smoke and sawdust (99 %); hearing protections against noise (94 %); industrial hard hats (90 %); safety goggles (80 %); belts, aprons and thick full-body coveralls (50 %); industrial footwear (39 %), and protective gloves (26 %) (Table 3).
Table 3 Percentage of safe behavior in the use of PPE by sawmill.
| Job post | Sawmill* | ||||||||||
|---|---|---|---|---|---|---|---|---|---|---|---|
| ED | G | GM | LP | LV | EP | PM | PN | Q1 | Q2 | SF | |
| Safe behavior in the use of protective gloves (%) | |||||||||||
| Operator | 66.10 | 69.49 | 70.24 | 54.55 | 83.56 | 54.76 | 39.29 | 69.09 | 92.54 | 80.88 | 93.06 |
| Assistant operator | 64.20 | 70.79 | 80.95 | 92.31 | 87.50 | 100.00 | 95.24 | 80.26 | 80.25 | 94.32 | 72.22 |
| General assistant | 52.63 | 68.97 | 69.05 | 100.00 | 100.00 | 58.73 | 59.52 | 53.66 | 82.14 | 66.67 | 55.56 |
| Average | 60.98 | 69.75 | 73.41 | 82.28 | 90.35 | 71.16 | 64.68 | 67.67 | 84.98 | 80.62 | 73.61 |
| Std. dev. | 7.29 | 0.94 | 6.56 | 24.33 | 8.58 | 25.05 | 28.33 | 13.36 | 6.62 | 13.83 | 18.79 |
| Safe behavior in the use of hearing protections against noise (%) | |||||||||||
| Operator | 3.39 | 13.56 | 0.00 | 4.90 | 16.44 | 0.00 | 0.00 | 34.55 | 7.46 | 0.00 | 0.00 |
| Assistant operator | 14.81 | 0.00 | 0.00 | 15.38 | 62.50 | 0.00 | 0.00 | 0.00 | 7.41 | 0.00 | 0.00 |
| General assistant | 0.00 | 3.45 | 0.00 | 0.00 | 0.00 | 0.00 | 0.00 | 0.00 | 17.86 | 3.33 | 0.00 |
| Average | 6.07 | 5.67 | 0.00 | 6.76 | 26.31 | 0.00 | 0.00 | 11.52 | 10.91 | 1.11 | 0.00 |
| Std. dev. | 7.76 | 7.05 | 0.00 | 7.86 | 32.40 | 0.00 | 0.00 | 19.94 | 6.02 | 1.92 | 0.00 |
| Safe behavior in the use of safety goggles (%) | |||||||||||
| Operator | 35.59 | 5.08 | 50.00 | 4.90 | 0.00 | 3.57 | 64.29 | 0.00 | 35.82 | 1.47 | 50.00 |
| Assistant operator | 17.28 | 32.58 | 45.24 | 0.00 | 0.00 | 0.00 | 92.86 | 2.63 | 23.46 | 20.45 | 75.00 |
| General assistant | 2.63 | 0.00 | 19.05 | 0.00 | 0.00 | 0.00 | 42.86 | 2.44 | 3.57 | 0.00 | 11.11 |
| Average | 18.50 | 12.56 | 38.10 | 1.63 | 0.00 | 1.19 | 66.67 | 1.69 | 20.95 | 7.31 | 45.37 |
| Std. dev. | 16.51 | 17.53 | 16.67 | 2.83 | 0.00 | 2.06 | 25.08 | 1.47 | 16.27 | 11.41 | 32.20 |
| Safe behavior in the use of safety masks (%) | |||||||||||
| Operator | 0.00 | 0.00 | 0.00 | 5.59 | 0.00 | 0.00 | 0.00 | 0.00 | 0.00 | 0.00 | 0.00 |
| Assistant operator | 0.00 | 0.00 | 0.00 | 7.69 | 0.00 | 0.00 | 0.00 | 0.00 | 3.70 | 0.00 | 2.78 |
| General assistant | 0.00 | 0.00 | 0.00 | 7.69 | 0.00 | 0.00 | 0.00 | 2.44 | 0.00 | 0.00 | 0.00 |
| Average | 0.00 | 0.00 | 0.00 | 6.99 | 0.00 | 0.00 | 0.00 | 0.81 | 1.23 | 0.00 | 0.93 |
| Std. dev. | 0.00 | 0.00 | 0.00 | 1.21 | 0.00 | 0.00 | 0.00 | 1.41 | 2.14 | 0.00 | 1.60 |
| Safe behavior in the use of safety hard hats (%) | |||||||||||
| Operator | 1.69 | 0.00 | 0.00 | 64.34 | 0.00 | 0.00 | 0.00 | 0.00 | 0.00 | 0.00 | 0.00 |
| Assistant operator | 1.23 | 0.00 | 0.00 | 100.00 | 12.50 | 0.00 | 0.00 | 0.00 | 0.00 | 1.14 | 0.00 |
| General assistant | 50.00 | 0.00 | 0.00 | 92.31 | 0.00 | 0.00 | 0.00 | 2.44 | 0.00 | 0.00 | 0.00 |
| Average | 17.64 | 0.00 | 0.00 | 85.55 | 4.17 | 0.00 | 0.00 | 0.81 | 0.00 | 0.38 | 0.00 |
| Std. dev. | 28.02 | 0.00 | 0.00 | 18.77 | 7.22 | 0.00 | 0.00 | 1.41 | 0.00 | 0.66 | 0.00 |
| Safe behavior in the use of industrial safety footwear (%) | |||||||||||
| Operator | 79.66 | 81.36 | 57.14 | 100.00 | 32.88 | 0.00 | 58.33 | 100.00 | 94.03 | 98.53 | 47.22 |
| Assistant operator | 35.80 | 95.51 | 23.81 | 100.00 | 50.00 | 0.00 | 61.90 | 86.84 | 98.77 | 81.82 | 13.89 |
| General assistant | 60.53 | 72.41 | 30.95 | 100.00 | 0.00 | 0.00 | 80.95 | 41.46 | 100.00 | 93.33 | 38.89 |
| Average | 58.66 | 83.09 | 37.30 | 100.00 | 27.63 | 0.00 | 67.06 | 76.10 | 97.60 | 91.23 | 33.33 |
| Std. dev. | 21.99 | 11.64 | 17.55 | 0.00 | 25.41 | 0.00 | 12.16 | 30.71 | 3.15 | 8.55 | 17.35 |
| Safe behavior in the use of aprons, belts, and thick coveralls (%) | |||||||||||
| Operator | 62.71 | 1.69 | 64.29 | 58.74 | 50.68 | 46.43 | 53.57 | 3.64 | 73.13 | 61.76 | 45.83 |
| Assistant operator | 20.99 | 16.85 | 47.62 | 100.00 | 75.00 | 54.76 | 50.00 | 39.47 | 40.74 | 45.45 | 43.06 |
| General assistant | 52.63 | 44.83 | 4.76 | 76.92 | 100.00 | 33.33 | 80.95 | 46.34 | 64.29 | 73.33 | 8.33 |
| Average | 45.44 | 21.13 | 38.89 | 78.55 | 75.23 | 44.84 | 61.51 | 29.82 | 59.39 | 60.18 | 32.41 |
| Std. dev. | 21.77 | 21.88 | 30.71 | 20.68 | 24.66 | 10.80 | 16.93 | 22.93 | 16.74 | 14.01 | 20.89 |
*ED = El Diamante, GS = García, GM = Gil Meza, LP = La Peña, LV = La Victoria, EP = El Potro, PM = PROMADESA, PN = Pueblo Nuevo, Q1 = Quintana I, Q2 = Quintana II, SF = San Francisco.
It is important to mention that new or young sawmills workers usually replicate and the vices of the more senior workers; they are far from exhibiting safe behaviors, and are therefore more prone to suffer mishaps, and only with the passage of time and the occurrence of injuries or accidents do they gain awareness of the importance of maintaining safe behaviors at the workplace (Bello and Mijinyawa, 2010).
Safety conditions at the workplace
13 out of 16 assessed items regarding the safety conditions at the sawmills were observed to be related to the category of job posts (p<0.05). The percentage of safety conditions per work station is considered to be very low, given that 14 out of the 16 items had the largest number of unsafe conditions. In descending order, the topmost percentage of safe conditions registered corresponds to the aspects of adequate ventilation and the availability of lighting at the workplace (98 and 95 %, respectively); keeping the areas for the traffic of materials free of obstacles (60 %); comfort (56 %); keeping the work area free of obstacles in order to prevent falls and trips (53 %); using protections when using machinery or equipment with sharp edges (48 %); a clean, orderly work station (29 %); clean aisles and walkways (27 %); protections for electricity conductors (27 %); using safety guards in mobile machinery and equipment parts (24 %); adequately marked aisles (17 %); presence of fire extinguishers (14 %); full use of PPE (13 %); adequate signage in the area (12 %); signage for electricity outlets (8 %), and presence of warning signs (1 %). In general, the highest percentage of safe actions at the work stations was attained by the equipment operators (41 %), followed by the assistant operators (35 %), and, thirdly, by the general assistants (33 %) (Table 4).
Table 4 Safety conditions by job post.
| Item | Job post | p* | ||
|---|---|---|---|---|
| Equipment operator | Assistant operator | General assistant | ||
| Adequate signage at the work area n (%) | ||||
| Yes | 44 (7.5) | 24 (4.1) | 8 (1.4) | 0.0030* |
| No | 209 (35.5) | 165 (28.0) | 139 (23.6) | |
| SB (%) | 17.39 | 12.70 | 5.44 | |
| Presence of fire extinguishers at the work area n (%) | ||||
| Yes | 34 (5.8) | 36 (6.1) | 14 (2.4) | 0.0410* |
| No | 219 (37.2) | 153 (26.0) | 133 (22.6) | |
| SB (%) | 13.44 | 19.05 | 9.52 | |
| Obstacle-free work area without danger of falls and trips n (%) | ||||
| Yes | 150 (25.5) | 109 (18.5) | 62 (10.5) | 0.0020* |
| No | 103 (17.5) | 80 (13.6) | 85 (14.4) | |
| SB (%) | 59.29 | 57.67 | 42.18 | |
| Adequate lighting at the workplace n (%) | ||||
| Yes | 234 (39.7) | 184 (31.2) | 142 (24.1) | 0.0400* |
| No | 19 (3.2) | 5 (0.8) | 5 (0.8) | |
| SB (%) | 92.49 | 97.35 | 95.95 | |
| Adequate ventilation at the workplace n (%) | ||||
| Yes | 250 (42.4) | 186 (31.6) | 144 (24.4) | 0.7950 |
| No | 3 (0.5) | 3 (0.5) | 3 (0.5) | |
| CS (%) | 98.81 | 98.41 | 97.96 | |
| Safety guards for machinery and equipment mobile parts n (%) | ||||
| Yes | 53 (9.0) | 24 (4.1) | 26 (4.4) | 0.0001* |
| No | 162 (27.5) | 156 (26.5) | 48 (8.1) | |
| SB (%) | 24.65 | 13.33 | 35.14 | |
| Protections for sharp edges in machinery and equipment n (%) | ||||
| Yes | 133 (22.6) | 69 (11.7) | 32 (5.4) | 0.0001* |
| No | 104 (17.7) | 99 (16.8) | 36 (6.1) | |
| SB (%) | 56.12 | 41.07 | 47.06 | |
| Protection to electricity conductors n (%) | ||||
| Yes | 74 (12.6) | 29 (4.9) | 19 (3.2) | 0.0001* |
| No | 129 (21.9) | 126 (21.4) | 55 (9.3) | |
| SB (%) | 36.45 | 18.71 | 25.68 | |
| Signage of electric outlets n (%) | ||||
| Yes | 26 (4.4) | 12 (2.0) | 2 (0.3) | 0.0001* |
| No | 177 (30.1) | 148 (25.1) | 70 (11.9) | |
| SB (%) | 12.81 | 7.50 | 2.78 | |
| Comfort offered by the workplace for carrying out the activities n (%) | ||||
| Yes | 154 (26.1) | 97 (16.5) | 82 (13.9) | 0.1310 |
| No | 99 (16.8) | 92 (15.6) | 65 (11.0) | |
| SB (%) | 60.87 | 51.32 | 55.78 | |
| Full use of the PPE provided by the management n (%) | ||||
| Yes | 47 (8.0) | 13 (2.2) | 18 (3.1) | 0.0001* |
| No | 206 (35.0) | 176 (29.9) | 129 (21.9) | |
| SB (%) | 18.58 | 6.88 | 12.24 | |
| Orderly and clean work area n (%) | ||||
| Yes | 92 (15.6) | 53 (9.0) | 32 (5.4) | 0.0070* |
| No | 161 (27.3) | 136 (23.1) | 115 (19.5) | |
| SB (%) | 36.36 | 28.04 | 21.77 | |
| Presence of warning sign at the work station n (%) | ||||
| Yes | 3 (0.5) | 4 (0.7) | 2 (0.3) | 0.7190 |
| No | 250 (42.4) | 185 (31.4) | 145 (24.6) | |
| SB (%) | 1.19 | 0.23 | 1.36 | |
| Clean aisles and walkways n (%) | ||||
| Yes | 89 (15.1) | 43 (7.3) | 35 (5.9) | 0.0060* |
| No | 164 (27.8) | 146 (24.8) | 112 (19.0) | |
| SB (%) | 35.18 | 22.75 | 23.81 | |
| Adequately marked aisles n (%) | ||||
| Yes | 54 (9.2) | 35 (5.9) | 10 (1.7) | 0.0010* |
| No | 199 (33.8) | 154 (26.1) | 137 (23.3) | |
| SB (%) | 24.22 | 18.52 | 6.80 | |
| Obstacle-free areas for the passage of materials n (%) | ||||
| Yes | 105 (17.8) | 61 (10.4) | 43 (7.3) | 0.0250* |
| No | 148 (25.1) | 128 (21.7) | 104 (17.7) | |
| SB (%) | 68.16 | 61.5 | 49.07 | |
*Chi2 test, significant (p<0.05) SB = Safe behavior
In the El Salto, Durango region, sawmill workers can be usually seen to carry out their activities under questionable safety conditions, especially due to the absence of signs warning about potential hazards at the work stations; another frequent situation has to do with the availability of machinery, tools, and reasonably safe enviornments, and with the fact that the workers do not take care to carry out their activities in a safe manner, but instead use shortcuts; avoid safety protocols; eliminate, suppress, or disable protections and safety means, use inadequate tools or fail to put in place essential protections in risk areas (Meliá, 2007).
From the point of view of the human capital, Berkhout and Damen (2016) point out that work tasks require skills, and the workers have these skills; as part of the hiring process, the employers attempt to adapt the best elements to their vacancies. The suitability or unsuitability of the workers for the job posts they occupy results in a specific accident rate for every particular condition. However, as we mentioned above, there will always be potential or residual hazards related to both the personnel and the machinery, although some of these hazards may be limited through laws and safety measures. The truth is that, in practice, there is an enormous residual hazard in the sawmills of the region of El Salto, Durango, and the workers who occupy job posts in those companies do so under enormous potential risk.
This study shares the point of view of Ahmed et al. (2018), who point out that the most often neglected tasks at the work facilities are fire drills, the maintenance of electric circuits, training in first aid techniques, health checkups, and keeping medical records of the workers.
At the assessed sawmills, the availability of adequate lighting and ventilation are not risk factors for the occurrence of unsafe behavior, since most stations have sufficient lighting and ventilation for carrying out the work activities. Under these conditions, the risk would be present only during the earliest hours of the day, when the support of artificial light is generally utilized, as there are no night shifts. As for ventilation, in days with strong draughts, the main danger is that suspended dust and smoke particles may interfere with the workers’ visibility and breath; therefore, the use of protective devices would help mitigate potential unsafe behaviors. In almost all the observations carried out, at certain sawmills electric wires and distribution caps remained open, filled with dust and sawdust, with the latent risk of causing fires and electric discharges. Furthermore, there are no safety warnings on the electricity control panel, which increases the threat of potential accidents (Kaygin and Yildiz, 2017).
Safety control charts for safe behavior by sawmill
Control charts for safe behavior at the assessed sawmills in terms of personal protective equipment use by the workers exhibited control limits of 28.86 to 34.12 %; i.e. the threshold of safe behavior is extremely low. Even so, six of the eleven assessed sawmills were beneath the lower control limit, with safe behavior percentages of 15.95 to 28.74 %, while only five exhibited values ranging between 34.22 and 45.21 %. As for unsafe behaviors, due to lack of use of personal protective equipment, the control limits were established within a threshold of unsafe behaviors of 65.88 to 71.14 %, which is very high. Therefore, six sawmills surpassed the upper limit, with unsafe behavior percentages of 71.43 to 85.05 %, while in five sawmills, the unsafe behavior percentages ranged between 54.79 and 65.78 % (Figure 1a and 1b).
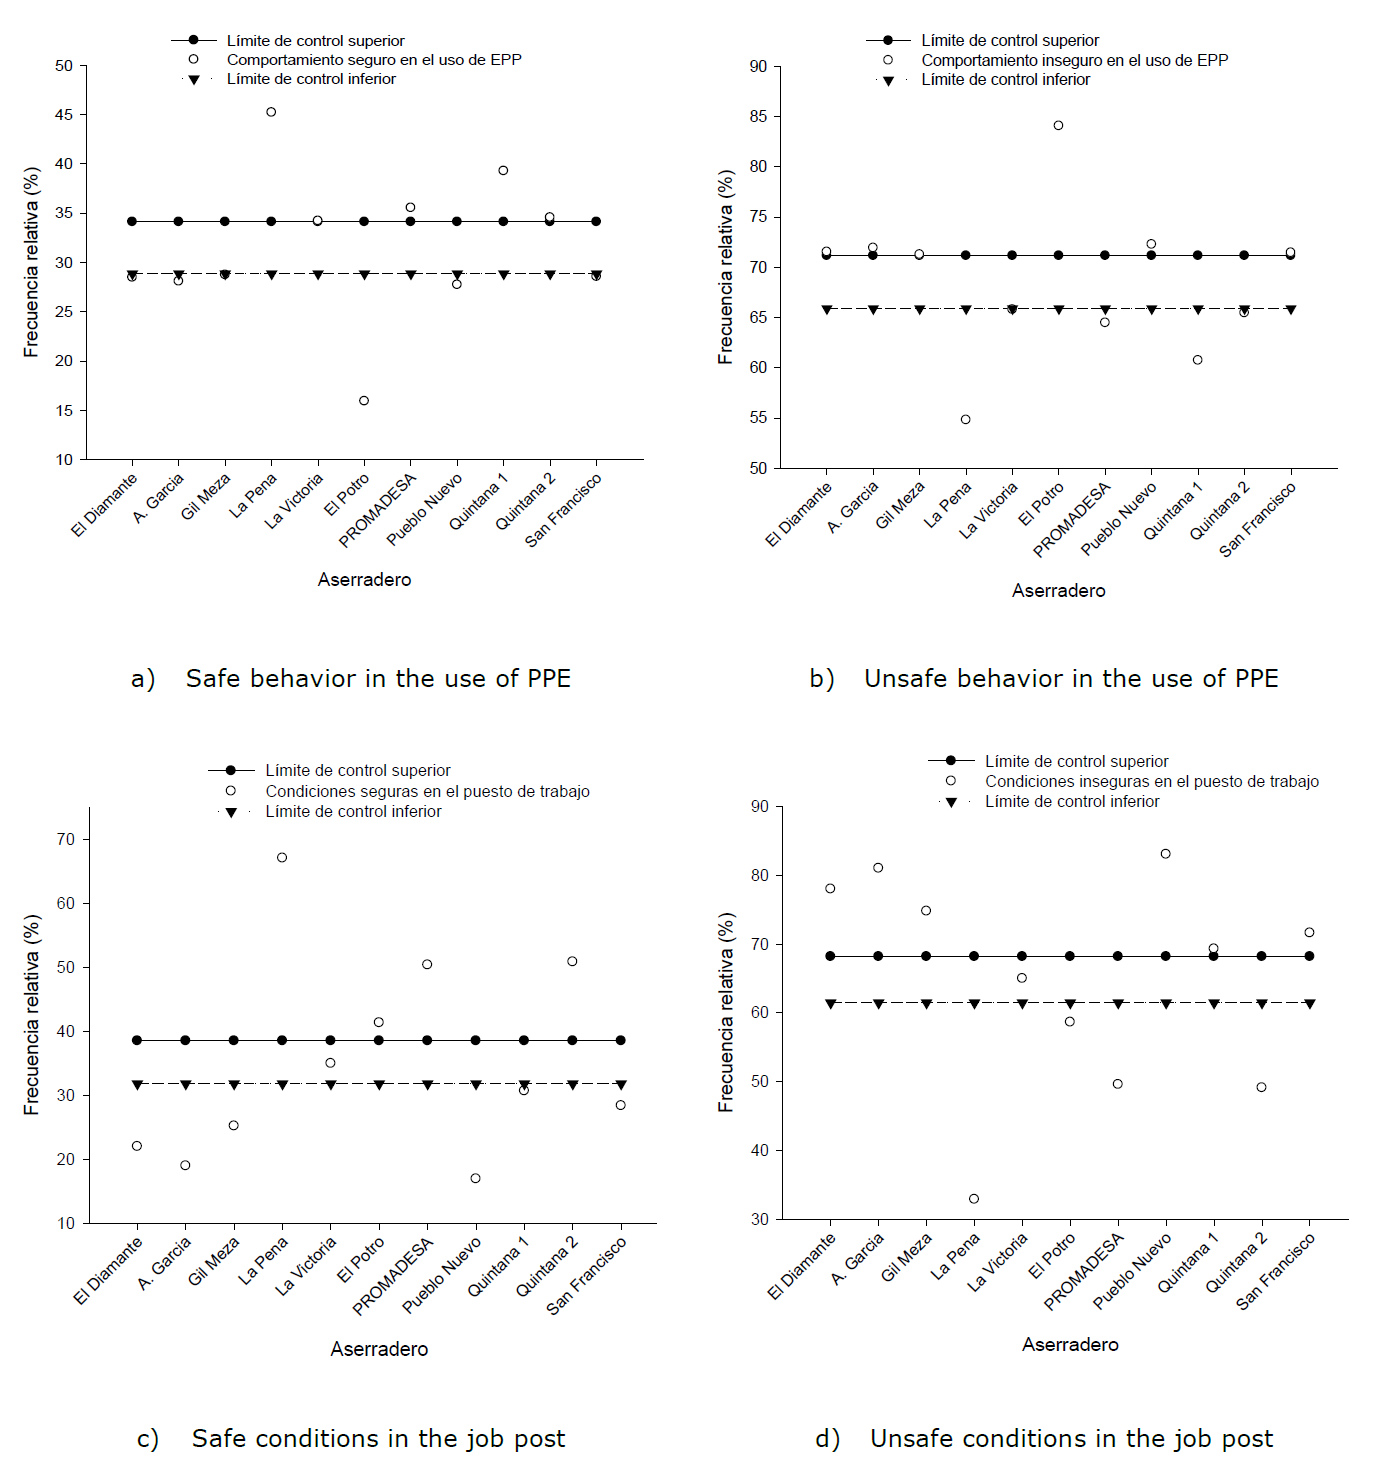
Frecuencia = Frequency; Aserradero = Sawmill; Límite de control superior = Upper control limit; Condiciones inseguras en el puesto de trabajo = Unsafe conditions in the job post; Límite de control inferior = Lower control limit.
Figure 1 Safe and unsafe behavior in the use of PPE and safety conditions at the workplace by sawmill.
For the safety conditions of the workers at their work stations (Figure 1c and 1d), the control limits were established at the threshold of 31.82 to 38.54 %, which is considered low. Nevertheless, six of the 11 assessed sawmills were not even within the threshold of safety, and therefore their safety conditions were beneath the lower control limit, with values of 18.98 to 30.70 %. Only one sawmill was within the control limit, with 35 % of safety conditions, while four were above the upper control limit, with values ranging between 41.35 and 67.11 %.
The unsafe conditions registered at the sawmills in the region of El Salto, Durango, were observed to be around the control limits established at 61.46 to 68.18 %. Six sawmills exhibited the highest incidence of unsafe conditions, above the upper control limit, with values of 69.30 to 83.05 %; one was within the control limits, with 65 %, and four were beneath the lower control limit, with values of 32.89 to 58.65 %.
According to Işsever et al. (2008), industrial accidents are also derived from the unsafe conditions that include the physics and ergonomics of the workplace, as well as from the unsafe behavior of workers; therefore, even when all the safety conditions at the workplace are under control, unsafe human behavior is the precursor of work accidents.
Conclusions
It is evident that there is a serious problem of safety in the sawmill industry of the El Salto, Durango region, given the high percentage of unsafe conditions and unsafe behaviors registered. Since safe behavior practices carried out by forestry workers are very low, as these consistently or frequently omit the use of personal protection equipment, and only protections for hands, feet, and body attain moderate safe behavior percentages; the lowest use percentages correspond to respiratory and hearing protections. Assistant operators of machinery and equipment constitute the sector that most frequently utilizes personal protective equipment. Between sawmills, the use of PPE is very heterogeneous, and unsafe behavior is prevalent.
Safety conditions at the workplace are also very low. Disorderly, unclean work stations are commonplace; electricity conductors and mobile machinery or equipment parts have little or no protections; fire extinguishers are not available, and there are no warning signs or any other kind of signage.
The managers and employees need to consider changing the unsafe behaviors of the workforce, because conditions that favor potential injuries and accidents are prevalent. There will always be occupational hazards, but they can be minimized.
Acknowledgements
The authors wish to express their gratitude to the Consejo de Ciencia y Tecnología del Estado de Durango, Cocyted (Council for Science and Technology of the State of Durango) for funding the research project titled “Evaluation of the environmental conditions and hazards at the workplaces of the forest industry of El Salto, Durango”, from which the present article stemmed.
REFERENCES
Adebola, J. O. 2014. Knowledge, attitude and compliance with occupational health and safety practices among pipeline products and marketing company (PPMC) staff in Lagos. Merit Research Journal of Medicine and Medical Sciences 2(8):158-173. [ Links ]
Ahmed, I., A. Usman, M. S. Nazir and M. Z. Shaukat. 2018. Safety practices in informal industrial segment of Pakistan. Safety Science 110:83-91. [ Links ]
Bello, S. R. and Y. Mijinyawa. 2010. Assessment of injuries in small scale sawmill industry of south western Nigeria. Agricultural Engineering International: CIGR Journal 12(1):151-157. [ Links ]
Berkhout, P. H. G. and M. Damen. 2016. Estimating individual occupational risk using registration data. Safety Science 82:95-102. [ Links ]
Castilla R., O. 2012. Observación de conductas inseguras en el trabajo: un análisis metodológico. Universitas Psychologica 11(1):311-321. [ Links ]
Chinniah, Y. 2015. Analysis and prevention of serious and fatal accidents related to moving parts of machinery. Safety science 75:163-173. [ Links ]
Choudhry, R. M. and D. Fang. 2008. Why operatives engage in unsafe work behavior: Investigating factors on construction sites. Safety science 46(4):566-584. [ Links ]
Coyle, I. R., S. D. Sleeman and N. Adams. 1995. Safety climate. Journal of Safety Research 26(4):247-254. [ Links ]
Diwe, K. C., C. B. Duru, A. C. Iwu, I. A. Merenu, K. A. Uwakwe, U. R. Oluoha, T. B. Ogunniyan, U. C. Madubueze and I. Ohale. 2016. Occupational hazards, safety and hygienic practices among timber workers in as south eastern State, Nigeria. Occupational Diseases and Environmental Medicine 4(3):63-71. [ Links ]
Evans, D. D., J. H. Michael, J. K. Wiedenbeck and C. D Ray. 2005. Relationships between organizational climates and safety-related events at four wood manufacturers. Forest Products Journal 55(6):23-28. [ Links ]
Fleming, M. and R. Lardner. 2001. Behaviour modification programmes establishing best practice. Suffolk, UK. HSE Books. 26 p. [ Links ]
Glendon, A. I. and D. K. Litherland. 2001. Safety climate factors, group differences and safety behaviour in road construction. Safety Science 39(3):157-188. [ Links ]
Grabowski, M., P. Ayyalasomayajula, J. Merrick, J. R. Harrald and K. Roberts. 2007. Leading indicators of safety in virtual organizations. Safety Science 45(10):1013-1043. [ Links ]
Haro P., A. J., J. A. Nájera L. , J. Méndez G., S. Corral R., J. C. Hernández D., A. Carrillo P. y F. Cruz C. 2015. Factor de conversión de productos forestales en la industria de tarimas en Durango. Revista Mexicana de Ciencias Forestales 6(30):90-105. [ Links ]
IBM Corp. 2010. IBM SPSS Statistics for Windows (Version 19.0). IBM Corp. Armonk, NY USA. n/p. [ Links ]
Işsever, H., K. Özdilli, L. Önen, O. Tan, R. Dişçi and O. Yardιmcι. 2008. Examination of personal factors in work accidents. Indoor and Built Environment 17(6):562-566. [ Links ]
Janicak, C. A. 2007. Applied statistics in occupational safety and health. Government Institutes. The Scarecrow Press, Inc. Lanham, MA USA. 185 p. [ Links ]
Kaygin, B. and Ö. Yildiz. 2017. Occupational health and safety practices in furniture manufacturing environment in Bartın province. Journal of Bartın Faculty of Forestry 19(2):115-122. [ Links ]
Kwame, O. B., E. Kusi and E. A. Lawer. 2014. Occupational hazards and safety practices: a concern among small scale sawmilling industries in Tamale Metropolis, Ghana. International Journal of Scientific & Technology Research 3(10):234-236. [ Links ]
Lane, C. and R. Bachmann. 1998. Trust within and between organizations: conceptual issues and empirical applications. Oxford University Press. New York, NY USA. 338 p. [ Links ]
Mejías-Herrera, S. y M. Fernández-Clúa. 2001. Los gráficos de control: una eficaz técnica para evaluar el desempeño en programas de seguridad. Prevención, trabajo y salud. Revista del Instituto Nacional de Seguridad e Higiene en el Trabajo 13:10-17. [ Links ]
Meliá, J. L. 2007. Seguridad basada en el comportamiento. Perspectivas de intervención en riesgos psicosociales. Medidas Preventivas. Unitat d’Investigació de Psicometria. Universidad de Valencia. Valencia, España. pp. 157-180. [ Links ]
Mylek, M. R. and J. Schirmer. 2015. Beyond physical health and safety: supporting the wellbeing of workers employed in the forest industry. Forestry: An International Journal of Forest Research 88(4):391-406. [ Links ]
Nájera-Luna, J. A., O. A Aguirre-Calderón , E. J. Treviño-Garza, J. Jiménez-Pérez, E. Jurado-Ybarra, J. J. Corral-Rivas y B. Vargas-Larreta. 2011. Rendimiento volumétrico y calidad dimensional de la madera aserrada en aserraderos de El Salto, Durango. Revista Mexicana de Ciencias Forestales 2(4):75-89. [ Links ]
Ocon, R. and O. McFarlane. 2007. Reducing employee injuries through behavior based safety. In: 5th Latin American and Caribbean Conference for Engineering and Technology. May 29-June 1. Tampico, Tamps., México. pp. 1-9. http://laccei.org/LACCEI2007-Mexico/Papers%20PDF/IE079_Ocon.pdf (18 de noviembre de 2018). [ Links ]
Sawacha, E., S. Naoum and D. Fong. 1999. Factors affecting safety performance on construction sites. International Journal of Project Management 17(5):309-315. [ Links ]
Secretaría del Trabajo y Previsión Social (STPS). 2008. Norma Oficial Mexicana NOM-017-STPS-2008, Equipo de protección personal-Selección, uso y manejo en los centros de trabajo. Diario Oficial de la Federación. http://www.stps.gob.mx/bp/secciones/dgsst/normatividad/normas/Nom-017.pdf (12 de abril de 2018). [ Links ]
Secretaría del Trabajo y Previsión Social (STPS). 2015. Guía para la evaluación del cumplimiento de la normatividad en seguridad y salud en el trabajo 2015. http://autogestion.stps.gob.mx:8162/pdf/Gu%C3%ADa%20ECNSST.pdf (12 de abril de 2018). [ Links ]
Sharpe, D. 2015. Your chi-square test is statistically significant: Now what? Practical Assessment, Research & Evaluation 20(8):1-10. [ Links ]
Varonen, U. and M. Mattila. 2000. The safety climate and its relationship to safety practices, safety of the work environment and occupational accidents in eight wood-processing companies. Accident Analysis & Prevention 32(6):761-769. [ Links ]
Received: November 24, 2018; Accepted: January 09, 2019
 Este es un artículo publicado en acceso abierto bajo una licencia Creative Commons
