


Serviços Personalizados
Journal
Artigo
 texto em
  Inglês (pdf)
 Artigo em XML
 Referências do artigo
 Enviar este artigo por email
Indicadores
-
 Citado por SciELO
 -
 Acessos
Links relacionados
-
 Similares em
SciELO
Similares em
SciELO
Compartilhar

 Permalink
Revista mexicana de ciencias forestales
versão impressa ISSN 2007-1132
Rev. mex. de cienc. forestales vol.10 no.52 México Mar./Abr. 2019
https://doi.org/10.29298/rmcf.v10i52.410
Articles
Genetic diversity and conservation of native pines in the Cupatitzio river basin, in Michoacán
1Facultad de Agrobiología Presidente Juárez, Universidad Michoacana de San Nicolás de Hidalgo. México.
The conservation of terrestrial habitats associated with hydrographic basin has as an intrinsic component the conservation of the genetic resources of the species that form the vegetation cover of these systems. The objective of the present study was to evaluate the levels of variation and genetic structure of pine populations found in the Cupatitzio river basin, in Michoacán, using four nuclear microsatellite markers. The study includes eight populations of four pine species found in the upper, middle and lower zones of the basin. The results show that the SL3 populations of P. pseudostrobus and RB6 of P. douglasiana contain the highest values of genetic variation (H E = 0.674 y H E = 0.615, respectively). The populations have significant levels of inbreeding (F IS between 0.057-0.544) and a moderate genetic differentiation (F ST between 0.094-0.152), that is moderately associated to the geographical distribution of the populations (R= 0. 443) and is clustered according to species. The upper zone of the Reserve, in Quinceo and in Tzararacua, had the lowest levels of genetic variation and the highest levels of inbreeding, so restoration activities in these localities is advisable. Likewise, in situ conservation activities in San Lorenzo and the lower part of the Reserve are suggested, since both populations have the largest effective size and are representative of the gene pool of the pine forests in the Cupatitzio basin.
Key words: Genetics; conservation; hydrographic basin; microsatellite markers; Pinus; restauration
La conservación de los hábitats terrestres asociados a cuencas hidrográficas tiene como componente intrínseco la conservación de los recursos genéticos de las especies que conforman la cubierta vegetal de estos sistemas. El objetivo del presente estudio fue evaluar los niveles de variación y estructura genética de las poblaciones de pino distribuidas en la cuenca del río Cupatitzio, en Michoacán, con el uso de cuatro microsatélites de núcleo. El estudio incluye ocho poblaciones de cuatro especies de pino distribuidas en las zonas altas, media y baja de la cuenca. Los resultados indican que las poblaciones SL3 de P. pseudostrobus y RB6 de P. douglasiana contienen los valores más altos de variación genética (H E =0.674 y H E = 0.615, respectivamente). Las poblaciones presentan importantes niveles de endogamia (F IS entre 0.057-0.544) y una diferenciación genética significativa (F ST entre 0.094-0.152), la cual se asocia de manera moderada con la distribución geográfica de las poblaciones (r= 0.443) y se agrupa de acuerdo con las especies. La parte alta de la Reserva, en Quinceo y la Tzaráracua, presenta los niveles más bajos de variación genética y los mayores niveles de endogamia, por lo que se recomienda hacer actividades de restauración en estas localidades. Así mismo, se sugieren actividades de conservación in situ en San Lorenzo y la parte baja de la Reserva, ya que ambas poblaciones presentan los tamaños efectivos más grandes y son representativas del acervo genético de los bosques de pino en la cuenca del Cupatitzio.
Palabras clave: Genética; conservación; cuenca hidrográfica; marcadores microsatélites; Pinus; restauración
Introduction
The Cupatitzio river basin forms part of the Purépecha Plateau, located within the Transverse Neovolcanic Axis in the state of Michoacán (Bravo et al., 2009). It is considered one of the areas of greatest silvicultural interest in the central-northern part of the state, with a unique hydrological and climatic influence both for the central region and for the Depresión del Balsas (Conanp, 2006). It is one of the most important areas for the recharge of aquifers that give rise to a higher number of 35 springs and the volumes of the Cupatitzio River (González, 2010, Conagua, 2015). Likewise, it provides diverse ecosystem services, such as the generation of electricity, drinking water and irrigation for fruit and vegetable crops (Conanp, 2006, Conagua, 2015).
Despite the importance of the basin for the region, the plant species that make up the vegetation cover of the water recharge zone have not been fully described (Bello and Madrigal, 1996), nor are there basic studies on the ecology and genetics of populations or communities, and, therefore, no reliable proposals have been made for the restoration and conservation of this hydrological system. The state of conservation of its forests is not good, since the frequent fires that occur and the change of land use, mainly for avocado orchards and urban areas, undoubtedly influence the loss of native vegetation, particularly Pinus species that are characteristic of the coniferous forests of this place (Bravo et al., 2009).
Molecular markers are one of the tools that are used to evaluate the genetic diversity of species, information that is useful to establish management and conservation criteria (Brown et al., 1989; Frankham, 2010). Nuclear microsatellites (SSRn) are effective markers for this purpose, they are codominant and highly polymorphic, so that detailed genetic information of populations and individuals can be obtained (e .g., levels of heterozygosis and inbreeding, rates of cross-linking and migration, analysis of paternity, certification of controlled crosses, pedigree analysis, among others (Rajora et al., 2000; Rajora and Mosseler, 2001; Delgado and Piñero, 2008; Ellstrand, 2014). There are few formally published works that use SSRn in Mexican pines (Dvorak et al., 2009; Delgado et al., 2011, 2013; Alfonso et al., 2014; Villalobos et al., 2014), and no study has been reported and no study focused on watersheds that use these molecular tools for the rescue of plant species is known in so far. Knowledge of the genetic diversity of the species that make up forest forests is essential for its effective conservation and sustain enible, which directly impacts on the integral maintenance of the associated water systems (FAO, 2009; Potter et al., 2017).
In this sense, it was hypothesized that pine species distributed in the Cupatitzio river basin contain low levels of genetic variation with a marked genetic structure among the populations. The objectives were: i) to estimate the levels of variation and genetic structure, the inbreeding index and the effective sizes of the populations of four Pinus species distributed in the Cupatitzio river basin; and ii) analyze the genetic relationships of populations and their association with geographical distribution.
Based on the results, nuclei of greater genetic diversity are proposed, as well as strategic points for the restoration and conservation of the pine tree cover in the basin.
Materials and Methods
Study area
The Cupatitzio river basin forms part of the hydrological region of the Balsas River (RH18), within the Tepalcatepec-Infiernillo (I) hydrological sub-region (Inegi, 1985; DOF, 2011). It is located in the western part of Michoacán State; it is made up of the of Uruapan, Nuevo Parangaricutiro, Gabriel Zamora, Francisco Javier Múgica and Parácuaro municipalities (DOF, 2011). It is located between 18º49'58" and 19º36'11" N and 101º59'30" and 102º13'16" W, with an approximate area of 2 659.03 km² (Conagua, 2009) (Figure 1).
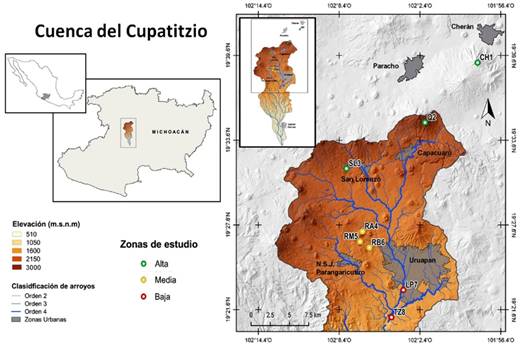
Cuenca del Cupatitzio = Cupatitzio river basin; Elevación = Elevation; Clasificación de arroyos = Stream classification; Orden = Order, Zonas urbanas = Urban sites; Zonas de estudio = Study areas; Alta = High; Media = Medium; Baja = Low.
Figure 1 Geographic location of Pinus populations collected in the Cupatitzio river basin in Michoacán.
The dominant vegetation is the coniferous forest with three types: pine forest, pine-oak forest and mountain mesophilic forest (Bello and Madrigal, 1996). Soils are of the Andosol type in the upper part of the basin, Luvisol and Acrisol in the middle part, and Regosol and Vertisol in the lower part (Inegi, 1985). The climate corresponds to the temperate climate, humid semi-warm type with abundant rainfall in summer (A)C(m)(w) (Inegi, 2010).
The study area was divided into three geographical zones due to the different pine species: the upper part or recharge area of the basin, with three populations; Cherán (CH1), represented by Pinus montezumae Lamb, Quinceo (Q2) and San Lorenzo (SL3), represented by Pinus pseudostrobus Lindl. The middle part, which includes the Barranca del Cupatitzio National Park Reserve, with three populations: high reserve (RA4), medium reserve (RM5) and low reserve (RB6), represented by Pinus douglasiana Martínez. The third zone, the lower part of the basin, includes La Pinera (LP7) and Tzaráracua (TZ8) sites, represented by Pinus oocarpa Schiede, with eight sampled populations (Table 1 and Figure 1). It is worth mentioning that the town of Cherán is not within the Cupatitzio basin, however, as it is part of the upper recharge zone of aquifers, it was important to include it in the actual study.
Table 1 Geographic location of the collection sites of the populations under study of the Pinus genus.
| Zone/Species | Site | ID | Geographic location | Altitude (masl) | |
|---|---|---|---|---|---|
| North | |||||
| P. montezumae | Cherán | CH1 | 19°39´5.53” N | 101°58´7.17” W | 2 956 |
| P. pseudostrobus | Quinceo | Q2 | 19°35´53.9” N | 102°02´11.7” W | 2 810 |
| P. pseudostrobus | San Lorenzo | SL3 | 19°31’35.4” N | 102°07´51.3” W | 2 246 |
| Center | |||||
| P. douglasiana | High reserve | RA4 | 19°26’24.7” N | 102°06'58.1” W | 2 066 |
| P. douglasiana | Medium reserve | RM5 | 19°26’25.3” N | 102°06'51.2” W | 2 035 |
| P. douglasiana | Low reserve | RB6 | 19°25’59.7” N | 102°06’9.30” W | 1 834 |
| South | |||||
| P. oocarpa | La Pinera | LP7 | 19°22’59.46” N | 102°3'37.9” W | 1 656 |
| P. oocarpa | Tzaráracua | TZ8 | 19°21’03.4” N | 102°04'30.8” W | 1 481 |
Foliar material was collected for each species from five to 19 trees per population, based on the density of the trees, with a total of 102 samples, which were stored in plastic bags and placed in an ultra-freezer at -80 °C, until their use.
Molecular data
The extraction of DNA was done with the CTAB mini-prep method for pines (Delgado et al., 2013). Five core microsatellites (SSRn) isolated from Pinus taeda L. (Karhu, 2001) were tested, of which four were selected that were polymorphic and reproducible (PtTX3013, PtTX3025, PtTX2146, PtTX2123). The amplification of microsatellites was in accordance with Elsik et al. (2000), with changes in the concentration of magnesium chloride (4mM) (Delgado et al., 2013). The amplified fragments were separated by electrophoresis in polyacrylamide gels (7 % 8M urea, 0.5 % TBE buffer), run in manual sequencing chambers at 60 Volts, for 2-3 h from the size of the fragments (Karhu, 2001). To observe them, the gels were revealed with silver nitrate (Delgado et al., 2013), and their size was determined by means of a 10 bp marker (InvitrogenTM), as a reference.
Data analysis
The estimators of the genetic variation that were obtained were the following: percentage of polymorphic loci (% P), total number of alleles (A), average of alleles per locus (N A ), observed heterozygosis (H o ) and expected (H E ) (Nei, 1987) with the formula:
The index of fixation or inbreeding (FIS) that was obtained as:
The deviation of the Hardy-Weinberg equilibrium was estimated with the nonparametric method of Marco and Monte Carlo chains (MCMC) with 100 000 permutations (Guo and Thomson, 1992). The analyzes were obtained with the program Arlequin v. 3.5.1.2 (Excoffier and Lischer, 2010). Exact linkage disequilibrium tests were performed for each pair of loci for the populations of each species and a global one with Fisher's exact method, obtained with the GENEPOP v. Program. 4.4 (Rousset, 2008). For the four SSRn used, the frequency of null alleles was determined with the FreeNa program (Chapuis and Estoup, 2007).
The effective size (N e ), that is, the number of individuals that contribute to reproduction (Hartl and Clark, 1997), was estimated indirectly according to the formula:
modified for microsatellites (Excoffier and Lischer, 2010). Since the parameter θ = 4Neμ (Kimura, 1968), and assuming a mutation rate (μ) of 10-3 per generation, the N e was estimated as θ / 4X10⁻³ (Boys et al., 2005; Delgado et al., 2011; 2013; Rebolledo et al., 2018).
The genetic structure was determined with an analysis of molecular variance (AMOVA), between and within the populations of each species, with the use of the models of infinite allele mutation (AMI) (Weir, 1996) and step by step (SMM) (Slatkin, 1995). The statistical significance was obtained with 1 000 nonparametric permutations (Excoffier and Lischer, 2010). The parameter M, which is the migration rate (M = Nm) between pairs of populations, was obtained with the formula M = (1 / F ST -1) / 4 (Slatkin, 1993). All estimates were made with the Harlequin program 3.5.1.2 version (Excoffier and Lischer, 2010).
To analyze the genetic relationships of the populations, a Neighbor-joining dendrogram was constructed, based on standardized genetic distances (Da) (Nei et al., 1983). The robustness of the topology was evaluated with a bootstrap value of 10 000 (Takezaki and Nei, 1996), with the use of the Poptree2 program (Takezaki et al., 2010). The association between the geographic and genetic structure of the populations was obtained through a Bayesian cluster analysis with the BAPS program (Corander et al., 2008). This method uses information from the spatial distribution of populations to define the most probable genetic structure. They were assumed from 1-8 groups (K), with 10 replicates per K with 10 000 iterations, preceded by 10 000 initial iterations.
Finally, an isolation analysis was made by distance between pairs of populations and their geographical distribution, by means of a Mantel test with 1 000 permutations (IBD) (Bohonank, 2002). The paired values of the FST statistic (Slatkin, 1995) and the absolute geographical distances in kilometers obtained through the Mercator transformation with the Quantum GIS Geographic Information System (v. 2.16 Nødebo) program (QGIS Development Team, 2016).
Results and Discussion
Diversity and genetic structure
A total of 37 alleles were recorded in a range of 13 (PtTX2146) to seven (PtTX3013) per locus. P. montezumae and P. pseudostrobus had the highest number of alleles (18 and 17 respectively), followed by P. douglasiana (14) and P. oocarpa (13). The total number of alleles between the populations of each species was different: those of LS3 of P. pseudostrobus with 23 and RB6 of P. douglasiana with 19 had the highest number; Q2 and RA4 of the same species, the smallest number, with 11 and nine alleles respectively (Figure 2, Table 2). They were detected from one to four unique alleles (present in a single population), with frequencies between 0.033-0.150. The RB6 population of P. douglasiana had three unique alleles, CH1 of P. montezumae, Q2 and SL3 of P. pseudostrobus and TZ8 of P. oocarpa had two alleles, while the rest of the populations did not identify any.
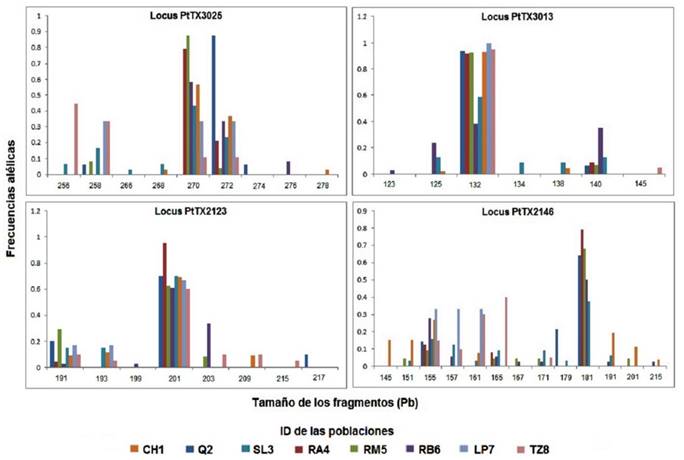
Frecuencias alélicas = Allele frequencies; Tamaño de los fragmentos = Size of fragments; ID de las poblaciones = ID of the populations.
Figure 2 Allele frequencies for the four loci analyzed in the Pinus genus populations of the Cupatitzio river basin, Michoacán, Mexico.
Table 2 Estimates of the genetic variation of eight populations of the genus Pinus distributed in the Cupatitzio River basin, Michoacán, México.
| Zone/species | Site | N | A | N a | H O | H E | F IS | N e |
|---|---|---|---|---|---|---|---|---|
| High P. montezumae |
CH1 | 18 | 18 | 4.5 (2.060) |
0.338 (0.143) |
0.512** (0.294) |
0.339* | 835 |
| P. pseudostrobus | Q2 | 10 | 11 | 3.0 (0.500) |
0.300 (0.180) |
0.359 (0.216) |
0.164 | 360 |
| P. pseudostrobus | SL3 | 16 | 23 | 5.7 (2.082) |
0.449 (0.214) |
0.674* (0.127) |
0.333** | 2104 |
| Average | 4.4 (1.546) |
0.362 (0.179) |
0.515* (0.227) |
1099 | ||||
| RA4 | 10 | 9 | 2.5 (0.250) |
0.189 (0.156) |
0.240* (0.136) |
0.218* | 183 | |
| Middle | RM5 | 14 | 15 | 4.0 (2.217) |
0.337 (0.314) |
0.364 (0.229) |
0.074 | 369 |
| P. douglasiana | RB6 | 19 | 19 | 5.0 (2.217) |
0.580 (0.302) |
0.615* (0.094) |
0.057 | 1439 |
| Average | 3.833 (1.561) |
0.368 (0.257) |
0.406* (0.153) |
664 | ||||
| Low | LP7 | 5 | 9 | 3.0 (0.000) |
0.300 (0.246) |
0.466** (0.111) |
0.393** | 627 |
| P. oocarpa | TZ8 | 10 | 17 | 4.5 (1.708) |
0.250 (0.254) |
0.516** (0.308) |
0.544** | 818 |
| Average | 3.75 (1.708) |
0.275 (0.250) |
0.491** (0.316) |
722 | ||||
| General average | 15.1 | 4.02 (1.605) |
0.341 (0.228) |
0.469** (0.232) |
0.286* |
N = Number of individuals; A = Total number of alleles; N a = Average bumber of alleles per locus; H o = Observed heterocigosis; H E = Expected hetorocigosis; F IS = Endogamy index; N e = Real size. Standard deviation is in parenthesis. **P=< 0.000, *P=< 0.05.
When comparing the results obtained with those of other studies conducted with SSRn (Delgado et al., 2011, 2013; Karhu et al., 2006), the number of alleles was higher than those of a population of P. pseudostrobus (19) and another of P. montezumae (18) distributed in Michoacán (Delgado et al., 2013), the only two populations of P. caribae var. hondurensis (Sénécl.) W. H. Barret & Golfari for Mexico (17) (Delgado et al., 2011) and five populations of P. radiata D. Don in California, United States of America and Baja California, Mexico (8) (Karhu et al., 2006). P. oocarpa was the only species with an average value lower than those recorded, except for the study of P. radiata (Karhu et al., 2006). These figures indicate that although the populations of the Cupatitzio basin are fragmented, they still preserve allelic variants, so it could be considered that the gene drift has not acted in an important way in the fixation or loss of this form of diversity in the populations.
The H o on average was lower than the H E for the four species analyzed. The average of H o in P. pseudostrobus and P. douglasiana were the highest (H o = 0.378 and 0.368, respectively), while the lowest values were calculated for P. montezumae (H o = 0.338) and P. oocarpa (H o = 0.275). In contrast, HE values differed between species; P. pseudostrobus recorded the highest value, followed by P. montezumae, P. oocarpa and P. douglasiana (Table 2). The above shows that the values deviate from the Hardy-Weinberg equilibrium, and were significant for the four species (p <0.05) (Table 2).
At the population level, the average of the Ho was also lower than the H E . The highest values were found in the SL3 populations (H o = 0.449, H H E = 0.674) of P. pseudostrobus and RB6 (H o = to 0.580, H E = 0.615) of P. douglasiana, while the lowest were obtained for the population of RA4 (H o = 0.189; H E = 0.240) of P. douglasiana and P7 of P. oocarpa with a much lower H o (0.250) than the H E (0.516) (Table 2). Most values deviate significantly from the Hardy-Weinberg equilibrium (p <0.05), suggesting different intensities of inbreeding.
In general, the results reflect a heterogeneity in the amount of genetic variation within the different populations and zones. However, the values are within those reported for other pine species, such as P. oocarpa (H E = 0.642) (Dvorak et al., 2009), P. patula Schiede. exSchl. & Cham and P. tecunumanii Eguiluz et Perry (H E = 0.567 and 0.646 respectively) (Dvorak et al., 2009), P. pseudostrobus and P. montezumae (H E = 0.277 and 0.274 respectively) (Delgado et al., 2013), P. mugo Turra (H E = 0.440) (Zukowska and Wachowiak, 2017), P. sylvestris L. (H E = 0.772) (Bilgen and Kaya, 2017) and P. caribaea var. hondurensis (H E = 0.575) (Rebolledo et al., 2018), indicating an intermediate and sufficient genetic diversity for the maintenance and possible adaptation of the species to environmental changes.
Endogamy and effective size
The average of the inbreeding index (F IS ) was high and significant (F IS = 0.286), so it deviates from the Hardy-Weinberg equilibrium (Table 2). The populations with the highest levels were LP7 (F IS = 0.393 **, P = 0.000) and TZ8 (F IS = 0.544 **, P = 0.000), both of P. oocarpa. These results suggest that populations of the Cupatitzio basin are not in genetic equilibrium, probably due to the effect of reproduction among close relatives. The values are relatively higher than those obtained with the use of SSRn in other pine species (P. patula, F IS = 0.148, P. tecunumanii, F IS = 0.109) (Dvorak et al., 2009); P. caribaea var. hondurensis, F IS = 0.163 (Delgado et al., 2011). This shows that although populations contain important levels of genetic variation (such as higher number of alleles or high levels of H E ), there are processes such as inbreeding that cause the frequencies of genotypes and alleles to deviate from genetic balance (Hartl and Clark, 1997; Holsinger, 2000).
The high values of inbreeding, and therefore, the deficit of heterozygotes observed in the population, can be explained by the presence of null alleles (alleles not expressed) that give rise to erroneous values that deviate populations from the panmixia (Shinde et al., 2003). In the analysis for the detection of null alleles, only the PtTX3025 locus in the TZ8 population of P. oocarpa showed a frequency higher than 0.200 (0.295). However, for this species, significant inbreeding values were also detected (F IS = 0.150, P <0.05) with the use of SRNS (including the PtTX3025 locus) for 51 populations distributed in Mexico, Guatemala, Honduras and Nicaragua (Dvorak et al., 2009). The TZ8 population had a significant inbreeding coefficient (F IS = 0.204, P <0.05), so it is pertinent to consider that the deviation of panmixia from this locus is determined by the effect of inbreeding and not by the frequency of null alleles. Likewise, no evidence of linkage disequilibrium was recognized for any of the pairs of loci analyzed in each species or with the global test (P> 0.05), which indicates that those used are segregated independently, and, therefore, they do not overestimate the F IS values obtained.
The effective size (N e ) was again higher in P. pseudostrobus, followed by P. montezumae, P. oocarpa and P. douglasiana. However, the values at the level of the populations of each species were contrasting; the SL3 population of P. pseudostrobus presented the highest N e (2 104), while the Q2 population had one of the lowest values (N e = 360). In P. douglasiana the RB6 population had a high value (Ne = 1 439), and in the RA4 population the lowest value was obtained (N e = 183). In the two populations of P. oocarpa, with the highest inbreeding levels, the estimates of N e were intermediate (Table 2). Therefore, it could be considered that the resulting N e estimates are enough to preserve the genetic variability of the species in the Cupatitzio basin.
Currently there are few studies that have estimated the N e with the use of SSRn in pines, as is the case of Pinus resinosa Ait, distributed in the United States of America, with fragmented populations (N e between 62-222) (Boys et al., 2005 ), of P. caribaea var. hondurensis (N e between 402-868) (Delgado et al., 2011), with only two populations fragmented and restricted to the southeast of Mexico, as well as some populations of this variety and P. caribaea var. caribaea Morelet, and P. caribaea var. bahamensis (Griseb.) W. H. Barret, distributed in the Caribbean basin (N e between 161-537) (Rebolledo et al., 2018).
When comparing these results with those obtained in the study, it is observed that most of the values are relatively higher. It is therefore very likely that the fragmentation of some of the populations such as RB6 (N e = 1 439) is very recent and that the effects of genetic drift or inbreeding are not yet reflected in the reduction of their genetic variability, and therefore in the estimates of their effective sizes.
Genetic structure and genetic flow
The estimation of the genetic differentiation between the populations of P. pseudostrobus and P. douglasiana was higher and significant with the F ST statistic (0.152 and 0.131, respectively) than with R ST , although for P. pseudostrobus both indexes were significant (P <0.05) (Table 3). It is likely that for these species migration makes a greater contribution to the genetic differentiation of populations compared to the mutation, which does not follow a strict model (Crow and Aoki, 1984; Balloux and Goudet, 2002). For P. oocarpa the F ST statistic was lower (0.094) to R ST (0.295), although both were significant (P <0.01). In this case, the effect of the mutation is not negligible with respect to migration and could be the most probable cause of the differentiation observed (Balloux and Goudet, 2002) (Hardy et al., 2003).
Table 3 AMOVA analysis obtained with the models of mutation of infinite alleles (AMI, above the diagonal) and step by step (SMM, below the diagonal) for the Pinus pseudostrobus Lindl., Pinus douglasiana Martínez and Pinus oocarpa Schiede studied populations in the Cupatitzio River Basin.
| Variation source | df | Variation components |
Variation percentage |
Fst/Rst average over the loci |
P value |
|---|---|---|---|---|---|
| P. pseudostrobus | |||||
| Among populations | 1 | 5.677/56.592 | 15.241/12.091 | 0.152***/0.121* | 0.000/0.015 |
| Within populations | 50 | 46.526/411.456 | 84.759/87.901 | ||
| Total | 51 | 1.267/20964.1 | |||
| P. douglasiana | |||||
| Among populations | 2 | 0.138/3.655 | 13.061/1.948 | 0.131***/0.019 | 0.000/0.194 |
| Within populations | 87 | 0.872/184.913 | 86.939/97.105 | ||
| Total | 89 | 1.004/198.433 | |||
| P. oocarpa | |||||
| Among populations | 1 | 0.1096/37.074 | 9.408/29.591 | 0.094*/0.295*** | 0.015/0.000 |
| Within populations | 28 | 1.055/88.214 | 90.592/70.409 | ||
| Total | 29 | 1.1649/125.288 | |||
The statistical significance was obtained with 1000 non-parametric permutations (Excoffier and Lischer, 2010). *P ≤ 0.05; ** P≤ 0.01; ***P≤ 0.001.
At present, there is no consensus on the accuracy of the estimates with both mutation models, but it has been experimentally and empirically tested, that it depends, to a large extent, on the size of the populations, the sample size and the number of analyzed loci. (Gaggiotti et al., 1999; Balloux and Goudet, 2002), with a greater sensitivity of the R ST statistic to small sample sizes or to the use of few loci (<8), because their estimates have a higher variance than with F ST (Golstein et al., 1995; Slatkin 1995; Balloux and Goudet, 2002; Hardy et al., 2003). For this last statistic, the number of populations does not have to be infinite, nor necessarily very large for the genetic structure, and, therefore, the estimates of Nm, to be more accurate (Niegel, 2002).
For the estimation of the genetic structure of Mexican pine species through the use of SSRn in particular, the F ST statistic was used, which resulted in values between 0.059 in P. patula and 0.131 in P. oocarpa (Dvorak et al., 2009; Alfonso et al., 2014); in the present study higher values were obtained, except for P. oocarpa. Thus, the estimated Nm for the latter species is relatively higher (Nm = 2.41) compared to P. pseudostrobus and P. douglasiana (Nm = 1.40 and Nm = 1.66 respectively).
In works for Mexican pine species, the Nm values calculated with SSRn vary between 1.81 in P. patula and 13.2 in P. caribaea var. hondurensis (Dvorak et al., 2009; Delgado et al., 2011). However, it is documented that units greater than 1.0 Nm are sufficient to homogenize the allelic frequencies among the populations of some plant species and prevent genetic differentiation (Hartl and Clark, 1997).
Conifers, in general, have dispersion mechanisms by wind, both pollen and seeds, so the estimated genetic flow is generally greater than 1.5 units (Hamrick et al., 1995). Although they also have the capacity to self-pollinate since most of them are mono- and self-compatible species (Williams, 2008). Therefore, it can be considered that, although some of the populations show important levels of inbreeding, they have the possibility of exchanging allelic variants (by the values of Nm obtained), which prevents a marked genetic separation, besides that they contain alleles that are shared among the populations of each zone, as well as differential alleles among the populations of the species of interest.
Genetic relationships and isolation by distance
The Neighbor-Joining analysis formed two groups: the first one represented by the populations distributed in the lower area of the sub-basin (P7 and TZ8), of P. oocarpa; and the second, located in the basal part of the dendrogram, formed by the population of P. montezumae (CH1) and one of the two populations of P. pseudostrobus (SL3) from the upper area of the sub-basin. The most derived or recent populations are composed of those at the middle zone, represented by P. douglasiana and a population of P. pseudostrobus (Q2) (Figure 3).
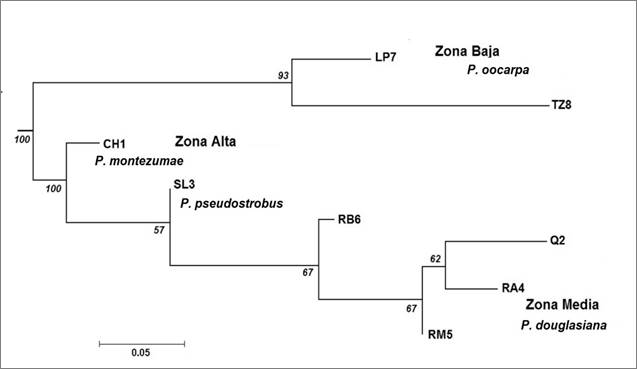
Zona Baja = Low zone, Zona Alta= Upper zone; Zona Media = Middle zone.
At the base of the branches are indicated the robustness percentages of the topology obtained with 1 000 re-sampling replications.
Figure 3 Neighbor-Joining Dendrogram, based on the genetic distances (Da) of Nei et al. (1983) among the populations of Pinus genus of the Cupatitzio river basin.
This result is very similar to that obtained with the Bayesian BAPS cluster analysis, which formed four groups (K4), with the highest marginal probability (LogML = -960.15, P = 1.000) (Figure 4). The first group represented by the CH6 population of P. montezumae; the second by the Q2 population of P. pseudostrobus; a third group formed by the SL3 population of P. pseudostrobus and the three populations of P. douglasiana; and the fourth group formed by P. oocarpa. They only differed in the second group formed by the population Q2, which in the dendrogram corresponds to the most derived population.
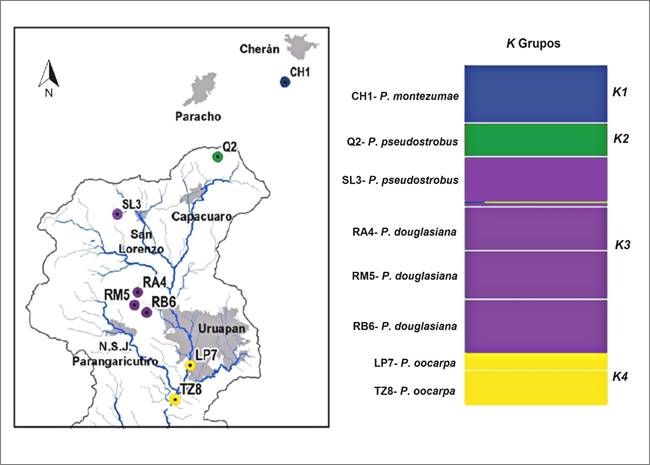
Figure 4 Bayesian BAPS grouping, obtained for the Pinus genus populations distributed in the Cupatitzio river basin. In color bars, the 4K groups selected with the most optimal partition of the data are represented (P = 1.000).
Both types of analysis indicate a tendency to group populations with their geographical distribution, which are represented by P. montezumae and P. pseudostrobus in the upper part of the basin, by P. douglasiana in the middle part and P. oocarpa in the lower part.
This association was partially verified with distance isolation analysis (IBD), with a moderate but significant correlation (r2 = 0.443, P <0.026), in which 44.3 % of the genetic differences observed are attributable to the geographical distance between populations.
It has been shown that IBD is more evident in some pine species that have a fragmented distribution, which have been obtained in several species analyzed with chloroplast microsatellites (SSRcp) (Delgado and Piñero, 2008; Moreno and Piñero, 2009; Jardón et al., 2011).
Only three papers have been reported with the use of SSRn in pines, showing a low but significant association: Pinus pinaster Ait in the Mediterranean basin in Europe (r = 0.360) (Mariette et al., 2001); P. resinosa that is located in the Northeast of the USA (r = 0.381) (Boys et al., 2005); and in the Caribbean pine complex for the Caribbean basin (r = 0.263) (Rebolledo et al., 2018). These results are similar to that obtained in the present study, so that a large part ((60 %) of the distribution of genetic variation could be linked to other factors, such as spatial fragmentation of populations, demarcated by both natural geomorphology of the basin, as by the change of land use, from forest to avocado or urbanization orchards (Bravo et al., 2009). This relationship is also influenced by the intrinsic genetic differences of the four taxa studied, which is observed in the analysis of Bayesian clustering and in the dendrogram obtained.
Recommendations for conservation
First, it is suggested to carry out in situ conservation activities of the SL3 populations of P. pseudostrobus and RB6 of P. douglasiana, distributed in the upper and middle zones of the basin respectively, since they were the populations that presented the highest levels of H E and of allelic variants, which could contain the representative gene pool of both species. The RB6 population of P. douglasiana is located within the Reserve area of the Barranca del Cupatitzio National Park, which has helped its conservation, while the SL3 population of P. pseudostrobus, which is distributed in the community of San Lorenzo, requires of mediate actions to delimit it in a formal way, which could be declared by the competent authorities as a Forest Management Unit (UMAFOR; Conafor, 2009), in such a way that both populations function as reservoirs of biodiversity and connectivity bridges with other populations or fragments (Aavick et al., 2014).
Likewise, the collection of seeds from these two populations is recommended since they contain the greatest genetic variability. This type of seeds should be used for large-scale plant production for restoration or reforestation purposes; particularly for the case of the Purépecha Plateau, where the mentioned populations are immersed.
On the other hand, the populations RA4 (middle zone) of P. douglasiana, TZ8 (low zone) of P. oocarpa and Q2 (upper zone) of P. pseudostrobus, presented the lowest levels of genetic variation, and for two of them the highest levels of inbreeding were obtained (RA4 and TZ8). Demographically, for the population of P. douglasiana in the upper part of the RA4 Reserve, little regeneration was observed and the lowest number of adult trees (<15), probably as a consequence of the frequent fires that have occurred in the area. The TZ8 population of P. oocarpa is also represented by few adult trees (<30), with no regeneration; in this case, it is mainly due to urban settlements, since the site is immersed in the southeastern region of Uruapan city. It is necessary to carry out restoration and repopulation activities based on the introduction of plants obtained from trees of P. pseudostrobus, P. douglasiana and P. oocarpa native to the region, to increase their census size and reduce the effect of inbreeding in the medium term.
In general, conservation and restoration strategies should be implemented focused on increasing the size of the populations, so that genetic diversity is maintained and with it, the biological, evolutionary and ecological representation of the pine species of the temperate forests of the basin of the Cupatitzio river.
Conclusions
The four pine species studied contain intermediate levels of genetic variation; the SL3 populations of P. pseudostrobus and RB6 of P. douglasiana present the highest values. However, most populations deviate from the Hardy-Weinberg equilibrium, so they show significant levels of inbreeding. Effective sizes and estimates of genetic flow are intermediate, but enough to prevent a marked genetic differentiation among populations, which was moderate but significant. The analysis of Bayesian clustering and genetic distances, group the populations according to their geographical distribution and taxonomic identity. It is necessary that within the conservation and restoration plans populations of the four species be considered, with the minimum prioritization of the populations that contain the highest levels of genetic variation, to ensure their permanence in these pine forests, which are essential for the proper functioning of the hydrological system of the Cupatitzio river basin.
Acknowledgements
The authors thank the Conacyt-State of Michoacán Mixed Funds for the financing granted to the project FOMIX-115897 of P. Delgado. To the communities of San Lorenzo, Cherán and Quinceo for allowing to work in their forests and support field work. Also, the reviewers that with their comments the manuscript became substantially improved.
REFERENCES
Aavik, T., R. Holderegger and J. Bolliger. 2014. The structural and functional connectivity of the grassland plant Lychnis flos-cuculi. Heredity 112(5): 471-478. [ Links ]
Alfonso C., C., J. Campos C., G. Sánchez G., A. Monsalvo R. y R. Clark T. 2014. Manejo forestal y diversidad genética de Pinus patula Schiede ex Schltdl. & Cham, en Sierra de Juárez, Oaxaca. Madera y Bosques 20(2): 11-22. doi: 10.21829/myb.2014.202160. [ Links ]
Balloux, F. and J. Goudet. 2002. Statistical properties of population differentiation estimators under stepwise mutation in a finite island model. Molecular Ecology 11(4): 771-783. [ Links ]
Bello G., M. A. y X. Madrigal S. 1996. Estudio florístico del Campo Experimental Barranca del Cupatitzio, Uruapan, Michoacán. INIFAP-Campo experimental Uruapan. Folleto Científico Núm. 2. Uruapan, Mich., México. 47 p. [ Links ]
Bilgen, B. B. and N. Kaya. 2017. Genetic diversity among Pinus sylvestris L. populations and its implications for genetic conservation: comparison of nuclear and chloroplast microsatellite markers. Fresenius Environmental Bulletin 26: 6873-6881. [ Links ]
Bohonak, A. J. 2002. IBD (Isolation by Distance): a program for analysis of isolation by distance. Journal of Heredity 93(2): 153-154. [ Links ]
Boys, J., M. Cherry and S. Dayanandan. 2005. Microsatellite analysis reveals genetically distinct populations of red pine (Pinus resinosa, Pinaceae). American Journal of Botany 92(5): 833-841. [ Links ]
Bravo, M., J. Sánchez, J. A. Vidales, J. T. Sáenz, J. G. Chávez, S. Madrigal, H. J. Muñoz, L. M. Tápia, G. Orozco, J. J. Alcántar, I. Vidales y E. Venegas. 2009. Impactos ambientales y socioeconómicos del cambio de uso del suelo forestal a huertos de aguacate en Michoacán. Instituto Nacional de Investigaciones Forestales, Agrícolas y Pecuarias. Centro de Investigación Regional Pacífico Centro. Campo Experimental Uruapan. Publicación especial Número 2. México, D. F. México. 76 p. [ Links ]
Brown, A. H. D., O. Frankel H., D. Marshall R. and J. Williams T. 1989. The use of plants genetic resources. Cambridge University Press. New York, NY USA. 382 p. [ Links ]
Comisión Nacional del Agua (Conagua). 2009. Programa hídrico visión 2030 del Estado de Michoacán de Ocampo. Secretaría de Medio Ambiente y Recursos Naturales. México, D. F, México. 176 p. [ Links ]
Comisión Nacional del Agua (Conagua). 2015. Actualización de la disponibilidad media anual de agua en el acuífero de Uruapan (1914), estado de Michoacán. Subdirección General Técnica. Gerencia de Aguas Subterráneas. Diario Oficial de la Federación. Comisión Nacional del Agua. México, D. F., México. pp. 1- 27 [ Links ]
Comisión Nacional de Áreas Naturales Protegidas (Conanp). 2006. Programa de conservación y manejo del Parque Nacional Barranca del Cupatitzio. Morelia, Mich., México. 173 p. [ Links ]
Comisión Nacional Forestal (Conafor). 2009. Guía para elaborar el estudio Regional Forestal de la Unidad de Manejo Forestal. Diario Oficial de la Federación. Comisión Nacional Forestal. Zapopan, Jal., México. 88 p. [ Links ]
Corander, J., J. Sirén and E. Arjas. 2008. Bayesian spatial modeling of genetic population structure. Computational Statistics 23(1): 111-129. [ Links ]
Crow, J. F. and K. Aoki. 1984. Group selection for a polygenic behavioural trait: estimating the degree of population subdivision. Proceedings of the National Academy of Sciences USA 81(19):6073-6077. [ Links ]
Chapuis, M. P. and A. Estoup. 2007. Microsatellite null alleles and estimationof population differentiation. Molecular Biology and Evolution 24(3): 621-631. doi: 10.1093/molbev/msl191. [ Links ]
Delgado, P. y D. Piñero. 2008. Marcadores moleculares, variación genética y filogeografía en árboles forestales. In: Sánchez V., L. R. (ed.). Ecología, Manejo y conservación de los ecosistemas de montaña en México. Editorial MundiPrensa México, S. A. de C. V. México, D. F., México. pp. 1-19. [ Links ]
Delgado, P., D. Piñero, L. Jardón B. and F. Chi M. 2011. Genetic variation and demographic contraction of the remnant populations of Mexican Caribbean pine (Pinus caribaea var. hondurensis: Pinaceae). Annals of Forest Science 68(1): 121-128. [ Links ]
Delgado, P. , J. Núñez, M. A. Rocha G. y F. H. Muñoz J. 2013. Variación genética de dos áreas semilleras de pino establecidas en Michoacán. Revista Mexicana de Ciencias Forestales 4(8): 104-115.doi. [ Links ]
Diario Oficial de la Federación (DOF). 2011. Acuerdo por el que se dan a conocer los estudios técnicos de aguas nacionales superficiales de la Región Hidrológica número 18 Balsas. http://dof.gob.mx/nota_detalle.php?codigo=5175730&fecha=26/0 (28 de julio de 2018). [ Links ]
Dvorak, W. S., K. Potter M., V. Hipkins D. and G. Hodge R. 2009. Genetic diversity and gene exchange in Pinus oocarpa, a Mesoamerican pine with resistance to the pitch canker fungus (Fusarium circinatum). International Journal of Plant Science 170(5):609-626. [ Links ]
Ellstrand, N. C. 2014. Gene flow, the most important evolutionary force in plants? American Journal of Botany 101(5):737-753. [ Links ]
Elsik, G. C., T. Minihan V, E. Hall S, M. Scarpa A. and G. Williams C. 2000. Low-copy microsatellite markers for Pinus taeda L. Genome 43(3): 550-555. [ Links ]
Excoffier, L. and H. Lischer E. 2010. Arlequin suite version 3.5: a new series of programs to perform population genetics analyses under Linux and Windows. Molecular Ecology Resources 10(3): 564-567. [ Links ]
Frankham, R. 2010. Challenges and opportunities of genetic approaches to biological conservation. Biological Conservation 143(9): 1919-1927. [ Links ]
Gaggiotti, O. E., O. Lange, K. Rassmann and C. Gliddon. 1999. A comparison of two indirect methods for estimating average levels of gene flow using microsatellite data. Molecular Ecology 7(9):1513-1520. [ Links ]
González P., C. 2010. Los manantiales del Cupatitzio, Uruapan. Apuntes sobre hidrología. Editorial Morevallado, S. R. L. de C. V. Morelia, Mich., México. 51 p. [ Links ]
Guo, W. , S. and A. E. Thompson. 1992. Performing the exact test of Hardy-Weinberg proportion for multiple alleles. Biometrics 48(2): 361-372. [ Links ]
Hamrick, J. L., M. J. Godt W. and S. L. Sherman B. 1995. Gene flow among plant populations: evidence from genetic markers. In: Hoch, P. C. and A. G. Stephenson (eds.). Experimental and molecular approaches to plant biosystematics. Monographs in Systematic Botany. Missouri Botanical Garden Press. St. Louis, MO USA. pp. 215-232. [ Links ]
Hardy, O. J., N. Charbonnel, H. Fréville and M. Heuertz. 2003. Microsatellite allele sizes: a simple test to assess their significance on genetic differentiation. Genetics 163(4):1467-1482. [ Links ]
Hartl, D. L. and A. G. Clark. 1997. Principles of population genetics. Sinauer Associates. Sunderland, UK. 682 p. [ Links ]
Holsinger, K. E. 2000. Reproductive systems and evolution in vascular plants. Proceedings of the National Academy of Sciences 97(13): 7037-7042. [ Links ]
Instituto Nacional de Estadística Geografía e Informática (Inegi). 1985. Síntesis geográfica del estado de Michoacán. Dirección General de Cartografía. Secretaría de Programación y Presupuesto. México, D. F., México. 316 p. [ Links ]
Instituto Nacional de Estadística Geografía e Informática (Inegi). 2010. Compendio de Información Geográfica Municipal. http://www.inegi.org.mx/geo/contenidos/topografia/compendio.aspx (7 de noviembre de 2018). [ Links ]
Jardón, L., P. Delgado, A. Vázquez L., G. Geada and D. Piñero. 2011. Phylogeography of Australes (Loudon) pine Subsection distributed on the Caribbean Basin. Annals of Botany 107(2): 229-241. [ Links ]
Karhu, A. 2001. Evolution and applications of pine microsatellites. Oulu University Press. Oulu, Finland. 51 p. [ Links ]
Karhu, A ., C. Vogl, G. F. Moran, J. C. Bell and O. Savolainen. 2006. Analysis of microsatellite variation in Pinus radiata reveals effects of genetic drift but no recent bottlenecks. Journal of Evolution and Biology 19(1): 167-175. [ Links ]
Kimura, M. 1968. Evolutionary rate at the molecular level. Nature 217 (5129): 624-626. [ Links ]
Mariette, S., D. Chagné, C. Lézier, P. Pastuszka, A. Raffin, C. Plomion and A. Kremer. 2001. Genetic diversity within and among Pinus pinaster populations: comparison between AFLP and microsatellite markers. Heredity 86(4): 469-479. [ Links ]
Moreno L., A. and D. Piñero. 2009. Phylogeographic structure of Pinus strobiformis Engelm. across the Chihuahuan Desert filter-barrier. Journal of Biogeography 36(1): 121-131. [ Links ]
Nei, M. 1987. Molecular evolutionary genetics. Columbia Univ. Press. New York, NY. USA. 512 p. [ Links ]
Nei, M. F., F. Tajima and Y. Tateno. 1983. Accuracy of estimated phylogenetic trees from molecular data. II. Gene frequences data. Journal of Molecular Evolution 19(2): 153-170. [ Links ]
Neigel, J. E. 2002. Is F ST obsolete? Conservation Genetics 3(2):167-173. [ Links ]
Organización de las Naciones Unidas para la Agricultura y la Alimentación (FAO). 2009. Los bosques y el agua. Estudio FAO Montes. No 155. Roma, Italia. 86 p. [ Links ]
Potter, K. M., R. Jetton M, A. Bower, F. Douglas, J. Man G, V. Hipkins D. and M. Westwood. 2017. Banking on the future: progress, challenges and opportunities for the genetic conservation of forest trees. New Forest 48(2): 153-180. [ Links ]
QGIS Development Team. 2016. Quantum GIS Geographic Information System (v. 2.16 Nødebo). Open Source Geospatial Foundation Project. http://www.qgis.osgeo.org (14 de enero de 2017). [ Links ]
Rajora, O. P., M. H. Rahman, G. P. Buchert and B. P. Dancik. 2000. Microsatellite DNA analysis of genetic effects of harvesting in old-growth eastern white pine (Pinus strobus) in Ontario, Canada. Molecular Ecology 9(3): 339-348. [ Links ]
Rajora, O. P. and A. Mosseler. 2001. Molecular markers in conservation, restoration and sustainable management of forest genetic resources. In: Muller S., G. and R. Schubert (eds.). Genetic response of forest system to changing environmental conditions. Forest Science Book Series, vol 70. Springer Dordrecht. Dodrecht, Holland. pp. 187-202. [ Links ]
Rousset, F. 2008. Genepop’007: a complete reimplementation of the Genepop software for Windows and Linux. Molecular Ecology Resources 8: 103-106. [ Links ]
Rebolledo, V., L. Jardón, I. Ramírez, A. Vázquez-Lobo, D. Piñero and P. Delgado. 2018. Genetic variation and dispersal patterns in three varieties of Pinus caribaea Morelet (Pinaceae) in the Caribbean Basin. Plant Ecology and Evolution 151 (1) 61-76. [ Links ]
Shinde, D., Y. L. Lai, F. Z. Sun and N. Arnheim. 2003. Taq DNA polymerase slippage mutation rates measured by PCR and quasi-likelihood analysis: (CA/GT)(n) and (A/T)(n) microsatellites. Nucleic Acid Research 31(3): 974-980. [ Links ]
Slatkin, M. 1993. Isolation by distance in equilibrium and not-equilibrium populations. Evolution 47(1): 264-279. [ Links ]
Slatkin, M. 1995. A measure of population subdivision based on microsatellite allele frequency. Genetics 139(1):457-462. [ Links ]
Takesaki, N. and M. Nei. 1996. Genetic distances y reconstruction of phylogenetics tree from microsatellite DNA. Genetics 144(1): 389-399. [ Links ]
Takezaki N., M. Nei. and K. Tamura. 2010. POPTREE2: software for constructing population trees from allele frequency data and computing other population statistics with Windows interface. Molecular Biology and Evolution 27(4): 747- 752. [ Links ]
Villalobos A., A. R., J. A. Pérez de la R., A. Arias and O. P. Rajora. 2014. Cross-species transferability of eastern white pine (Pinus strobus) nuclear microsatellite markers to five Mexican white pines. Genetics and Molecular Research 13(3): 7571-7576. [ Links ]
Weir, B. S. 1996. Genetic data analysis II. Sinauer Associates, Sunderland. Sunderland, MA USA. 445 p. [ Links ]
Williams, C. G. 2008. Selfed embryo death in Pinus taeda: a phenotypic profile. New Phytologist 178(1):210-222. [ Links ]
Wright, S. 1965. The interpretation of population structure by F- statisticswith special regard to systems of mating. Evolution 19(3): 395-420. [ Links ]
Zukowska, W. B. and W. Wachowiak. 2017. Nuclear microsatellite markers reveal the low genetic structure of Pinus mugo Turra (dwarf mountain pine) populations in Europe. Plant Systematics and Evolution 303(5):641-651. [ Links ]
Received: August 23, 2018; Accepted: February 01, 2019
 Este es un artículo publicado en acceso abierto bajo una licencia Creative Commons
