


Serviços Personalizados
Journal
Artigo
 texto em
  Inglês (pdf)
 Artigo em XML
 Referências do artigo
 Enviar este artigo por email
Indicadores
-
 Citado por SciELO
 -
 Acessos
Links relacionados
-
 Similares em
SciELO
Similares em
SciELO
Compartilhar

 Permalink
Revista mexicana de ciencias forestales
versão impressa ISSN 2007-1132
Rev. mex. de cienc. forestales vol.10 no.51 México 2019
https://doi.org/10.29298/rmcf.v10i51.113
Articles
Influence of cover, slope and depth, on soil carbon and nitrogen
1Universidad Autónoma Chapingo. División de Ciencias Forestales. México.
2Universidad Autónoma Chapingo. Departamento de Suelos. México.
The joint study of soil organic carbon (COS) and total soil nitrogen (Nt) is important because their cycles interact, they are also considered parameters of fertility, quality and impact. Its contents in the soil affect the productivity of the forests and are related to the mitigation of climate change when the soil is conserved. Soil sampling was carried out in the Zoquiapan Experimental Forest Station, with the aim of obtaining and analyzing the content of SOC and Nt of the soil at 0 to 10, 10 to 20 and 20 to 30 cm deep, with three slope degrees where fir, pine and pine-alder forests grow. The largest COS and Nt simks were located in the first 10 cm. The soil with the fir cover, greater slope and lower depth had the highest COS and Nt content (132.20 and 14.19 Mg ha-1 respectively). The soil with pine cover, slope and greater depth had the lowest contents of COS and Nt (30.86 and 3.37 Mg ha-1, respectively). It is concluded that the contents of COS and Nt showed differences by type of coverage, slope and depth. Although it was in relation to the depth that the contents of COS and Nt had a more regular behavior, decreasing as the depth increased, regardless of coverage and slope.
Key words: Forest; SOC; total nitrogen; fir; pine; pine-alder
El estudio conjunto del carbono orgánico del suelo (COS) y el nitrógeno total del suelo (Nt) es importante debido a que sus ciclos interaccionan, además de que son considerados parámetros de fertilidad, calidad e impacto. Sus contenidos en el suelo inciden en la productividad de los bosques y tienen relación con la mitigación del cambio climático cuando el suelo se conserva. Se realizó un muestreo de suelos en la Estación Forestal Experimental de Zoquiapan, con el objetivo de obtener y analizar el contenido de COS y Nt del suelo a las profundidades de 0 a 10, 10 a 20 y 20 a 30 cm, con tres grados de pendiente donde se desarrollan bosques de oyamel, pino y pino-aile. Los mayores almacenes de COS y Nt se ubicaron en los primeros 10 cm. El suelo con la cobertura de oyamel, pendiente mayor y profundidad menor presentó el mayor contenido de COS y Nt (132.20 y 14.19 Mg ha-1 respectivamente). El suelo con cobertura de pino, pendiente y profundidad mayor tuvo los contenidos más bajos de COS y Nt (30.86 y 3.37 Mg ha-1, respectivamente). Se concluye que los contenidos de COS y Nt mostraron diferencias por tipo de cobertura, por pendiente y por profundidad. Aunque fue con relación a la profundidad que los contenidos de COS y Nt tuvieron un comportamiento más regular, que disminuye a medida que la profundidad se incrementó, independientemente de la cobertura y pendiente.
Palabras clave: Bosque; COS; nitrógeno total; oyamel; pino; pino-aile
Introduction
The concentration and storage of carbon and nitrogen depend on many factors such as vegetation cover, relief, soil, water, and microorganisms, among other factors. Knowledge of the concentration or content of organic matter (OM) is essential to understand the carbon (C) and nitrogen (N) fluxes (Matus et al., 2000). Valtera et al. (2015) state that slope, slope exposure and forest cover are important because they explain the physical and chemical processes that occur in the soil, including the dynamics of the elements.
Vegetation is one of the most distinctive characteristics of forest soils and contributes to their physical, chemical and biological properties (Rivas et al., 2009). The total nitrogen (Nt) is part of the plant and animal residues deposited in the soil that go through a state of degradation and is stored in the OM; from its chemical form and quantity, it can fulfill its role as a nutrient, improve growth and productivity, but the needs of N vary by ecosystem, so its availability is important (NADP, 2000).
Organic matter (OM), organic carbon (CO) and total nitrogen are parameters for the knowledge of soil fertility. Bastidas (2000) describes the term fertility as the capacity of the soil to supply plants with the nutrients for their development, understanding that the greater or lesser concentration is determined by the presence and behavior of environmental conditions.
Anaya et al. (2016) mentioned that the topographic location, slope and floristic composition influence the CO variation; concluded that the concentration of CO decreased with the depth of the soil, and that approximately 55 % is concentrated in the first 30 cm. Ávila et al. (2004) noted that the concentration of Nt decreased as the depth and slope of the land increased, this was mainly due to its adsorption by soil colloids below 80 cm. Alvarado et al. (2013) also affirmed that the increase of the COS in the surface is mainly due to the distribution and activity of the fine roots, in addition to the fall of litter.
The Nt and COS are considered indicators of soil quality, since when they are captured and stored for long periods of time, they act as an alternative to mitigate climate change due to the reduction of greenhouse gases (Orellana et al., 2012). The CO stored in the first 100 cm is estimated at a range of 1.462 to 1.548 Pg on the planet (Batjes, 1996), this carbon forms one of the main terrestrial compartments, greater than the biotic and atmospheric carbon (Peris, 2013).
Orjuela et al. (2010) determined the content of organic carbon in areas of natural regeneration in the Colombian Amazonia; there they found deposits of 57.3 Mg ha-1 of CO at 30 cm deep, which makes these areas good for storage potential of captured CO2.
Ávila et al. (2001) and Anaya et al. (2016) defined this capacity as one the ecological and environmental functions of the forest masses. Thus, the forest areas are more significant than those sites that are devoid of vegetation. In that context, Rivas et al. (2009) established that the change in land use affects the levels of CO and Nt in the soil, through the acceleration of the oxidation processes that alter the quantity and composition of OM; such changes vary according to climate, soil, vegetation and intensity of management practices.
Celaya et al. (2015) noted that the change in land use is the main factor of degradation of natural ecosystems, since they observed variations in the storage of N with annual losses of 12.5 kg ha-1, due to the transformation of the natural ecosystem to grasslands, finding higher concentrations of total nitrogen in soils under tree cover than in open spaces and pastures.
From their ability to generate ecosystem goods and contribute to the mitigation of the effects of the natural disasters prevailing at present, the preservation of forests is very valuable, as well as the application of public policies with this aim; therefore, it is essential to have information related to the storage of CO and Nt that serve as a baseline for the formulation of environmental projects.
Little has been studied the influence of the cover, the slope and the depth of the soil in these warehouses. In this context, the following objective of this investigation was proposed, which consisted in determining the influence of depth, slope and coverage factors on the content of COS and Nt in the soil of the forests of Zoquiapan, Mexico. It is assumed that the characteristics and magnitudes of these factors impact the physical, chemical and biological processes that occur in the soil and that determine the inputs, outputs and storage of COS and Nt in the soil, which determines their fertility, quality and capacity to reduce environmental impacts.
Materials and Methods
Study area
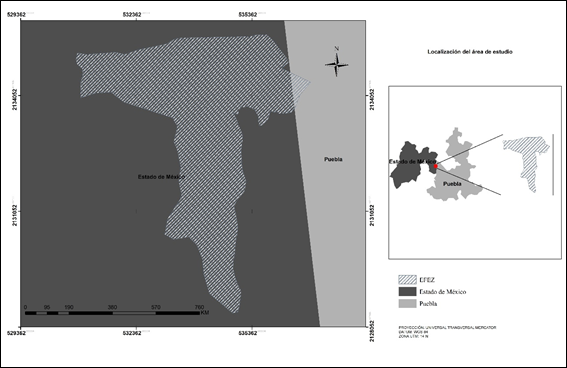
The experiment was carried out at the Zoquiapan Experimental Forest Station (EFEZ) located between 19°12'30 "and 19°20'00" N and 98°42'30 "and 98°30'00" W. One part is extended in the State of Mexico and another in the state of Puebla, (Figure 1). It has an area of 1 638 ha and an average altitude of 3 284 masl. The climate is subhumid temperate with rain in summer, with an average annual temperature of 11.1 ºC and an average annual rainfall of 964.1 mm (Inegi, 1981).
The predominant relief is mountainous, with some plains, with a variation in the slope of 2 to 50 % (Vega, 1982). The soils are classified as Molsic Andosols, with good aeration, good drainage, friable consistency and slightly sticky and plastic; the pH with values ranging between 5.06 and 6.3, moderately acidic and with good nutrient availability (Rey, 1975, Aguilar and Plateros, 2003).
The vegetation consists mainly of three high mountain communities: pine forest (Pinus hartewegii Lindl.) Widely distributed throughout the area covering 65 %; fir forest (Abies religiosa (Kunth) Schltdl. et Cham.) which occupies 10 % of the area, with a very closed canopy; and aile forest (Alnus jorullensis Kunth), which covers 24 % of the area, widely distributed throughout the season and in some places forms pure masses (Herrera and Rodríguez, 1975).
Location of sampling sites
To locate the sampling sites, in the first instance, the different types of vegetation or cover were obtained through the supervised classification of Landsat 8 images (Path 26 and Row 47). The types of vegetation were: oak-pine forest, fir forest, pine forest, pine-alder forest, pine-fir forest and pasture. Of these, three were selected: pine forest, firforest and the pine-alder forest association, because they cover about 90 % of the total area of the EFEZ.
To estimate the slope of the terrain, the digital elevation model (MED) with spatial resolution of 15 m was used (Inegi, 2013); by the ArcGIS version 10.3® software and the Slope tool, a raster file was generated with land slope values, which were classified into three categories: 0-10.10, 10.10-21.16 and 21.16-48.43 degrees. By means of the intersection of the layers of coverage and slope, a map of systems with the same coverage and slope was obtained. Table 1 describes the characteristics of the nine systems.
Table 1 Systems formed by the same coverage and slope.
| Number | Coverage | Slope range (degrees) | Area (ha) |
|---|---|---|---|
| 1 | Fir | 0-10.10 | 48.79 |
| 2 | Fir | 10.10-21.16 | 113.10 |
| 3 | Fir | 21.16.48.43 | 69.24 |
| 4 | Pine-adler | 0-10.10 | 120.34 |
| 5 | Pine-adler | 10.10-21.16 | 102.79 |
| 6 | Pine-adler | 21.16.48.43 | 143.27 |
| 7 | Pine | 0-10.10 | 502.88 |
| 8 | Pine | 10.10-21.16 | 260.31 |
| 9 | Pine | 21.16.48.43 | 92.79 |
| Total | 1 453.52 |
For the location of the sampling plots within the systems, homogeneous coverage and slope characteristics were considered, as well as the criteria established by NOM-021-Semarnat-2000 (Semarnat, 2002).
Soil sampling
Once the systems were delimited, in each one of them 10 circular plots of 400 m2 distributed regularly in the total area of the system were proposed, of which three were randomly chosen and georeferenced. In the field the plots were located and at the center of each of them the soil samples were extracted at 0 to 10, 10 to 20 and 20 to 30 cm deep; one for the determination of apparent density values, for which the cylinder auger (Eijkelkamp C) was used and the other for the analysis of the chemical properties of the soil, for which a Dutch type auger was used (Eijkelkamp C). In each site, 54 samples were collected (3 plots × 3 slopes × 3 depths × 2 types of sample). In total, 162 samples were collected.
Physical and Chemical Determinations
The samples were dried in an oven (THELCO 28) at 110 ± 5 °C until reaching a constant weight. Each sample was sifted and the bulk density determined by the test method (Sánchez et al., 2011). For the concentration of COS and Nt, they were dried in the open air and sifted through a 2 mm mesh, and then sent to the Laboratorio Central Universitario de la Universidad Autónoma Chapingo (Central University Laboratory of the Autonomous University of Chapingo) to conduct tests to calculate organic matter and Nt concentrations.
The concentration of organic carbon (CO) was estimated from organic matter by the method of Walkley and Black (1934); the concentration of CO was obtained by means of Van Benmelen factor 1.724, which was divided by the percentage of organic matter, since it is assumed that this component contains 58 % organic carbon. Such content was calculated based on the following equation (González et al., 2008):
Where:
COS = Organic carbon concentration in the soil (Mg ha-1)
Co = Carbon concentration in the soil (%)
Dap = Bulk density (g cm-3)
Ps = Soil depth (cm)
The concentration of total nitrogen was obtained by steam distillation with the micro-Kjeldahl process, from the following equation:
Where:
N-tot = Nitrogen concentration in the soil (%)
Dap = Bulk density (g cm-3)
Ps = Soil depth (cm)
Results and Discussion
In order to show the effect of slope and depth, the three slopes were named as low (0-10.10 degrees), intermediate (10.10-21.16 degrees) and high (21.16-48.43 degrees). The three depths as low (0 to 10 cm), intermediate (10 to 20 cm) and great (20 to 30 cm).
Coverage influence
For most of the values in Table 2, regular behavior of COS contents according to coverage is observed; for the three slopes and depths, the values are lower in the pine forest, they increase in the pine-adler forest and decrease in the fir forest with respect to those of pine and adler.
Table 2 Average values of soil organic carbon (COS) according to the coverage, slope and depth of the soil, in the forest of the Zoquiapan Experimental Station.
| z cm | RP (degrees) | Pine | Pine-Adler | Fir |
|---|---|---|---|---|
| COS (t ha-1) | ||||
| 0 a 10 | Low | 49.65 (± 9.67) | 130.80 (±5.83)+ | 89.74 (±9.01) |
| 10 a 20 | Low | 36.39 (±9.03)* | 122.47 (±22.5)+ | 90.56 (±9.16) |
| 20 a 30 | Low | 32.62(±3.01)* | 94.90 (±5.96) | 74.18 (±13.16) |
| Ʃ Coverage | 118.66 | 348.17 | 254.48 | |
| 0 a 10 | Intermediate | 118.81(±25.48) | 97.14 (±41.02) | 98.28 (±12.67) |
| 10 a 20 | Intermediate | 72.27 (±24.61) | 106.13 (±18.89) | 84.47 (±11.04) |
| 20 a 30 | Intermediate | 59.03 (±21.09) | 103.23 (±37.97) | 72.81 (±5.36) |
| Ʃ Coverage | 250.11 | 306.50 | 255.56 | |
| 0 a 10 | Great | 72.38 (±23.62) | 122.33 (±77.22) | 132.20 (±8.83)+ |
| 10 a 20 | Great | 38.90 (±5.19) | 67.90 (±19.66) | 70.63 (±4.19) |
| 20 a 30 | Great | 30.86 (±4.47)* | 52.88 (±13.53) | 55.06 (±20.37) |
| Ʃ Coverage | 142.14 | 243.11 | 257.89 | |
z = Depth; RP = Slope range; Low = (0-10.10 °); Intermediate = (10.10-21.16 °); Great = (21.16-48.43 °); (±) = Standard deviation value. *= The three lowest values of COS; + = The three highest values of COS.
Of the three highest COS values for the coverage, two corresponded to the one of pine-aile with 130.80 Mg ha-1 and 122.47 Mg ha-1; the third corresponded to the coverage of the fir community with 132.20 Mg ha-1. These figures are similar to those mentioned by Vela et al. (2012) who found COS contents in fir and pine conservation forests in Mexico City of 145.5 and 119 Mg ha-1, respectively. They also resemble those reported by Pérez et al. (2013), who conducted a study of the COS content in conserved areas in the Monarch Butterfly Biosphere Reserve in the State of Mexico, and calculated an average value of 153 Mg ha-1 in the soil. Regarding the three lower COS values, these corresponded to the pine coverage with 30.86 Mg ha-1, 32.62 Mg ha-1 and 36.39 Mg ha-1.
When analyzing the behavior of the COS content for the coverages in the three depths, it can be seen that the coverage with the highest COS contents was that of the pine-aile forest with 130.80, 122.47 and 94.90 Mg ha-1. The coverage with the lowest COS content for the three depths was that of pine with 49.65, 36.39 and 32.62 Mg ha-1. This behavior can be explained by the degree of conformation of the areas and forest management, since the pine-alder and fir coverages were the most compact and with less degradation in their interior, which contrasts with that of the pine forest, which shows intervention of productive activities of the livestock type.
Slope Influence
In general, the COS content based on the slope factor had a regular behavior in the pine coverage at the three depths, lower for the low and high slopes, and with an increase in the intermediate. For pine-adler coverage, there was an irregular behavior for the three slopes and three depths. In the 0-10 cm depth of the fir community, the COS content increased as the slope did, but for the 10 to 20 and 20 to 30 cm depths, the opposite occurred.
Of the three most outstanding values of COS as a function of slope, one was found at the steepest slope with 132.20 Mg ha-1, another at the intermediate with 122.47 Mg ha-1 and the third at the lowest at 130.80 and Mg ha-1.
It is noted that the slope with the highest COS content at the three depths was the low one with 130.80, 122.47 and 94.90 Mg ha-1 with the pine-alder cover. And the opposite was verified in the minor, with 49.65, 36.39 and 32.62 Mg ha-1 with the pine cover.
González et al. (2008) noted that in most plant ecosystems there is a tendency to concentrate more COS in the lower position of the slopes. The above statement is valid in the analysis of the effect of the greater and lesser slope for the three depths in the pine-alder cover.
Depth Influence
In most cases the COS content decreased with depth. The previous behavior coincides with the findings of Alvarado et al. (2013). According to the IPCC (1997), in soils the change in the COS is relatively small and occurs mainly in the first 30 cm of the soil layer. According to Schargel and Marvaez (2009), the above is due to the fact that organic carbon is linked to organic matter, so its abundance decreases with depth, since the accumulation of organic remains and the activity of microorganisms occurs in the first centimeters of the ground.
From the three highest COS values for depth, two were found from 0 to 10 cm with 132.20 and 130.80 Mg ha-1, and the third at 10-20 cm with 122.47 Mg ha-1.
Of the three lowest COS contents, two came from 20 to 30 cm, with 30.86 Mg ha-1 and 32.62 Mg ha-1, and the last one from 10 to 20 cm with 36.39 Mg ha-1.
Carbon content from 0 to 30 cm depth
Table 3 shows the COS contents of 0-30 cm depth, obtained as the sum of the three partial depths and as a function of the coverage and slope grades. It is observed that the coverage with the three most outstanding COS values were those of pine-adler with the lowest slope, followed by the same coverage with the intermediate slope and finally the one of fir with the steepest slope. The coverage with the three lowest values of COS was that of pine with the lowest and highest slopes and that of pine-adler with the highest slope. The COS contents obtained are higher than those calculated by other authors such as by Segura et al. (2005) in humid forests with 110.5 Mg ha-1. The differences may be due to the fact that temperate forests have lower temperatures compared to wet forests where mineralization rates are higher.
Table 3 Average values of soil total nitrogen (Nt) according to the coverage, slope and depth of the soil, in the forest of the Zoquiapan Experimental Station.
| z (cm) | RP (degrees) | Pine | Pine-Adler | Fir |
|---|---|---|---|---|
| Nt (t ha-1) | ||||
| 0 a 10 | Low | 5.67 (±0.46) | 10.57 (±1.89)+ | 10.08 (±2.82) |
| 10 a 20 | Low | 4.77 (±0.85) | 9.93 (±2.68) | 8.85 (±1.26) |
| 20 a 30 | Low | 5.03 (±0.71) | 9.33 (±0.31) | 7.62 (±0.65) |
| Ʃ Coverage | 15.47 | 29.83 | 26.55 | |
| 0 a 10 | Intermediate | 6.5 (±0.56) | 8.50 (±3.40) | 9.78 (±1.79) |
| 10 a 20 | Intermediate | 4.83 (±1.83) | 9.53 (±0.61) | 8.73 (±0.56) |
| 20 a 30 | Intermediate | 4.77 (±2.98) | 8.37 (±1.75) | 7.29 (±1.15) |
| Ʃ Coverage | 16.10 | 26.40 | 25.80 | |
| 0 a 10 | Great | 4.62 (±1.16)* | 11.61 (±6.04)+ | 14.19 (±3.13)+ |
| 10 a 20 | Great | 3.81(±0.84)* | 6.18 (±1.80) | 8.19 (±1.50) |
| 20 a 30 | Great | 3.37 (±0.83)* | 5.34 (±0.75) | 6.09 (±1.67) |
| Ʃ Coverage | 11.80 | 23.13 | 28.47 | |
z = Depth; RP = Slope range; Low = (0-10.10 °); Intermediate = (10.10-21.16 °); Great = (21.16-48.43 °); (±) = Standard deviation value. *= The three lowest values of Nt; + = The three highest values of Nt.
Coverage Influence
Similar to the COS, in Table 3 a regular behavior is observed for most of the Nt content values, depending on the coverage for the three slopes and depths, with lower values in the pine, increasing in pine- alder and diminishing in fir compared to that of pine and alder.
It is observed that the three covers with the highest Nt content in the soil were found in the fir community with 14.19 Mg ha-1, which is followed by the pine-alder with 11.61 Mg ha-1 and, thirdly, again is found in the pine-alder forest with 10.57 Mg ha-1. The coverage with the three lowest values of Nt was that of pine with 3.37 Mg ha-1, 3.81 Mg ha-1 and 4.62 Mg ha-1.
In the analysis of the Nt content for the three depths, it can be seen that the pine-alder coverage had the highest Nt content with 10.57, 9.93 and 9.33 Mg ha-1, respectively, and the pine cover had the lowest Nt content., with 4.62, 3.81 and 3.37 Mg ha-1. According to the classification of nitrogen and level of abundance in the soil (Semarnat, 2002), the fir forest and pine-alder forest are rich in this element; the pine forest was defined in the middle level range. Arzuaga et al. (2016) evaluated the content of Nt in the soil under cover of preserved pine forest, and calculated values of 2.69 Mg ha-1, while for the deforested areas there was a reduction of around 51 % in the first 30 cm.
Slope influence
The Nt values as a function of the slope showed the most irregular behavior. For the slopes with the pine cover and the lower and intermediate depths, it was lower for the lower slope, increased for the intermediate slope and decreased again with the steepest slope. For the greater depth, the content of Nt was smaller in the opposite direction to the slope. For the pine-alder cover at the depth of 0-10 cm, the content of Nt decreased when going from the lower slope to the intermediate slope, later it increased in the greater one. For the depths of 10 to 20 cm, the contents of Nt were lower as the slope increased. For the coverage of fir, the content of Nt was lower in the opposite direction to the slope for the depths of 10 to 20 and 20 to 30 cm, but to the 0 to 10 cm, it first decreased and then increased.
Two of the three highest Nt values were recorded on the higher slope with 14.19 Mg ha-1 and 11.61 Mg ha-1, and the third on the lower slope with 10.57 Mg ha-1. The three lower contents of Nt (3.37 Mg ha-1, 3.81 Mg ha-1 and 4.62 Mg ha-1) were recorded with the highest slope.
The slope with the highest Nt content at the three depths was the lowest, with 10.80, 9.93 and 9.33 Mg ha-1. The opposite was presented for the three depths in the greater, with 4.62, 3.81 and 3.37 Mg ha-1.
The results of the analysis and the comparison between the lower slope and the greater one allow us to affirm that the content of Nt decreased as the degree of inclination advanced, which is supported by the results obtained by Lozano et al. (2016); these authors asserted that the topography, slope and orientation of the land are variables that should be included in the estimates of Nt and COS at the local and regional scales, since there are differences in the stores of these nutrients. Ávila et al. (2004) noted that the concentration of Nt is reduced as the slope increases.
Depth Influence
The depth factor had the expected behavior for the content of Nt, since in most cases, regardless of the slope and coverage, it was reduced with depth in a similar way to what happened with the COS content. The above agrees with the results of Ávila et al. (2004), who pointed out in their study that the concentration of Nt decreased as the depth of the soil increased. This decrease, according to Schargel and Marvaez (2009), is due to the fact that nitrogen is linked to organic matter.
The three largest magnitudes of Nt content were for the depth of 0-10 cm with 14.19 Mg ha-1, followed by 11.61 Mg ha-1 and finally 10.57 Mg ha-1. The three lowest contents of Nt were given at the depth of 20 to 30 cm with 3.37 Mg ha-1, secondly to the 10 to 20 cm with 3.81 Mg ha-1 and thirdly that of 0 to 10 with 4.62 Mg ha-1.
Total nitrogen content from 0 to 30 cm depth
For Nt, the coverages with the three highest values were those of pine-alder with the lowest slope, followed by that of fir with the greater and lesser slope. The coverage with the three lowest values of Nt were those of pine with all slopes. These results were higher than those reported by Sacramento et al. (2013) of 10.15 Mg ha-1 in a natural system of the Sobral municipality, Ceará, Brazil and by Carvajal et al. (2009) of 10.41 Mg ha-1 in forest and 6.65 Mg ha-1 in coffee plantations.
The data obtained for the pine-alder coverage, and the content of Nt, agree with the fact that the areas covered by species of the genus Alnus (Alnus firmifolia) in association with pine, are of ecological value for the storage and fixation of N2; therefore, this hardwood species represents an alternative for the management of forest areas and recovery of nitrogen in the soil (Gutiérrez-Guzmán et al., 2005).
When intervention exists in the conserved areas, the storage of carbon and nitrogen decreased; the pine cover revealed the lowest values and the largest reservoirs were always for the pine-alder and fir forests. This fact could be explained by the composition and the greater magnitude of its plant covers, as they are better preserved.
Conclusions
Coverage had an effect on the contents of organic carbon (COS) and total nitrogen (Nt) of the soil with higher values for pine-alder, followed by fir and, finally, pine. The influence of slope was more irregular in the contents of COS and Nt because they did not follow the same pattern of behavior or in terms of coverage or depth. The depth was the factor of greater regularity in the variation of COS and Nt contents, because as depth increased, both decreased.
The deposits of the elements of interest are located in the first 10 cm deep, regardless of coverage and slope.
The most important COS and Nt contents were presented in the coverage without livestock intervention. The soil under fir cover, lower slope and 0-10 cm deep recorded the most outstanding values (132.20 and 14.19 Mg ha-1, respectively). The soil under the pine forest, greater slope and at 20-30 cm deep had the lowest contents (30.86 and 3.37 Mg ha-1, respectively).
It is concluded that despite having the same climate in the area under study, the contents of COS and Nt showed differences by type of coverage, slope and depth.
Acknowledgements
The first author wishes to express her gratitude to the Universidad Autónoma Chapingo (Chapingo Autonomous University) and to the División de Ciencias Forestales (Forest Sciences Division) in particular, for the opportunity to study the Master’s program. And to the Consejo Nacional de Ciencia y Tecnología (Conacyt) (National Council of Science and Tecnology- Conacyt) for the financial support provided for its accomplishment.
REFERENCES
Aguilar V., B. y G. P. A. Plateros. 2003. Monitoreo de Vegetación y Fauna en la Estación Forestal Experimental Zoquiapan. In: Memoria de la XIX Presentación de Trabajos de Investigación, Producción y Servicio de la Universidad Autónoma Chapingo. Texcoco, Edo. de Méx ., México. pp. 111-125. [ Links ]
Alvarado, J., H. A. Castañeda Jair y M. Segura. 2013. Almacenamiento de carbono orgánico en suelos en sistemas de producción de café (Coffea arabica L.) en el municipio del Líbano, Tolima, Colombia. Colombia Forestal 16 (1): 21-31. [ Links ]
Anaya, C. A., M. Mendoza, M. Rivera, R. Páez y L. D. Olivares-Martínez. 2016. Contenido de carbono orgánico y retención de agua en suelos de un bosque de niebla en Michoacán, México. Agrociencia 50: 251-269. [ Links ]
Arzuaga, S. A., D. Marcela T., S. M. Contreras L. y S. Vázquez. 2016. Stocks y relaciones de estratificación del carbono y nitrógeno en oxisoles bajo sistemas forestales. Asociación Argentina de Ciencias del Suelo 34(1):13-20. [ Links ]
Ávila, G., F. Jiménez; J. Beer, M. Gómez y M. Ibrahim. 2001. Almacenamiento, fijación de carbono y valoración de servicios ambientales en sistemas agroforestales en Costa Rica. Agroforestería de las Américas 8(30): 32-35. [ Links ]
Ávila, H., J. M. Harmand, E. Dambrine, F. Jiménez , J. Beer y R. Oliver. 2004. Dinámica del nitrógeno en el sistema agroforestal Coffea arabica con Eucalyptus deglupta en la Zona Sur de Costa Rica. Revista Agroforestería en las Américas 41: 83-91. [ Links ]
Bastidas, A. 2000. Diagnóstico de fertilidad de suelos en pendientes inferiores a 25 %. Boconó, estado Trujillo. Geoenseñanza 5: 229-246. http://www.redalyc.org/articulo.oa?id=36050205 (18 de mayo de 2017). [ Links ]
Batjes, N. H. 1996. Total carbon and nitrogen in the soils of the world. European Journal of Soil Science 47: 151-163. [ Links ]
Carvajal, A. F., A. Feijoo, H. Quintero y M. A. Rondón. 2009. Carbono orgánico del suelo en diferentes usos del terreno de paisajes andinos colombianos. Revista de la Ciencia del Suelo y Nutrición Vegetal 9(3): 222-235. [ Links ]
Celaya, M. H., O. García F., C. Rodríguez J. y V. A. Castellano E. 2015. Cambios en el almacenamiento de nitrógeno y agua en el suelo de un matorral desértico transformado a sabana de buffel (Pennisetum ciliare (L.) Link). Revista Terra Latinoamericana 33: 79-93. [ Links ]
González M., L., J. D. Etchevers B. y C. Hidalgo M. 2008. Carbono en suelos de ladera: factores que deben considerarse para determinar su cambio en el tiempo. Agrociencia 42(7): 741-751. http://www.scielo.org.mx/scielo.php?script=sci_arttext&pid=S1405 31952008000700001&lng=es&tlng=es (25 de marzo de 2016). [ Links ]
Gutiérrez-Guzmán, B., J. D. Etchevers-Barra, A. Velázquez-Martínez y J. Almaraz-Suárez. 2005. Influencia del aile (Alnus firmifolia) en el crecimiento de plantas de Pinus patula. Terra Latinoamericana 23(1):89-96. [ Links ]
Herrera H., B. y B. D. Rodríguez. 1975. Estudio integrado de los recursos físicos naturales del área de Zoquiapan Boletín de Información Técnica del Departamento de Bosques. Universidad Autónoma Chapingo. Texcoco, Edo. de Méx., México. 30 p. [ Links ]
Instituto Nacional de Estadística y Geografía (Inegi). 1981. Carta Estatal de climas escala 1: 500 000. s/p. [ Links ]
Instituto Nacional de Estadística y Geografía (Inegi). 2013. Continúo de Elevaciones Mexicano 3.0. http://www.inegi.org.mx/geo/contenidos/datosrelieve/continental/descarga.aspx (2 de septiembre de 2015). [ Links ]
Intergovernmental Panel on Climate Change (IPCC). 1997. IPCC Guidance for green house gas inventories - Cuadernillo de Trabajo (Volumen 2). http://www.ipcc.ch (10 de abril de 2017). [ Links ]
Lozano G., B., L. Parras A. and E. C. Brevik. 2016. Impact of topographic aspect and vegetation (native and reforested areas) on soil organic carbon and nitrogen budgets in Mediterranean natural areas. Science of the Total Environment 544 :963-970. [ Links ]
Matus, F. J., y Ch. R. Maire. 2000. Relación entre la materia orgánica del suelo, textura del suelo y tasas de mineralización de carbono y nitrógeno. Agricultura Técnica 60(2):112-126. [ Links ]
National Atmospheric Deposition Program (NADP). 2000. Centro Internacional para la Educación Química. El Nitrógeno en la lluvia Nacional, E.U., , http://nadp.sws.uiuc.edu/lib/brochures/nbrochespanol.pdf (4 de septiembre, 2016). [ Links ]
Orellana R., G., M. L. Sandoval S., G. Linares F., N. E. García C. y J. V. Tamariz F. 2012. Descripción de la dinámica de carbono en suelos forestales mediante un modelo de reservorios. Revista Avances en Ciencias e Ingeniería 3(1): 123-135. [ Links ]
Orjuela C., J. A., P. B. Ramírez L y C. H. Andrade J. 2010. Potencial de almacenamiento de carbono en áreas de regeneración natural de paisajes ganaderos de la Amazonia colombiana. Revista Facultad de Ciencias Agropecuarias 2(1):60-72. [ Links ]
Pérez R. S., M. I. Ramírez, P. Jaramillo L. y F. Bautista. 2013. Contenido de Carbono Orgánico en el suelo bajo diferentes condiciones forestales: Reserva de la biosfera mariposa monarca, México. Revista Chapingo, Serie Ciencias Forestales y del Ambiente 19(1): 157-173. [ Links ]
Peris M., M. B. 2013. El suelo como sumidero de CO2: Mapa de retención de CO2 de las tierras de labor de los distintos países de la Unión Europea. Revista de Medio Ambiente “Ojeando la Agenda” 24: 27-16. [ Links ]
Rey C., J. 1975. Estudios de suelo de la Estación de Enseñanza Investigación y Servicios Forestales de Zoquiapan, Universidad Autónoma Chapingo. Información técnica de bosques. Texcoco, Edo. de Méx., México. 64 p. [ Links ]
Rivas, Y., C. Oyarzún, R. Godoy y E. Valenzuela. 2009. Mineralización del nitrógeno, carbono y actividad enzimática del suelo en un bosque de Nothofagus obliqua (Mirb) Oerst y una plantación de Pinus radiata D. Don. del centro-sur de Chile. Revista Chilena de Historia Natural 82:119-134. [ Links ]
Sacramento, José Augusto Amorim Silva do, Araújo, Ana Caroline de Moraes, Escobar, Maria Eugenia Ortiz, Xavier, Francisco Alisson da Silva, Cavalcante, Ana Clara Rodrigues, & Oliveira, Teógenes Senna de . 2013. Soil carbon and nitrogen stocks in traditional agricultural and agroforestry systems in the semiarid region of Brazil. Revista Brasileira de Ciência do Solo 37(3): 784-795. [ Links ]
Sánchez J., R. C., D. L. Damián H., R. M. Cerón B., J. G. Cerón B. Retón, J. J. Guerra S., M. Rangel M. y J. C Zavala L. 2011. Determinación del carbono almacenado en suelo con asociación de mangle rojo en Nuevo Campechito, Campeche. U. Tecnociencia 5 (1): 1-7. http://www.unacar.mx/contenido/tecnociencia/tecnociencia_enero_junio11/tema_1_determinacion_del_carbono.pdf (1 de abril de 2017). [ Links ]
Secretaría de Medio Ambiente y Recursos Naturales (Semarnat). 2002. NOM-021-RECNAT-2000, Que estable las especificaciones de fertilidad, salinidad y clasificación de suelos. Estudios, muestreo y análisis para México. Diario Oficial de la Federación. diciembre 2002. México, D.F., México. (5 de abril de 2017). [ Links ]
Schargel, R. y P. Marvaez. 2009. Suelos. Estudio de los suelos y la vegetación (estructura, composición florística y diversidad) en bosques macrotérmicos no-inundables, Estado Amazonas, Venezuela. Biollania 9: 99-109. [ Links ]
Segura C., M. A., P. Sánchez G., C. A. Ortiz S. y M. C. Gutiérrez C. 2005. Carbono orgánico de los suelos de México. Terra Latinoamericana 23(1): 21-28. [ Links ]
Valtera, M., P. Samonil, M. Svoboda and P. Janda. 2015. Effects of topography and forest stand dynamics on soil morphology in three natural Picea abies mountain forest. Plant and Soil 392: 57-69. doi: 10.1007/s11104-015-2442-4. [ Links ]
Vega, A. R. 1982. Manual de la flora de la Estación Experimental de Enseñanza e Investigación y Servicios Forestales Zoquiapan. Tesis de Maestría en Ciencias. Colegio de Postgraduados. Texcoco, Edo. De Méx., México. 110 p. [ Links ]
Vela, C. G., G. M. L. Rodríguez y B. J. López. 2012. Niveles de carbono orgánico total en el Suelo de Conservación del Distrito Federal, centro de México. Investigaciones Geográficas 77:18-30. [ Links ]
Walkley, A. and I. A. Black. 1934. An examination of the Degtjareff method for determining soil organic matter, and a proposed modification of the chromic acid titration method. Soil Science 37(1): 29-38. [ Links ]
Received: January 05, 2017; Accepted: October 21, 2018
 Este es un artículo publicado en acceso abierto bajo una licencia Creative Commons
