


Servicios Personalizados
Revista
Articulo
 texto en
  Inglés (pdf)
 Artículo en XML
 Referencias del artículo
 Enviar artículo por email
Indicadores
-
 Citado por SciELO
 -
 Accesos
Links relacionados
-
 Similares en
SciELO
Similares en
SciELO
Compartir

 Permalink
Revista mexicana de ciencias forestales
versión impresa ISSN 2007-1132
Rev. mex. de cienc. forestales vol.10 no.51 México 2019
https://doi.org/10.29298/rmcf.v10i51.407
Articles
Local height-diameter models for Pinus montezumae Lamb. and Pinus teocote Schiede ex Schltdl. in Nanacamilpa, Tlaxcala
1INIFAP-CIR-Centro-Sitio Experimental Tlaxcala. México.
2INIFAP-CIR-Centro-Campo Experimental Valle de México. México.
3INIFAP-CIR-Golfo Centro-Campo Experimental San Martinito. México.
Field measurement of total height of standing trees imposes practical difficulties that increases time and costs of forest inventories. Moreover, height measurement is prone to mistakes especially in forests with dense understories. Allometric equations are a suitable option to estimate efficiently total height as a function of tree diameter. The aim of this study was to analyze allometric models to fit the total height-normal diameter relation for Pinus montezumae and P. teocote trees in the forest region of Nanacamilpa, Tlaxcala. Database consisted of 583 pairs of total height-normal diameter measurements for P. montezumae and 486 pairs for P. teocote covering a wide range of diameter classes. We evaluated 14 nonlinear and one linear models with regression analysis using the MODEL and REG procedures of SAS® respectively. Goodness of fit was assessed with R 2 adj , bias, root mean squared error, sum square error, mean square error, and Akaike’s information criterion. The best model for P. montezumae was Yang’s model (M2) with an R 2 adj =0.91, whereas the quadratic model (M10) was the best for P. teocote with an R 2 adj =0.87. Such models described with precision the relationship between height and diameter these tree species in the western region of the state of Tlaxcala.
Key words: Central Mexico; forest management; growth models; pines; non-linear regression; allometric relations
La medición en campo de la altura total de los árboles implica dificultades prácticas que incrementan los tiempos y costos del inventario. Además, su medición está propensa a errores, en particular en sitios con sotobosques densos. Las relaciones alométricas son una alternativa viable para estimar en forma eficiente la altura en función del diámetro normal. El objetivo de este estudio fue analizar modelos de crecimiento y alométricos para determinar el de mejor ajuste en la relación altura-diámetro para árboles de Pinus montezumae y Pinus teocote de la región forestal Nanacamilpa, Tlaxcala. Para el análisis, se obtuvieron 583 pares de datos de diámetro normal-altura total para P. montezumae y 468 pares para P. teocote. La muestra abarcó un amplio intervalo de categorías diamétricas. Se evaluaron 14 modelos no lineales y uno lineal, mediante análisis de regresión con el procedimiento MODEL de SAS® para los no lineales, y REG para el lineal. La bondad de ajuste se evaluó con base en la R 2 adj , el sesgo, la raíz del error cuadrático medio, la suma de cuadrado del error, el cuadrado medio del error y el criterio de información de Akaike. El mejor modelo para estimar la altura de Pinus montezumae fue el propuesto por Yang (M2) con una R 2 adj =0.91, y para P. teocote el cuadrático (M10) con una R 2 adj =0.87. Ambos modelos describen con precisión la relación alométrica entre el diámetro y la altura en árboles de las especies estudiadas en la región occidental del estado de Tlaxcala.
Palabras clave: Centro de México; manejo forestal; modelos de crecimiento; pinos; regresión no lineal; relaciones alométricas
Introduction
Forest management for timber production requires accurate measurements of the attributes or variables of the trees in order to obtain reliable estimates that may facilitate adequate decision making. Among the main variables measured in forest inventories are the total height and the normal diameter (at 1.3 m) of the individual trees, both of which are basic for estimating the volumes of timber or biomass (Xionweng and Brockway, 2017); they are also essential for studies on the growth and yield of individual trees, and therefore their usefulness is acknowledged in the execution of the technical management (Peng et al., 2001; Osman et al., 2013).
However, the in-field measurement of the total height of the standing trees, unlike that of the normal diameter, entails practical difficulties that increase the duration and cost of inventory (Trincado and Leal, 2006; Sharma, 2009). Furthermore, its measurement is liable to error, particularly in forests with dense undergrowth or where trees of different ages, species, sizes, vigors, or crown types coexist (Temesgen et al., 2014; Arnoni et al. 2016).
An alternative that overcomes the referred limitations consists in estimating the total height as a function of the normal diameter, which can be measured more easily and with greater accuracy, using mathematical models that relate the two variables (Trincado and Leal, 2006). For this purpose, linear and non-linear, mostly asymptotic models have been developed which allow a precise calculation of the total height of a tree based on terms of its normal diameter (Rijal et al., 2012; Arnoni et al., 2016; Duan et al., 2018). According to Clutter et al. (1983), Ahmadi et al. (2013) and Mehtätalo et al. (2015), it is much better to estimate tree height with non-linear models than with linear ones.
Furthermore, it is advisable to determine the models separately for each species of interest (Misir, 2010; VanderSchaaf, 2014; Sharma and Breidenbach, 2015) and for each region (Crecente-Campo et al., 2010; Coble and Young-Jin, 2011). Certain studies point out that these relationships are particular and dependent on the conditions of the site conditions; therefore, it is customary to obtain local models (Corral-Rivas et al., 2014) with restricted application, or to incorporate into the models certain characteristics of the site or attributes of the stand (i.e. the density, the dominant height, and the structure, among others) that also influence the height-diameter relation (Gonzalez-Benecke et al., 2013; Ahmadi and Alavi, 2016), which makes it possible to obtain generalized models (Corral-Rivas et al., 2014; Hernández et al., 2015) with a broader sphere of application.
Today, there are various models to adequately describe the behavior of the total height in terms of the normal diameter that have been widely used in other countries (Arnoni et al., 2016; Ahmadi and Alavi, 2016). For example, models like those of Chapman-Richards, Weibull, Schnute, the modified logistic model, and the exponential function have a broad application due to their predictive capacities (Peng et al., 2001; Temesgen et al., 2014; Ahmadi and Alavi, 2016).
However, despite their relevance, studies estimating the total height in terms of the normal diameter are scarce in Mexico. For example, Valdez-Lazalde and Lynch (2000) adjusted this relation using non-linear models for Pinus patula Schiede ex Schltdl. et Cham. in the state of Puebla; Hernández et al. (2015) compared 13 generalized models for analyzing the height-diameter relationship for Pinus teocote Schtldl. et Cham., while Corral-Rivas et al. (2014) tested 27 models and determined that the Bertalanffy-Richards growth model was the one that exhibited the best fits for six of the 13 groups of conifer and broadleaf species.
Pinus montezumae Lamb. and P. teocote are species of commercial timber importance and they are widely distributed across the country. At certain sites, the former pine species attains a height of up to 35 m and a diameter of up to 1.0 m, while P. teocote is a medium-sized tree with a rounded, irregular crown, which attains a height of 10 to 20 m, although the maximum values registered are 75 cm for diameter, and up to 25 m for height (Perry, 1991; Martínez, 1992). The two taxa are commercially exploited in several regions of Mexico, as in the case of the Calpulalpan-Nanacamilpa region, in the state of Tlaxcala, which has a management history of over three decades (Guerra et al., 2008). Due to their wide geographical distribution in the national territory, important variations in their allometry may be expected; however, in the studied region there are no models that describe their relation of total height to normal diameter (h/d).
For this reason, the objective of the present study was to analyze 15 statistical models and to propose the model with the best fit quality in order to estimate the total height as a function of the normal diameter for Pinus montezumae and P. teocote trees in the forest region of Nanacamilpa, in Tlaxcala, Mexico.
Materials and Methods
Study area
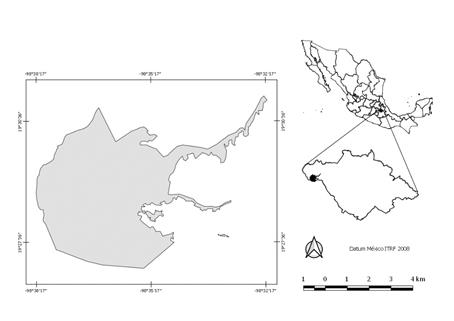
The study region is located in western Tlaxcala, Mexico. To the north, it borders with the region of Calpulalpan, and to the south, with the state of Puebla; the entire region of Nanacamilpa is included in the physiographic region of the Transverse Neovolcanic Belt, between the geographical coordinates 19°27'30" and 19°30'38" N, and 98°38'17" and 98°32'17” W (Figure 1). It is located at an altitude range of 2 600 to 3 300 m, and its climate is of the C(w2) type, i.e. temperate subhumid, with summer rains, and a mean annual temperature of 12 °C to 18 °C (Inegi, 2009).
The most representative vegetation types correspond to the conifer and broadleaf forests, whose most prominent species are Pinus montezumae, P. teocote, P. pseudostrobus Lindl., Abies religiosa (Kunth) Schltdl. & Cham. and Quercus laurina Bonpl., which grow on humic and eutric cambisols, as well as on humic andosols with a clayey and clayey loamy texture (Inegi, 2009). Initially, the forest management was developed under the regular system that includes regeneration fellings and thinnings during the entire rotation period (Guerra et al., 2008).
Field data collection
The field information was collected by establishing sampling sites for inventory whose shape and distribution was based on the design used by the National Forest and Soils Inventory, which considers a cluster as a primary unit, made up of four 400 m2 plots as secondary sampling units (Conafor, 2012). 16 systematically distributed clusters were established in the study area; in these, the dasometric variables of interest of all the living, whole and healthy trees with a normal diameter (at 1.3 m above the ground) of 7.5 or more cm were measured. Furthermore, 186 P. teocote trees with diameters above 30 cm ―which were scarce in the sampling plots― were included.
The normal diameter was measured with a Richter® 5 m tree diameter tape, while the total height was calculated using a Haglöf Vertex III digital hypsometer with a T3 ultrasonic transmitter. Although all the tree species in each secondary sampling unit were considered, only the data for P. montezumae and P. teocote were included in the study because they were the best represented taxa in the area, having an average density of 231 and 112 trees ha-1, respectively. A database for the regression analysis was built with this information, which included 583 pairs of data of normal diameter and total height for P. montezumae and 468 pairs for P. teocote. Table 1 shows the descriptive statistics.
Table 1 Basic statistics of the analyzed variables of the two studied species.
| Statistic | Pinus montezumae | Pinus teocote | ||
|---|---|---|---|---|
| d (cm) | h (m) | d (cm) | h (m) | |
| Minimum | 7.5 | 2.5 | 7.5 | 4.9 |
| Maximum | 80.9 | 42 | 80.9 | 32.1 |
| Average | 26.7 | 17.73 | 24.9 | 15.7 |
| Standard deviation | 19.962 | 10.502 | 17.102 | 6.341 |
| Coefficient of variation | 0.75 | 0.59 | 0.69 | 0.40 |
| Curtosis | -0.88 | -1.32 | 0.13 | -0.52 |
| Assymetry | 0.76 | 0.50 | 1.09 | 0.75 |
d = Normal diameter (1.30 m); h = Total height
Statistical analysis
The height-diameter data for P. montezumae and P. teocote were adjusted with linear and non-linear regression analyses; 14 non-linear models widely used in the specialized literature on forest biometry were tested (Table 2). Because the databases only included trees with a normal diameter of ≥7.5 cm ―and therefore no diameters near or equal to zero were measured―, the constant of 1.3 was not explicitly integrated in any of the models; this constant conditions the estimated height to be 1.3 m when the normal diameter is equal to zero. Furthermore, in practical terms, only rarely is there a need to estimate heights of near-zero diameters, and therefore, their interest is merely theoretical (Trincado and Leal, 2006).
Table 2 Models used for determining the total height based on the normal diameter of Pinus montezumae Lamb. and Pinus teocote Schiede ex Schltdl.
| Identifier | Model | Reference |
|---|---|---|
| (M1) |
|
Clutter et al. (1983) |
| (M2) |
|
Temesgen et al. (2014) |
| (M3) |
|
Temesgen et al. (2014) |
| (M4) |
|
Castillo-Gallegos et al. (2018) |
| (M5) |
|
Castillo-Gallegos et al. (2018) |
| (M6) |
|
Castillo-Gallegos et al. (2018) |
| (M7) |
|
Sharma (2009) |
| (M8) |
|
Castillo-Gallegos et al. (2018) |
| (M9) |
|
García et al. (2017) |
| (M10) |
|
García et al. (2017) |
| (M11) |
|
García et al. (2017) |
| (M12) |
|
García et al. (2017) |
| (M13) |
|
Castillo-Gallegos et al. (2018) |
| (M14) |
|
Castillo-Gallegos et al. (2018) |
| (M15) |
|
Castillo-Gallegos et al. (2018) |
h = Total height; d = Normal diameter; 𝛽 𝑖 = Parameters of the model.
Most of the studies on the h-d relation consider non-linear models because they best describe the growth; however, in this case, a model with a linear structure in the parameters (M10) was considered, since it has sometimes proven to attain good results in the adjustment of this type of relation (García et al., 2017).
The regression analysis was performed with the SAS® software, version 9.3 (SAS, 2011). The MODEL procedure with ordinary least squares was used for non-linear models, while the REG procedure of the same statistical analysis software was utilized for the linear model. The goodness-of-fit of each model was assessed with the coefficient of determination corrected by the number of parameters (adjR2) as an indicator of the proportion of the variance accounted for by the independent variable, the bias, the root of the mean squared error (RMSE), the sum of the squared error (SSE), the mean squared error (MSE), the significance of the estimators, and the Akaike information criterion (AIC). The latter parameter is a very reliable criterion, as it compares between models with different numbers of parameters (Sharma, 2009).
In order to attain greater objectivity in the selection of the best model for each species, the goodness-of-fit criteria indicated were hierarchized according to the procedure described by Tamarit-Urias et al. (2014), in order to generate a quality index whose total value facilitated the identification of the model with the best fit in each case. Although the statistical adjustment criteria constituted the main basis for the selection of the best model, its biological consistency was also analyzed, since it is a desirable characteristic in any growth model (Sharma, 2009). Certain authors have pointed out the importance of considering the predictive capacity of the models ―particularly for the height of larger trees (Moore et al., 1996; Zhao et al., 2006)―, which entails the search for a reasonable behavior of the fitted curve through the entire data range, paying special attention to the upper limit.
Due to this, the asymptotic behavior of the curve of each species was judged in terms of the maximum values for growth in height cited in the literature and in the observed data. Thus, the graphic description of the model within and outside the range of the observed data was an additional criterion for the selection. Furthermore, the fulfillment of the basic assumptions of the regression (i.e. normality in the distribution of the errors) was verified with Shapiro-Wilk’s test, along with the graphic analysis of the residuals for observing the tendencies before making inferences about the estimators of the parameters in each model (Kutner et al., 2005).
Results and Discussion
Pinus montezumae
Table 3 shows the adjustment of the analyzed models. In general, all the tested models for P. montezumae, regardless of their form and the number of their parameters, were observed to exhibit good fits, as the variance (adjR2) accounted for by the independent variable was above 89 % in all cases.
Table 3. Goodness-of-fit statistics of the models analyzed for Pinus montezumae Lamb.
| Model | SSE | MSE | RMSE | adjR2 | Bias | AIC | Total score |
|---|---|---|---|---|---|---|---|
| M1 | 5 557.8 | 9.58 | 3.10 | 0.91 | 0.03 | 1 320.53 | (29) |
| M2 | 5 538.2 | 9.55 | 3.09 | 0.91 | 0.05 | 1 318.48 | (28) |
| M3 | 5 582.9 | 9.63 | 3.10 | 0.91 | 0.01 | 1 323.16 | (31) |
| M4 | 5 772.1 | 9.95 | 3.16 | 0.91 | 0.02 | 1 342.59 | (58) |
| M5 | 5 621.4 | 9.69 | 3.11 | 0.91 | 0.04 | 1 327.16 | (40) |
| M6 | 5 747.6 | 9.89 | 3.15 | 0.91 | -0.06 | 1 338.11 | (47) |
| M7 | 5 487.9 | 9.46 | 3.08 | 0.91 | 0.04 | 1 313.16 | (21) |
| M8 | 5 621.4 | 9.69 | 3.11 | 0.91 | 0.04 | 1 327.16 | (47) |
| M9 | 5 936.8 | 10.24 | 3.20 | 0.91 | 0.0004 | 1 358.99 | (64) |
| M10 | 5 477.7 | 9.44 | 3.07 | 0.91 | 0.001 | 1 312.07 | (10) |
| M11 | 6 803.6 | 11.71 | 3.42 | 0.89 | 0.20 | 1 436.44 | (90) |
| M12 | 6 357.6 | 10.94 | 3.31 | 0.90 | -0.09 | 1 396.91 | (66) |
| M13 | 6 634.2 | 11.42 | 3.38 | 0.90 | 0.19 | 1 421.74 | (84) |
| M14 | 5 858.9 | 10.08 | 3.18 | 0.91 | -0.002 | 1 349.29 | (58) |
| M15 | 5 656.3 | 9.75 | 3.12 | 0.91 | 0.02 | 1 330.77 | (47) |
adjR2 = Adjusted coefficient of determination; RMSE = Root of the mean squared error; SSE = Sum of squared error; MSE = Mean squared error; AIC = Akaike information criterion.
The fit quality index, given by the total score of each model, evidence that the five best models are M10, M7, M2, M1 and M3 (all of them with three parameters), because they exhibited the best ―i.e. the lowest― values for all the goodness of fit criteria. Notably, the models with two parameters (M6, M11 and M14) exhibited poor values in the errors (SSE, MSE and RMSE), and therefore their total scores were generally less adequate than those of the models with three parameters. Besides, three of them failed to fulfill the assumption of normality in the residuals and therefore they were discarded in the selection.
Although the assessment with the index suggests which models had the best statistical behavior, the estimators of all the models were observed to be significant, except for the model with the best score (M10), which exhibited a non-significant parameter (b0) (Table 4) and was therefore discarded.
Table 4 Values and significance of the estimators of the models analyzed for Pinus montezumae Lamb.
| Model | b 0 | Pr > |t| | b 1 | Pr > |t| | b 2 | Pr > |t| |
|---|---|---|---|---|---|---|
| M1 | 40.145 | <.0001 | 0.031 | <0.0001 | 0.144 | 0.0039 |
| M2 | 38.681 | <.0001 | -0.018 | <0.0001 | 1.135 | <0.0001 |
| M3 | 4.049 | <.0001 | -38.875 | <0.0001 | 10.547 | <0.0001 |
| M4 | 113.019 | <.0001 | 6.653 | <0.0001 | 0.412 | <0.0001 |
| M5 | 1.219 | <.0001 | 1.623 | <0.0001 | 0.019 | <0.0001 |
| M6 | 72.625 | <.0001 | 71.206 | <0.0001 | ||
| M7 | 0.826 | <.0001 | 1.037 | <0.0001 | -0.002 | <0.0001 |
| M8 | 51.746 | <.0001 | 0.012 | <0.0001 | 1.219 | <0.0001 |
| M9 | -15.519 | 0.0009 | 9.941 | 0.0012 | 0.388 | <0.0001 |
| M10 | 0.188 | 0.6196 | 0.909 | <0.0001 | -0.006 | <0.0001 |
| M11 | 42.222 | <.0001 | -16.945 | <0.0001 | ||
| M12 | 0.583 | <.0001 | 0.716 | <0.0001 | ||
| M13 | 42.893 | <.0001 | 17.863 | <0.0001 | ||
| M14 | 1.276 | <.0001 | 2.313 | <0.0001 | ||
| M15 | 38.664 | <.0001 | -0.018 | <0.0001 | 1.135 | <0.0001 |
b0 , b 1 and b 2 = Regression coefficients; Pr>[t] = Likelihood of t
The four next best models fulfilled the assumption of normality of residuals (H0 is not rejected, p<0.05) (Figure 2). When studying the h-d relation for 25 species in northern Mexico, Corral-Rivas et al. (2014) stated that the local Bertalanffy-Richards model is the most consistent, as it exhibits values of R2 of 0.6 to 0.8 in seven pine species. The results of this work coincide with the referred study, as the model (M1), together with Yang’s model (M2) ―which has a similar structure― exhibited very similar results, with adjR2 values of 0.81. Furthermore, Castillo-Gallegos et al. (2018) determined that Richards’ local model was the best for modeling the h-d relation for P. chiapensis (Martínez) Andresen in Veracruz, Mexico, although it had much lower R2 values. Based on this, and having analyzed its graphic behavior, our final criterion for deciding which is the best model for P. montezumae was biological consistency.
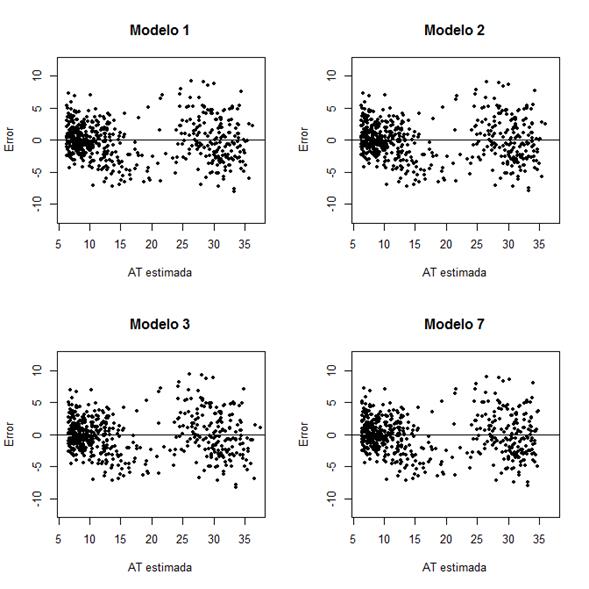
Figure 2 Distribution of residuals of the four best height-diameter models adjusted for Pinus montezumae Lamb.
In the observed data range, the four best models exhibited a very similar behavior, up to a diameter of approximately 60 m, after which the height projections differ (Figure 3), particularly with M3, which predicts higher values for height, without showing an asymptotic tendency even outside the data range. Conversely, Sharma’s model (M7) indicates lower values and a maximum height of 35 m for diameters slightly above 80 cm, after which it predicts lower heights, which may not be altogether acceptable for P. montezumae.
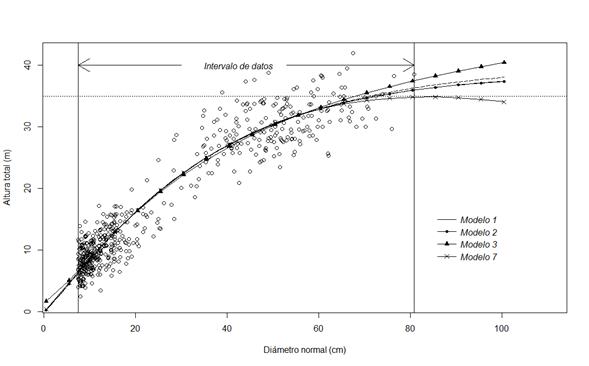
Figure 3 Trajectories of the curves generated with the best height-diameter models and data observed for Pinus montezumae Lamb.
In this regard, Zhao et al. (2006) consider that two of the desirable attributes of the height-diameter equations are that they should attain an asymptote in larger diameters and that they should always exhibit a positive slope; neither attribute was observed with M7. On the other hand, the models of Richards (M1) and Yang (M2) have a similar behavior, even at the upper limit of the data range, and they exhibit an asymptotic tendency at a height of approximately 38 m, in diameters close to 100 cm. This is reasonable, from a biological point of view, for P. montezumae trees, particularly in regions with a good site quality (Rodríguez et al., 1988). However, since Yang’s model (M2) is more conservative and has better adjustment values than that of Richards (M1), it is considered more adequate for estimating the total height in P. montezumae trees in the study region and is expressed by the following formula:
Where:
h = Total height
d = Normal diameter
Pinus teocote
In general, the adjustment values of the models tested for the species were also adequate, given that they are local models (Table 5). Hernández et al. (2015) estimated heights for P. teocote in the state of Hidalgo, using generalized equations, and they obtained adjR2 values of 0.93. According to the hierarchization of the criteria followed in this study, the quadratic model (M10) has the best fit to the data, since it has the lowest value for the index; this model’s adjustment coefficient of determination (adjR2) is 0.87, which is above the value registered by Corral-Rivas et al. (2014) for the same species (R2<0.7) in northern Mexico.
Table 5 Goodness-of-fit statistics of the models analyzed for Pinus teocote Schiede ex Schltdl.
| Model | SSE | MSE | RMSE | adj R 2 | Bias | AIC | Total score |
|---|---|---|---|---|---|---|---|
| M1 | 2 569.5 | 5.53 | 2.35 | 0.86 | 0.01 | 803.00 | (37) |
| M2 | 2 570.9 | 5.53 | 2.35 | 0.86 | 0.02 | 803.27 | (51) |
| M3 | 2 518.0 | 5.42 | 2.33 | 0.87 | 0.002 | 793.53 | (12) |
| M4 | 2 841.5 | 6.11 | 2.47 | 0.85 | 0.57 | 850.10 | (80) |
| M5 | 2 570.9 | 5.53 | 2.35 | 0.86 | 0.01 | 803.26 | (48) |
| M6 | 2 793.7 | 6.00 | 2.45 | 0.85 | 0.09 | 840.15 | (72) |
| M7 | 2 568.4 | 5.52 | 2.35 | 0.86 | 0.01 | 802.80 | (28) |
| M8 | 2 570.9 | 5.53 | 2.35 | 0.86 | 0.01 | 803.26 | (55) |
| M9 | 2 568.5 | 5.52 | 2.35 | 0.86 | -0.001 | 802.82 | (25) |
| M10 | 2 505.0 | 5.39 | 2.32 | 0.87 | 0.004 | 791.10 | (9) |
| M11 | 3 835.9 | 8.23 | 2.87 | 0.80 | 0.11 | 988.53 | (89) |
| M12 | 2 571.1 | 5.52 | 2.35 | 0.86 | 0.003 | 801.29 | (25) |
| M13 | 3 726.6 | 8.00 | 2.83 | 0.80 | 0.11 | 975.00 | (83) |
| M14 | 2 733.2 | 5.87 | 2.42 | 0.85 | 0.04 | 829.91 | (66) |
| M15 | 2 569.7 | 5.53 | 2.35 | 0.86 | 0.01 | 803.04 | (40) |
adj R 2 = Adjusted coefficient of determination; RMSE = Root of the mean squared error; SSE = Sum of the squared error; MSE = Mean squared error; AIC = Akaike information criterion.
According to the rating system, the best models after M10 turned out to be M3, M12, M9 and M7; however, in regard to the hypothesis tests on the estimators, neither the value of b 0 with M9 nor that of b 2 with M7 were significant (P<0.05) (Table 6); therefore, they were not considered for further analysis. In any case, M3 and M12 occupied the second and third place, respectively (Table 5), with the advantage that all their coefficients were significant (p<0.05), and in both cases the assumption of normality of residuals was fulfilled, according to the dispersion graphs (Figure 4) and the SW statistic (>0.97).
Table 6 Values and significance of the estimators of the analyzed models for Pinus teocote Schiede ex Schltdl.
| Model | b0 | Pr > t | b 1 | Pr > t | b2 | Pr > t |
|---|---|---|---|---|---|---|
| M1 | 85.542 | 0.2886 | 0.002 | 0.6007 | -0.743 | <0.0001 |
| M2 | 392.281 | 0.8367 | -0.007 | 0.8331 | 0.567 | <0.0001 |
| M3 | 4.028 | <0.0001 | -63.758 | <.0001 | 27.165 | <0.0001 |
| M4 | 928.458 | 0.6718 | 6.180 | 0.0031 | 0.132 | 0.0889 |
| M5 | 0.564 | <0.0001 | 0.363 | <.0001 | 0.001 | 0.8711 |
| M6 | 41.496 | <0.0001 | 34.639 | <.0001 | ||
| M7 | 2.651 | <0.0001 | 0.576 | <.0001 | -0.0002 | 0.4754 |
| M8 | 878.678 | 0.8638 | 0.003 | 0.8613 | 0.565 | <0.0001 |
| M9 | 1.197 | 0.5005 | 2.252 | 0.0033 | 0.596 | <0.0001 |
| M10 | 5.085 | <0.0001 | 0.527 | <.0001 | -0.003 | <0.0001 |
| M11 | 30.357 | <0.0001 | -12.421 | <.0001 | ||
| M12 | 1.030 | <0.0001 | 0.553 | <.0001 | ||
| M13 | 30.800 | <0.0001 | 13.130 | <.0001 | ||
| M14 | 2.184 | <0.0001 | 1.768 | <.0001 | ||
| M15 | 0.0002 | 0.6991 | 0.177 | 0.0017 | 0.572 | <0.0001 |
b 0 , b 1 and b 2 = Regression coefficients; Pr>[t] = Likelihood of t.
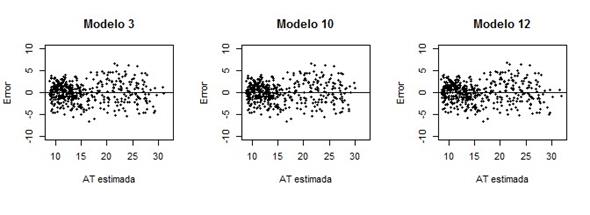
Figure 4 Distribution of residuals of the three best height-diameter models adjusted for Pinus teocote Schiede ex Schltdl.
Graphically, models M3, M10 and M12 described similar trajectories until attaining a diameter of approximately 65 cm (Figure 5), after which only model M10 exhibited a descent in the value of the slope of the curve, while M3 and M12 maintained their rising trajectory, even outside the data range. It is evident that, with these two models, there is a tendency to overestimate the total height (>32 m) for trees with diameters close to 80 cm, and therefore they are not considered adequate for modeling this relation. The tendency shown by the curve generated by model M10 seems to be more reasonable and logical for P. teocote, whose maximum diameters and heights can hardly exceed 85 cm and 32 m, respectively. For example, Hernández et al. (2015) document maximum values of 72 cm for diameter and 31 m for height in the same species.
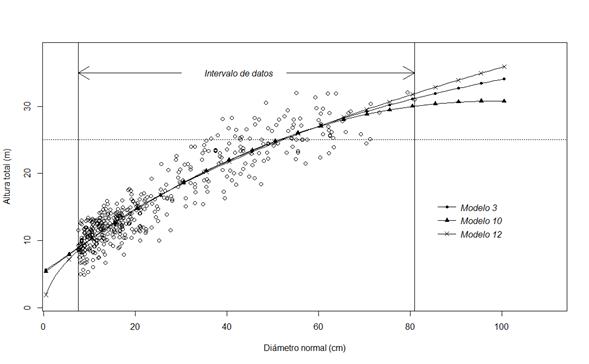
Figure 5 Trajectories of the curves generated with the best height-diameter models and data observed for Pinus teocote Schiede ex Schltdl.
Therefore, the final equation (Model 10) for estimating the total height of P. teocote trees based on the normal diameter in the study region is expressed as follows:
Where:
h = Total height
d = Normal diameter
The local height-diameter models selected for Pinus montezumae and P. teocote are specific to the typical conditions of the forests of the western region of the state of Tlaxcala. Due to their appropriate statistical adjustment values and their biological consistency, they can be applied in the forest management of this area. Furthermore, they will be useful in future research ―e.g. for generating growth and timber yield systems of the two studied Pinus species―, but always restricted to the same geographical area.
Conclusions
In general, the models tested for the two species have good fits, as they account for more than 80 % of the variance of the total height in both cases. The best models for estimating the total height in relation to the normal diameter for individual trees are Yang’s model (M2) for Pinus montezumae, and the quadratic model (M10) for P. teocote, due to their better quality of adjustment and to the biological consistency shown in the graphic description of the height-diameter relationship. These local models will allow estimations of the total height of the trees with accuracy levels above 87 % in P. montezumae and P. teocote forests under management in the region of Nanacamilpa, in the state of Tlaxcala.
Acknowledgements
The present study was financed by the National Institute for Research on Forestry, Agriculture and Livestock of Mexico (Instituto Nacional de Investigaciones Forestales, Agrícolas y Pecuarias, INIFAP). The authors are grateful to ejido San José Nanamilpa, in Tlaxcala, for the facilities provided for the development of the field work.
REFERENCES
Ahmadi, K. and Alavi S. J. 2016. Generalized height-diameter models for Fagus orientalis Lipsky in Hyrcanian forest, Iran. Journal of Forest Science 62(9): 413-421. [ Links ]
Ahmadi, K., S. J. Alavi, M. T. Kouchaksaraei and W. Aertsen 2013. Non-linear height-diameter models for oriental beech (Fagus orientalis Lipsky) in the Hyrcanian forests, Iran. Biotechnology, Agronomy, Society and Environment 17(3): 431-440. [ Links ]
Arnoni, C. E., T. Schroder and C. A. Guimarães. 2016. Height-diameter relationships for Araucaria angustifolia (Bertol.) Kuntze in Southern Brazil. CERNE 22(4): 493-500. [ Links ]
Castillo-Gallegos, E., J. Jarillo-Rodríguez y R. Escobar- Hernández. 2018. Relación altura-diámetro en tres especies cultivadas en una plantación forestal comercial en el este tropical de México. Revista Chapingo Serie Ciencias Forestales y del Ambiente 24(1): 33-48. [ Links ]
Clutter, J. L., J. C. Fortson, L. V. Pienaar, G. H. Brister and R. L. Bailey. 1983. Timber Management: A quantitative approach. John Wiley & Sons. New York, NY USA. 333 p. [ Links ]
Crecente-Campo F., M. Tomé, P. Soares and U. Diéguez-Aranda. 2010. A generalized nonlinear mixed-effects height-diameter model for Eucalyptus globulus L. in northwestern Spain. Forest Ecology and Management 259: 943-952. [ Links ]
Coble, D. W. and L. Young-Jin. 2011. A mixed-effects height-diameter model for individual loblolly and slash pine trees in east Texas. Southern Journal of Applied Forestry 35(1): 12-17. [ Links ]
Comisión Nacional Forestal (Conafor). 2012. Inventario Nacional Forestal y de Suelos. Informe 2004-2009. Coordinación General de Planeación e Información. Gerencia de Inventario Forestal y Geomática. Zapopan, Jal., México. 212 p. [ Links ]
Corral-Rivas, S., J. G. Álvarez-González, F. Crecente-Campo and J. J. Corral-Rivas. 2014. Local and generalized height-diameter models with random parameters for mixed, uneven-aged forests in Northwestern Durango, Mexico. Forest Ecosystems 1(6): 1-9. DOI:10.1186/2197-5620-1-6. [ Links ]
Duan, G., Z. Gao, Q. Wang and L. Fu. 2018. Comparison of different height-diameter modelling techniques for prediction of site productivity in natural uneven-aged pure stands. Forests 9(2):63-81. DOI:https://doi.org/10.3390/f9020063. [ Links ]
García C., X., J. Hernández R., A. Hernández R., J. Quiñonez B., J. C. Tamarit U. y G. G. García E. 2017. Predicción del diámetro normal, altura y volumen a partir del diámetro del tocón en especies tropicales. Revista Mexicana de Ciencias Forestales 8(43): 90-116. DOI:https://doi.org/10.29298/rmcf.v8i43.67. [ Links ]
Gonzalez-Benecke, C. A., S. A. Gezan, T. A. Martin, W. P. Crooper, L. J. Samuelson, and D. J. Leduc. 2014. Individual tree diameter, height and volumen functions for longleaf pine. Forest Science 60(1):43-56. [ Links ]
Guerra de la C., V., F. Carrillo. A. y M. Acosta M. 2008. El aprovechamiento de los recursos forestales maderables. In: Guerra de la C., V. y C. Mallén R. (comp.) Tlaxcala, sus recursos forestales: Conservación, aprovechamiento y bases para su manejo sustentable. Libro Técnico Núm. 4. INIFAP-Cenid-Comef. México, D.F., México. pp. 30-43. [ Links ]
Hernández R., J., X. García C., A. Hernández R., J. J. García M., H. J. Muñoz F., C. Flores L. y G. G. García-Espinoza. 2015. Ecuaciones altura-diámetro generalizadas para Pinus teocote Schlecht. & Cham. en el estado Hidalgo. Revista Mexicana de Ciencias Forestales 6(31): 8-21. DOI:https://doi.org/10.29298/rmcf.v6i31.192. [ Links ]
Instituto Nacional de Estadística Geografía e Informática (Inegi). 2009. Prontuario de información geográfica municipal de los Estados Unidos Mexicanos Nanacamilpa de Mariano Arista, Tlaxcala. Clave geoestadística 29021. http://mapserver.inegi.org.mx/mgn2k/ (7 de agosto de 2018). [ Links ]
Kutner, M. H., C. J. Nachtsheim, J. Neter and W. Li. 2005. Applied linear statistical models. 5th edition. Ed. McGraw-Hill-Irwing. New York, NY USA. 1396 p. [ Links ]
Martínez, M. 1992. Los pinos mexicanos. 3ª edición. Ediciones Botas. México, D. F., México. 361 p. [ Links ]
Mehtätalo, L., S. de Miguel and T. G. Gregoire 2015. Modeling height-diameter curves for prediction. Canadian Journal of Forest Research 45: 826-837. [ Links ]
Misir, N. 2010. Generalized height-diameter models for Populus tremula L. stands. African Journal of Biotechnology 9(28): 4348-4355. [ Links ]
Moore, J. A., L. Zhang and D. Stuck. 1996. Height-Diameter equations for ten tree species in the Inland Northwest. Western Journal of Applied Forestry 11(4):132-137. [ Links ]
Osman, E. M. H., E. Z. A. Idris and E. M. M. Ibrahim. 2013. Modelling height-diameter relationships of selected economically important natural forest species. Journal of Forest Products and Industries 2(1): 34-42. [ Links ]
Peng, C., L. Zhang and J. Liu. 2001. Developing and validating nonlinear height-diameter models for major tree species of Ontario’s boreal forests. Northern Journal Applied Forestry 18 (3):87-94. [ Links ]
Perry, 1991. The pines of Mexico and Central America. Timber Press Portland, OR USA. 231 p. [ Links ]
Rijal, B., A. R. Weiskittel and J. A. Kershaw. 2012. Development of regional height to diameter equations for 15 tree species in the North American Acadian Region. Forestry 85(3): 379-390. [ Links ]
Rodríguez F., C., H. Ramírez M., G. Zarate de Lara, A. Fierros G. y C. A. Ortiz S. 1998. Determinación de calidad de estación de Pinus montezumae Lamb., a través de análisis troncales en el Campo Experimental Forestal San Juan Tetla, Puebla. Agrociencia 72: 87-94. [ Links ]
Statistical Analysis System (SAS). 2011. SAS® Versión 9.3. SAS Institute Inc. Cary, NC USA. n/p. [ Links ]
Sharma, R. P. 2009. Modelling height-diameter relationship for Chir pine trees. Banko Janakari 19(2): 3-9. [ Links ]
Sharma, R. P. and J. Breidenbach. 2015. Modeling height-diameter relationships for Norway spruce, scots pine, and downy birch using Norwegian national forest inventory data. Forest Science and Technology 11(1): 44-53. [ Links ]
Tamarit U., J. C., H. M. De los Santos P., A. Aldrete, J. R. Valdez L., H. Ramírez M. y V. Guerra De la C. 2014. Sistema de cubicación para árboles individuales de Tectona grandis L. f. mediante funciones compatibles de ahusamiento-volumen. Revista Mexicana de Ciencias Forestales 5 (21): 58-74. DOI: https://doi.org/10.29298/rmcf.v5i21.358. [ Links ]
Temesgen, H., C. H. Zhang and X. Zhao H. 2014. Modelling tree height-diameter relationships in multi-species and multi-layered forests: A large observational study from Northeast China. Forest Ecology and Management316: 78-89. [ Links ]
Trincado, G. y C. Leal D. 2006. Ecuaciones locales y generalizadas de altura diámetro para pino radiata (Pinus radiata). Bosque 27(1):23-34. DOI: 10.4067/S0717-92002006000100003 [ Links ]
Valdez-Lazalde, J. R. and T. B. Lynch. 2000. Merchantable and total volume equations for thinned natural stands of patula pine. Agrociencia 34(6):747-758. [ Links ]
VanderSchaaf, L. C. 2014. Mixed-effects height-diameter models for ten conifers in the inland Northwest, USA. Southern Forests 76(1): 1-9. [ Links ]
Xiongwen, C. and D. G. Brockway. 2017. Height-diameter relationships in longleaf pine and four swamp tree species. Journal of Plant Studies 6(2): 94-101. [ Links ]
Zhao, W., E. G. Mason and J. Brown. 2006. Modelling height-diameter relationships of Pinus radiata plantations in Canterbury, New Zealand. NZ Journal of Forestry 23-27. [ Links ]
Received: August 08, 2018; Accepted: October 15, 2018
 Este es un artículo publicado en acceso abierto bajo una licencia Creative Commons
