


Serviços Personalizados
Journal
Artigo
 texto em
  Inglês (pdf)
 Artigo em XML
 Referências do artigo
 Enviar este artigo por email
Indicadores
-
 Citado por SciELO
 -
 Acessos
Links relacionados
-
 Similares em
SciELO
Similares em
SciELO
Compartilhar

 Permalink
Revista mexicana de ciencias forestales
versão impressa ISSN 2007-1132
Rev. mex. de cienc. forestales vol.10 no.51 México 2019
https://doi.org/10.29298/rmcf.v10i51.187
Articles
Structural characteristics of a pine forest in Tlalnepantla, Morelos State
1Secretaría de Medio Ambiente. Gobierno de la Ciudad de México. México
2Centro Nacional de Investigación Disciplinaria en Conservación y Mejoramiento de Ecosistemas Forestales, INIFAP. México.
Temperate forests of pine and pine-oak are the main type of vegetation of Tlalnepantla municipality, located at the northeast of Morelos State. It is part of the buffer zone and recharge mantles of the central area of the state. In the La Correa locality a mensuration description was made of the forest population and a diagnosis of the sanitary state of the trees, as background information to design a local ecotourism project. Systematic sampling was applied through the establishment of 20 plots of 1/10 ha. The sanitary conditions of the crown, trunk and vigor were analyzed by an X2 test. Demographic analysis was done using static life tables and survival curves which were designed for each species. A morphometric analysis was performed from crown percentage, crown index, crown size, living space index and the degree of slenderness by natural age class for each taxon, as indicators of competition and site quality of the trees. Four species were identified: Pinus patula, P. ayacahuite, P. leiophylla and P. montezumae. Results indicate that the pine forest that was studied is a regular mixed mass, with an average density of 437 ha-1, mainly made-up by young individuals that develop in low competition places with healthy and vigorous conditions.
Key words: Pine forest; mensuration; Morelos State; reforestation; natural regeneration; forest health
El principal tipo de vegetación del municipio Tlalnepantla, localizado al noreste del estado de Morelos, corresponde al de bosques templados de pino y de pino-encino. Forma parte de la zona de amortiguamiento y de recarga de mantos del centro de la entidad. En la localidad La Correa se hizo una descripción dasonómica de la población forestal y un diagnóstico de la situación sanitaria del arbolado, como antecedente para diseñar un proyecto ecoturístico local. Se aplicó un muestreo sistemático mediante el establecimiento de 20 parcelas de 1/10 ha. Las condiciones sanitarias de la copa, el tronco y el vigor, se analizaron con una prueba de X 2 . El análisis demográfico se hizo mediante tablas de vida estática y se diseñaron curvas de supervivencia para cada especie. Se realizó un análisis morfométrico a partir del porcentaje de copa, el índice de copa, la dimensión de la copa, el índice de espacio vital y el grado de esbeltez por clase natural de edad por taxón, como indicadores de competencia y calidad de sitio del arbolado. Se identificaron cuatro especies: Pinus patula, P. ayacahuite, P. leiophylla y P. montezumae. Los resultados indican que el bosque de pino estudiado es una masa mixta regular, con una densidad promedio de 437 ejemplares ha-1, conformada, principalmente, por individuos jóvenes que se desarrollan en lugares propios de baja competencia, con buenos porcentajes sanitarios y vigorosos.
Palabras clave: Bosque de pinos; dasometría; Morelos; reforestación; regeneración natural; salud forestal
Introduction
Morelos State includes one of the richest biodiversity in México (Contreras et al., 2006). Currently, a fifth of its territory is subject to protection in one way or another (Aguilar, 1999). In the north, the Parque Nacional El Tepozteco (El Tepozeco National Park) and el Parque Nacional Lagunas de Zempoala (Zempoala Lagoons National Park) are found, and are linked by the Corredor Biológico Chichinautzin (Chichinautzin Biological Corridor), a flora and wildlife protection area (Conabio, 2013).
In these areas, temperate forests grow and are represented by pine, pine-oak and mountain mesophilic forest associations (Aguilar, 1999). These communities are integrated into the groundwater recharge zone for the center of the state, and constitute a buffer against pollution from Mexico City, Cuautla, Jojutla and Cuernavaca (Contreras et al., 2006). Due to their climatic and edaphic characteristics, they are subject to processes of land use change, overexploitation of bioenergy resources (firewood) and the establishment of irregular human settlements (Conabio, 2009).
The use of different dendrometric parameters to determine tree architecture, such as total height, crown depth, crown insertion height, normal diameter (1.30 m) basimetric diameter and crown coverage), offers the possibility of describing the conformation of individuals and stands, for forestry purposes (pruning, thinning and assessment of plantation quality) or research (growth and increase) (Arias, 2005).
In order to establish protection measures of the natural resources and mitigation of the abovementioned problems, local human populations have been involved in the organization of environmental management units (UMA, in spanish), hunting centers of some animal species, production of ornamental plants and of forest value, legal and controlled use as well as the obtaining of firewood and wood, and the execution of nature tourism projects (Contreras et al., 2006).
Since 2004, the residents of the Felipe Neri ejido, located in the northern part of the state of Morelos, have received economic support through payment for hydrological environmental services and have established some Pinus plantations. Starting in 2015, in collaboration with the federal, state and tourism secretaries of the Tlalnepantla municipal government, they allocated some of their lands to formulate an adventure tourism project, with the purpose of boosting the local economy, by providing sources of employment for the inhabitants (Semarnat, 2006; Semarnat, 2009; Bien, 2010). Therefore, a diagnose of the prevailing conditions in the place is necessary, so natural resources are used efficiently and the negative impacts on them are reduced in the best possible way (Venegas, 2006). However, there is no background study or previous diagnosis compare with the current forest conditions.
Thus, the objectives of this work consisted in characterizing pine populations of the forest belonging to the town of La Correa in Tlalnepantla, Morelos, from a dendrometric, physiognomic, morphometric and demographic point of view. The derived information will support the recommendations to the land holders and to the providers of professional services on the ecotourism project, and will give them the technical foundations that allow them to make informed decisions about the conservation and care strategies of their forests, particularly, regarding the effect growth of the local and induced populations have had on the land. With this, land-holders will have the possibility of identifying differences in terms of growth, degree of competition and survival of native and exotic species.
Materials and Methods
Study area
The study was carried out in the lands of common use of the Felipe Neri ejido (Cuatepec), located east of Tlalnepantla municipality in the state of Morelos, known as La Correa, between 19°03’08.99’’ N and 98°56’52’’ O and 19°03’08.86’’ N and 98°55’37.12’’ O, at an average altitude of 2 560 m (INAFED, 2010; HAMT, 2014), with an area of 42.6 ha.
The climate is C(w2)(w) temperate sub-humid, with rainfall in summer, average annual temperature between 5 and 12 °C, fresh and long summer (García, 1973; INAFED, 2010; Sedagro-Mor, 2012; HAMT, 2014). It does not have permanent hydrological systems, water tables, or rivers due to the characteristics of the highly permeable basaltic soils that make up the recharge zone of the central zone of the state (Boyás, 1992; Contreras et al., 2006; INAFED, 2010). The soils are Feozem, shallow and stony, rich in organic matter, medium texture, with good drainage (Ornelas et al., 1997).
It is one of the communities with greatest marginalization and poverty in the entity, whose main activity is related to the primary sector, mainly, agriculture (prickly pearl, vegetables and corn) and grazing livestock. The total population is around 1 338 inhabitants, distributed equally men and women (Inegi, 2010).
Determination of sampling units
Based on the land surface, a systematic sampling with an intensity of 5 % was designed. An aerial image of La Correa extracted from Google Earth and with the help of the Geographic Information System of free license QGis 2.18.6, the UTM coordinates (datum WGS84) were obtained from 20 sampling units, separated 150 m apart (Figure 1).
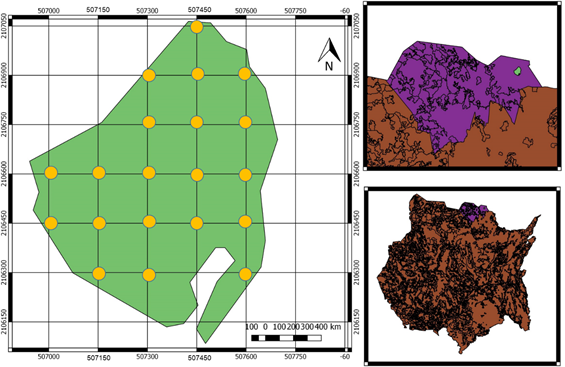
Source: Google Earth Pro, 2015.
Figure 1 Aerial image of the La Correa, Tlanepantla, Mor. and distribution of the 20 sampling units.
Dendrometric variables and physiognomic evaluation criteria
The dendrometric variables considered were: normal diameter (DN) measured at 1.30 m height from the ground; basal diameter (DB) at the height of the neck of the root; the total height of the tree (H t ); the height of insertion of the crown (H ic ) and the crown coverage in two dimensions (CoC 1 and CoC 2 ).
The physiognomic assessment of the trees, made with the methodology proposed by Benavides (2015), which considered the general condition of the trees (vigorous, incipient declining, moderately declining, advanced declining and severe declining) and the health status of the trunk and cup (good, regular, bad and very bad).
The sampling points were determined in the field by means of a GPS (Garmin ETrex 20x); in each sampling unit, a square of 33 × 33 m was delimited, starting from the central tree, close to the assigned coordinate (1 089 m2) (Aguirre et al., 1997; Velasco et al., 2013).
Each site was divided into four quadrants of 16.5 m per side, which were traversed in zigzag, to facilitate their travel and perform the measurement of the dendrometric variables and evaluation of the pines. In addition, each tree was marked with indelible black paint along the north side of the trunk to avoid repetition of data. Those individuals distributed over the edge of the quadrant, in which 50 % of the trunk diameter was within the sampling site (Boyás, 1992), were included.
The normal (DN) and basal (DB) diameter were measured with a Forestry Suppliers 283D model tape. The total height of the tree (H t ) and the height of insertion of the crown (H ic ) with a Haga type HS080model clinometer. For trees whose height was equal to or less than 3 m, the measurement was made with a flexometer (Ugalde, 1981; Domínguez et al., 2006). Crown coverage (CC) was calculated by measuring two dimensions with tape measure, the first (CoC 1 ) from the drip line of the longest branch to its opposite end, and the second, was the perpendicular of the first measurement (CoC 2 ) (Ugalde, 1981; FAO, 2004; Domínguez et al., 2006).
Branches and cones were collected for the taxonomic determination of the species of interest (Sánchez and González, 2007). The collected plant material was determined through the use of taxonomic keys, specialized literature (Martínez, 1948; Loock, 1950; Perry, 1991; Farjon and Styles, 1997) and review of herbalized specimens in the Herbario Nacional Forestal (National Forest Herbarium) (INIF) and in the Herbario Nacional (National Herbarium) (MEXU).
Dendrometric description: basimetric area and crown coverage
The basal area was determined from the normal diameter. However, when the individuals did not reach that height, this parameter was obtained by means of the basal diameter in meters (Ugalde, 1981), with the following formula:
Where:
AB = Basimetric area (m2).
DB = Basimetric diameter (m)
Crown coverage (CC) was determined from the average of the two sections recorded (CoC 1 and CoC 2 ) as the average diameter of the crown (PromC), to then calculate the radius and replace it in the formula:
Where:
CC = Crown coverage (m2).
PromC = Average crown diameter (m)
With both parameters the AB and the CC were estimated (without considering the crown overlap) average per hectare, with a rule of three to correct the surface of the sampling tables, whose surface was greater than 0.01 ha (Ugalde, 1981; FONAM, 2006).
Dendrometric analysis and physiognomic evaluation criteria
The sampled trees were grouped according to natural age classes (seedling, low sapling, tall sapling, small tree, medium tree and high tree) (Daniel et al., 1982). The frequencies of the trees grouped in this way, together with the frequencies obtained from the physiognomic evaluation were analyzed by the χ 2 test. In those cases in which the test showed significant differences, the standardized residue test (R) was applied (Zar, 2010).
Morphometric analysis of trees
Five morphometric criteria proposed by Burger (1939) were followed (Arias, 2005; Nájera and Hernández, 2008; Valdivia et al., 2015) (Table 1).
Table 1 Morphometric relationships of the tree.
| Morphometric relationship | Measuring variables |
|---|---|
| Crown percentage |
|
| Vital space index |
|
| Crown index |
|
| Crown size index |
|
| Slenderness index |
|
Source: Modified from Nájera and Hernández, 2008.
H c = Crown height; H t = Total tree height; PromC = Average crown diameter; DN = Normal diameter.
Crown height (H c ) was estimated from the difference between the total height of the tree (H t ) and the cup insertion height (H ic ) (FAO, 2004). An ANOVA test was used to compare the existence of significant differences between pine species with respect to their indexes calculated by natural age class; for the tests that turned out to be significant, Tukey's post hoc test was applied to verify the cases that were statistically different. When only the averages of the morphometric indexes between two species were compared, the t-Student test was used.
Demographic analysis
The static or vertical life table was used for each species, which is plotted from the population structure observed at a given time; this was accommodated by size classes from the normal diameter (Valverde et al., 2005). The seedlings, whose size was less than 1.30 m in height were assigned within a category based on their basal diameter, because this measure does not differ much from the diameter in other parts of the trunk.
Results
A total of 1 514 pine specimens were counted, 1 054 (69.60 %) of which correspond to Pinus ayacahuite Ehrenb. ex Schltdl., 260 to Pinus montezumae Lamb. (17.20 %); 137 to Pinus leiophylla Schiede ex Schltdl. & Cham. and 63 (4.2 %) to Pinus patula Schiede ex Schltdl. & Cham. P. ayacahuite and P. patula were introduced in the site, as part of the payment program for hydrological environmental services.
The estimated average density of the Pinus genus in La Correa was 437 individuals ha-1; P. ayacahuite had the highest average density, with 574 ha-1 individuals, in addition to having the widest distribution in the place; P. leiophylla was the least represented with 434 ha-1 individuals, and P. patula had a higher density than P. leiophylla; however, its distribution was lower in the area. The largest AB was P. montezumae (11.9 m2 ha-1) and P. patula, the lowest (0.6 m2 ha-1). P. montezumae showed the highest value of CC (15 921.0 m2 ha-1) and P. ayacahuite the lowest (7 694.1 m2 ha-1). P. leiophylla recorded the most prominent average height (23.1 m) and the smallest species (7 m) was P. ayacahuite (Table 2).
Table 2 Dendrometric conformation per species (± ds).
| Species | Average trees per ha | Average basimetric area per ha (m2) | Average crown coverage per ha (m2) | Average height (m) |
|---|---|---|---|---|
| Pinus ayacahuite | 574 ± 405 | 6.6 ± 2.6 | 7 694.1 ± 430.0 | 7.0 ± 2.7 |
| Pinus leiophylla | 343 ± 249 | 7.5 ± 2.8 | 10 256.7 ± 1 190.9 | 23.1 ± 7.1 |
| Pinus montezumae | 459 ± 377 | 11.9 ± 2.4 | 15 921.0 ± 100.0 | 23.0 ± 7.2 |
| Pinus patula | 371 ± 279 | 0.6 ± 0.5 | 8 874.3 ± 6 856.5 | 10.5 ± 3.4 |
| Total general | 437 ± 328 | 6.7 ± 2.1 | 10 686 ± 2 144.4 | 15.9 ± 5.1 |
The saplings make up 57.10 % of the trees. P. ayacahuite was the most abundant taxon since, according to the standardized residue test (R), more individuals were found than would be expected by chance in the seedling and low sapling categories, although fewer were found in the other categories; P. leiophylla had a smaller number of seedlings and low saplings, but were better represented in the other classes; P. montezumae was found to have a higher number of individuals than expected by chance in the high sapling, middle and tall trees, whereas P. patula is statistically lower in saplings but higher in tall tree category (Figure 2).
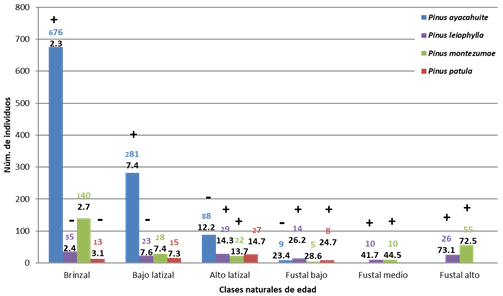
Núm. de individuos = Number of individuals; Clases naturales de edad = Natural classes of age. Brinzal = Seedling; Bajo latizal = Low sapling; Alto latizal = Tall sapling; Fustal bajo = Small tree; Fustal medio = Medium tree; Fustal alto = High tree.
Top number in color corresponding to the bar = Abundance (n), the lower one in black = Average normal diameter (cm). (R) = Results of the standardized residue test; (-) = Statistically less than expected by chance; (+) = Value statistically greater than expected at random. P <0.005; gl = 15
Figure 2 Distribution of the studied specimens by natural class of age and by species.
From the physiognomic evaluation of the trees, the vigorous and good categories for the health status of the trunk and the crown were the most frequent in all the natural age classes for the four species. However, according to the standardized residue test, only P. ayacahuite (p <0.001; gl = 20) recorded a greater number of individuals than would be expected at random for sanitary conditions of the regular and bad trunk of low saplings and very bad for small trees (Figure 3). Regarding the sanitary condition of the crown, the tall P. montezumae trees (p = 0.033; gl = 20) had a higher number than expected at random with a good condition and lower for the regular ones (Figure 4).

Núm. de individuos = Number of individuals; Clases naturales de edad = Natural classes of age; Condición sanitaria del tronco = Sanitary condition of the trunk; Bueno = Good; Regular = Regular; Malo = Bad; Pésimo = Very bad.
Brinzal = Seedling; Bajo latizal = Low sapling; Alto latizal = Tall sapling; Fustal bajo = Small tree; Fustal medio = Medium tree; Fustal alto = High tree.
Top number in color corresponding to that of the bar = Abundance (n). (R) = Results of the standardized residue test; (-) = Statistically less than expected by chance; (+) = Value statistically greater than expected at random.
Figure 3 Sanitary condition of the trunk by natural class of age and by species.
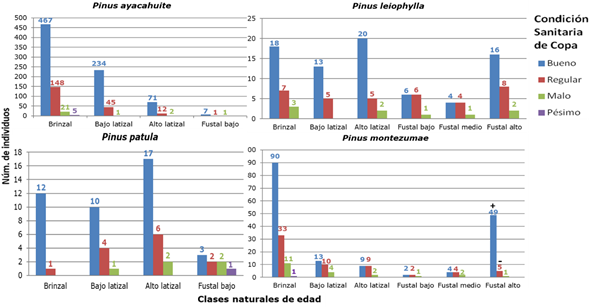
Núm. de individuos = Number of individuals; Clases naturales de edad = Natural classes of age; Condición sanitaria de la copa = Sanitary condition of the canopy; Bueno = Good; Regular = Regular; Malo = Bad; Pésimo = Very bad.
Brinzal = Seedling; Bajo latizal = Low sapling; Alto latizal = Tall sapling; Fustal bajo = Small tree; Fustal medio = Medium tree; Fustal alto = High tree.
Top number in color corresponding to that of the bar = abundance (n). (R) = Results of the standardized residue test; (-) = statistically less than expected by chance; (+) = value statistically greater than expected at random.
Figure 4 Sanitary condition of the canopy by natural class of age and by species.
In general, the condition of the dominant tree of the pinaceae is vigorous. According to the standardized residue test, P. ayacahuite (p <0.001; gl = 20) had a higher number of individuals than expected by chance of seedlings with incipient, moderate decline and dead trees; lower number vigorous saplings and small trees with advanced declination; and a smaller number of vigorous saplings; a smaller number of low saplings with incipient, moderate decline and dead specimens. P. montezumae (p = 0.001; gl = 20) showed a greater number of individuals with moderate decline for tall saplings; incipient decline of small trees and vigorous for tall trees (Figure 5).
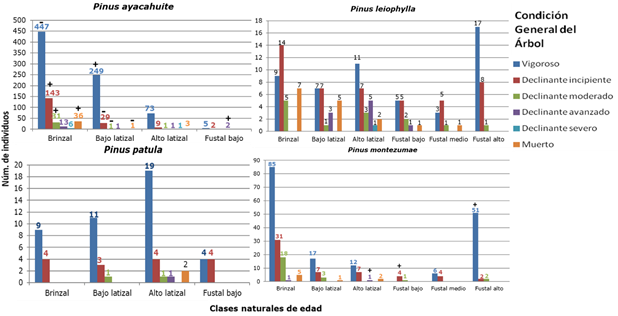
Núm. de individuos = Number of individuals; Clases naturales de edad = Natural classes of age; Condición general del árbol = General condition of the tree;
Vigoroso = Vigorous; Declinante incipiente = Incipient declining; Declinante moderado = Moderately declining; Declinante avanzado = Advanced declining; Declinante severo = Severe declining; Muerto = Dead.
Brinzal = Seedling; Bajo latizal = Low sapling; Alto latizal = Tall sapling; Fustal bajo = Small tree; Fustal medio = Medium tree; Fustal alto = High tree.
Top number in color corresponding to that of the bar = Abundance (n). (R) = Results of the standardized residue test; (-) = Statistically less than expected by chance; (+) = Value statistically greater than expected at random.
Figure 5 General condition of the tree by natural class of age and by species.
Morphometric analysis of trees
The ANOVA test applied to the different morphometric indexes, was significant for saplings in the crown size (MC) (P = 0.027, gl = 51, F = 3.34) and the slenderness index (IE) (P = 0.001; gl= 51; F = 6.84); in the first case, P. montezumae stood out with a significant difference with respect to P. patula (P = 0.026) in the Tukey test; while the second, recorded the highest IE (173.4), with a significant difference between P. leiophylla (P = 0.001) and P. montezumae (P = 0.002).
For low saplings, differences were significant for most indexes with the exception of the vital space index (IEV); P. patula registered significant differences regarding the rest of the species, the crown percentage (PC% = 73.1) and the slenderness index (IE = 105.7) were higher, whereas the crown size (MC = 0.5) was lower (P < 0.001 for each case and against each species); it exhibited the greatest crown index (IC = 1.5) and showed significant difference with P. ayacahyuite (IC = 1.2, P = 0.010) and P. montezumae (IC = 1.1, P = 0.049).
The tall saplings showed significant differences for the PC % (P = 0.002, gl = 79, F = 5.29), the IC (P = 0.002, gl = 79, F = 5.55) and the IE (P <0.001, gl = 79); F = 9.05). The highest value of PC % was obtained for P. aycahuite (PC% = 71.4), with significant differences with respect to P. leiophylla (P = 0.013) and P. montezumae (P = 0.008); the latter had the lowest IC (0.9) and significant differences with P. ayacahuite (P = 0.006) and P. patula (P = 0.017). The highest slenderness index was recorded for P. patula (IE = 72.8), and was significantly different from P. ayacahuite (P = 0.004), P. leiophylla (P = 0.001) and P. montezumae (P <0.001).
For the low trees, only IEV was significant (P = 0.037, gl = 19; F = 1.09); P. patula had the highest value (IEV = 32.0) and a significant difference with P. ayacahuite (P = 0.033).
The Student's t test for the morphometric indexes of the middle trees resulted in significant differences between the means of PC% (P = 0.002, gl = 16, t = 3.64); MC (P = 0.018, gl = 16; t = 2.63) and GE (P = 0.005; gl = 16; t = 3.29) of P. leiophylla and P. montezumae, the first with the most outstanding values (PC% = 70.2; MC = 0.4 and GE = 59.1). This same test for the morphometric indexes of the tall trees indicated a significant difference between the means PC % (P <0.001, gl = 50, t = 3.94) and the IC (P = 0.022, gl = 50, t = 2.36) of P. leiophylla and P. montezumae, the former exhibited the most outstanding values (PC% = 72.5 and IC = 2.3).
Population analysis
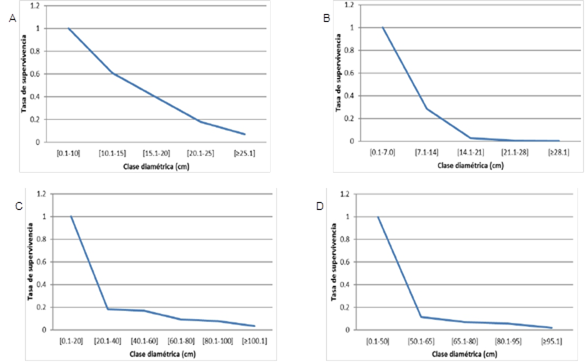
Pinus ayacahuite had the highest survival rate, which corresponded to the diametric class of 7.1 to 14 cm, and the highest mortality rate in the class of 21.1 to 28 cm; P. leiophylla has its highest survival rate between the diametric class of 60.1 to 80 cm and highest mortality between 20.1 and 40 cm in diameter; in P. montezumae the highest mortality rate was determined when reaching class 50.1 to 65 cm, and the survival rate in the class of 65.1 to 80 cm; finally, P. leiophylla had the highest survival rate in the diameter class of 10.1 to 15 cm and the mortality rate in the class of 0.1 to 10 cm (Table 3).
Table 3 Life tables by pine species.
| Diametric class |
nx | lx | dx | qx | kx | ex |
|---|---|---|---|---|---|---|
| Pinus ayacahuite | ||||||
| 0.1-7.0 | 800 | 1 | 1.286 | 1.286 | 1.251 | 0.816 |
| 7.1-14 | 229 | 0.286 | 0.311 | 1.087 | 2.438 | 0.605 |
| 14.1-21 | 20 | 0.025 | 0.029 | 1.150 | 1.897 | 0.700 |
| 21.1-28 | 3 | 0.0037 | 0.006 | 1.167 | 0.405 | 0.883 |
| ≥28.1 | 2 | 0.0025 | - | - | - | - |
| Pinus leiophylla | ||||||
| 0.1-20 | 88 | 1 | 0.818 | 0.818 | 1.705 | 1.040 |
| 20.1-40 | 16 | 0.182 | 0.011 | 0.063 | 0.065 | 2.469 |
| 40.1-60 | 15 | 0.170 | 0.080 | 0.467 | 0.629 | 1.600 |
| 60.1-80 | 8 | 0.91 | 0.011 | 0.125 | 0.134 | 1.563 |
| 80.1-100 | 7 | 0.80 | 0.45 | 0.571 | 0.847 | 0.754 |
| ≥100.1 | 3 | 0.34 | - | - | - | - |
| Pinus montezumae | ||||||
| 0.1-50 | 205 | 1 | 0.181 | 0.181 | 2.14 | 0.759 |
| 50.1-65 | 24 | 0.12 | 0.009 | 0.077 | 0.47 | 1.708 |
| 65.1-80 | 15 | 0.73 | 0.003 | 0.041 | 0.22 | 1.433 |
| 80.1-95] | 12 | 0.59 | 0.008 | 0.137 | 1.10 | 0.677 |
| ≥95.1 | 4 | 0.20 | - | - | - | - |
| Pinus patula | ||||||
| 0.1-10 | 28 | 1 | 0.393 | 0.39 | 0.50 | 1.71 |
| 10.1-15 | 17 | 0.607 | 0.214 | 0.35 | 0.44 | 1.50 |
| 15.1-20 | 11 | 0.393 | 0.214 | 0.55 | 0.79 | 1.05 |
| 20.1-25 | 5 | 0.179 | 0.107 | 0.60 | 0.92 | 0.70 |
| ≥25.1 | 2 | 0.071 | - | - | - | - |
nx = Number of individuals; lx = Survival rate; dx = Proportion of dead individuals between intervals x and x + 1; qx = Mortality rate; kx = Intensity of mortality; ex = Life expectancy
Using life tables, the survival curves were constructed for the four pine species (Figure 6), which were of type III, which indicates a high mortality in the first size classes; however, the P. patula curve showed a tendency to the type II curve, which implies that all individuals have the same probability of dying in any of the diametric classes.
Discussion
From a conservative perspective in forestry terms, the density of individuals per species shows the mass of pines in La Correa as mixed (González, 1996), despite the clear dominance of P. ayacahuite with respect to the other three taxa (< 80 %); Musálem and Ramírez (2003) suggest that this species is one of the preferred ones to reforest temperate and high mountain areas in the center of the country due to its rapid growth, tolerance to shade and ease of establishment.
The second most planted species, P. patula, grows naturally in subtropical to temperate cold environments (Farjon et al., 1997), and acclimates to different site conditions without problem; in the study area it presents a good development, although it is not a native of the state of Morelos.
Native species are highly tolerant to not very prolonged droughts, frosts and forest fires (Aguilar, 1999;Contreras et al., 2006), and are fundamental for the natural regeneration of the area (Rueda et al., 2013), especially P. leiophylla, because it behaves as a pioneer in the face of disturbances (Musálem and Martínez, 2003).
Regarding tree density, Castellanos et al. (2010) obtained varied pine densities in eight different types of communities, from 247 to 628 individuals ha-1. To the southwest of Durango, Nájera and Hernández (2008) estimated an average density per hectare of 239 trees between P. cooperi C. E. Blanco and P. leiophylla, of which they interpreted that the population that could maintain the site without competition between them would be of 454 individuals ha-1. Villanueva and McPherson (2002) calculated an average density of 627 individuals ha-1 in sites subject to disturbances due to changes in land use and fires, which they described as a regular density. The estimated density of pines for La Correa is similar to that of the works cited, corresponding to a regular mass, which is convenient, since it indicates that there must be spaces for the establishment of new individuals, as well as for their natural development on the site.
Densometric characterization
The basimetric area and the canopy cover are useful to characterize the horizontal structure of the forests both in terms of their dominance in the area, in the case of the former (Meave and Pérez, 2013), as well as in the capacity to function as a protective cover for the soil against erosion, in the latter (Rodríguez et al., 2008). In general terms, in this work the values obtained for the basal area are lower than what can be observed in areas under forest management, as indicated by Zepeda and Acosta (2000) in forests of P. montezumae (AB = 85 m2 ha-1), and Cruz et al. (2010) in stands of P. patula and P. teocote (AB = 19.96 m2 ha-1). In La Correa, young individuals predominate, which favor that the AB is low, something similar to what is reported by Domínguez et al. (2012) in stands of P. pseudostrobus (AB = 9.30 m2 ha-1) in unused areas in a forest in the Sierra Norte de Puebla, which is verified by the difference between the average heights between native and exotic species.
Physiognomic condition
According to the evaluation carried out in this study, the pines of La Correa are vigorous and healthy, reflecting a dynamic population that has favored the development of trees with little competition (Durlo, 2001; Arias, 2004; Arias, 2005), as shown by the high mortality rate of younger individuals of most of the species under study.
The results of standardized residue tests in P. ayacahuite for CGA may be explained by the competition to which younger individuals are subject, causing some level of stress among them (Schomaker et al., 1999).
Tree morphometry
Morphometric indexes have been used to analyze populations under forest exploitation; however, they are a reflection of the environmental and ecological conditions in which the trees grow, therefore they may be used to assess the populations that develop in the wild or with very little intervention, since they allow the evaluation of parameters such as level of competence, site quality and growth of individuals (Durlo and Denardi, 1998; Arias, 2005), based on indicators that are easy to record in the field during forest inventories.
In general, all species showed crown percentages above 50 % in all natural age classes. P. leiophylla was significantly superior in the medium trees to P. montezumae, which has the best natural pruning, whereas the opposite was recorded in P. ayacahuite for tall saplings, and in P. patula for low ones.
Durlo and Denardi (1998) established that the optimal range of crown index (IC) is between 0.3 and 1.5; since all natural age classes were included within this range, local ecological conditions are adequate for the species; however, despite the fact that some significant differences were observed in saplings, such behavior occurred in two species, so it is not possible to identify if any of them responds better to the place throughout its life. The result may be due to local particularities.
The vital space index (IEV) refers to how many times the diameter of the crown is greater than the normal diameter and the occupied space necessary for the tree to grow without air competition or overlapping crowns (Arias, 2005). In this study, only the lower roots of P. patula had a significant difference, as well as the higher value, indicating that the individuals of this stratum develop with a wider crown, since they have enough space to achieve it. This characteristic, together with its greater survival (Domínguez et al., 2012) and vital space index, make this species the one that fully satisfies the requirements for successful reforestation (Conafor, 2010); its potential coverage suggests the possible existence of a regular and dense canopy that protects the soil from water and wind erosion (Spurr and Barnes, 1982).
The amount or size of the crown (MC) is, according to Durlo and Denardi (1998), an index that reflects leaf productivity; in this research, the values between the species were close; however, P. patula seedlings and low sapling registered significantly lower values, which may reflect that the stands in which they grow have a lot of shade due to the effect of the crown of other individuals and this causes a more precarious development and foliage profusion; P. patula is heliophilous in its early stages of life and demands the reception of abundant and continuous solar irradiation (Velázquez et al., 2004). In La Correa, then, they form a suppressed stratum (Spurr and Barnes, 1982) in the presence of the larger specimens.
The last parameter was the degree of slenderness (GE) that allows to know how stable a tree is before the onslaught of very strong winds or snow (Arias, 2004); values lower than 100 are more conical, which from a structural point of view are stable and resistant to strong winds (Durlo and Denardi, 1998).
The results suggest that the exotic species are less conical than the native ones at the time of their establishment; P. patula is the most unstable because it maintains the highest significant values up to the low sapling category. This effect is due to the fact that the seedlings undergo a more important growth in height than in diameter, which produces thinner individuals at a certain height than expected, and this is interpreted as a colonization strategy by the canopy. The latter finally leads to slender and tall mature populations (Rivera and Flores, 2013).
In general terms, each index of this study coincides with that recorded by Arias (2005) in the sense of the taxa that develop in areas of low competition and with the appropriate site conditions.
Population analysis
Bordón et al. (2012) state that the life table is a useful tool for forest managers and forest technicians, to decide which trees and in which cohort (or size class for this work) can be cut, either to be utilized or to identify the portion of vulnerable population with a high mortality, which may favor the establishment and proliferation of important pests, such as bark beetles In the case of the Pinus genus.
Survival curves with a high mortality rate or type III are an expected behavior for populations that lack parental care, slow growth and aggregate distribution, which is common among plants (Carabias et al., 2007).
Although the high mortality of P. ayacahuite makes it an undesirable alternative for reforestation purposes (Domínguez et al., 2012), the loss of young individuals is a strategy of density control, which is an advantage for the effects of opening clear spaces (Spurr and Barnes, 1982), that in the long term maintain the mass with a dendrometric heterogeneity (De Camino and Budowski, 2014), with the appropriate repercussions on the possible outbreaks of plague or disease on any population cohort (Von Gadow et al., 2004, Vargas, 2013).
Conclusions
Of the four pine species identified, two are induced in the area by reforestation. Of these, the most abundant is P. ayacahuite; however, the pine community is not a pure mass, it is composed mainly by young and not very robust individuals, that develop up to the low tree natural age class; after which they are only represented by the native species of the place.
Dendrometric analysis show that pines develop in low competition conditions, forming broad and dense canopies, which is due both to the good spacing they have at the time of planting, and to the high mortality rate when they are younger.
The low competition and the elimination of less competitive individuals are factors that favor the health of the community, due to the good state of health and sanitary condition of the trunk and the crown that is most often exhibited by the pines. Even though the proportion of declining trees is not high, it is important to schedule monitoring work to detect, in an early stage, any phytosanitary problems or pests that may proliferate due to the presence of weakened trees.
Although the induced species are the least abundant, P. patula is the most efficient in terms of reforestation, with the mortality rate lower than that of P. ayacahuite, as well as for the two native species, therefore it must be kept under control, to avoid dominance at the site, by displacing the natural regeneration of P. montezumae and P. leiophylla, which are important for conservation of the site.
Acknowledgements
The authors wish to express their gratitude to the residents of the ejido for having allowed the realization of the field work. To Dr. Víctor López Gómez for his advice in the statistical analysis of information and Biol. Francisco Reséndiz Martínez for his observations on the thesis work that gave rise to this document.
REFERENCES
Aguilar B., S. 1999. Ecología del estado de Morelos: un enfoque geográfico. Editorial Praxis. Cuernavaca, Mor., México. 469 p. [ Links ]
Aguirre C., O. A., J. Jiménez P., E. J. Treviño G. y B. Meraz A. 1997. Evaluación de diversos tamaños de sitio de muestreo en inventarios forestales. Madera y Bosques 3(1): 71-79. [ Links ]
Arias A., D. 2004. Estudio de las relaciones altura-diámetro para seis especies maderables utilizadas en programas de reforestación en la Zona Sur de Costa Rica. Kurú: Revista Forestal 1(2): 1-11. [ Links ]
Arias, D. 2005. Morfometría del árbol en plantaciones forestales tropicales. Kurú: Revista Forestal 2(5): 1-13. [ Links ]
Benavides M., H. M. 2015. Metodología para el diagnóstico de áreas verdes urbanas e inventario de su arbolado. Libro Técnico Núm. 8. Cenid-Comef, INIFAP. México, D. F., México. 114 p. [ Links ]
Bien, A. 2010. El ecoturismo forestal como influencia positiva en el desarrollo social y ambiental de Costa Rica. Unasylva 61(263): 49 - 53. [ Links ]
Bordón P., P., E. Pérez-Laorga A., V. D. Estruch F. y E. Rodrigo S. 2012. Tabla de supervivencia de Pinus halepensis afectado por incendios forestales. Cuadernos de la Sociedad Española de Ciencias Forestales 36: 161-165. [ Links ]
Boyás D., J. C. 1992. Determinación de la productividad, composición y estructura de las comunidades arbóreas del estado de Morelos en base a unidades ecológicas. Tesis Doctoral. Facultad de Ciencias, Universidad Nacional Autónoma de México. México, D. F., México. 269 p. [ Links ]
Carabias, J., V. Arriaga y V. Cervantes G. 2007. Las políticas públicas de la restauración ambiental en México: limitantes, avances, rezagos y retos. Boletín de la Sociedad Botánica de México Suplemento 80: 85-100. [ Links ]
Castellanos B., J. F., E. J. Treviño G., O. A. Aguirre C., J. Jiménez P. y A. Velázquez M. 2010. Diversidad arbórea y estructura espacial del bosque de pino - encino en Ixtlán de Juárez, Oaxaca. Revista Mexicana de Ciencias Forestales 1 (2): 39-52. [ Links ]
Comisión Nacional Forestal (Conafor). 2010. Prácticas de reforestación. Manual Técnico. Secretaría de Medio Ambiente y Recursos Naturales. Zapopan, Jal., México. 64 p. [ Links ]
Comisión Nacional para el Conocimiento y Uso de la Biodiversidad (Conabio). 2009. Capital natural de México, vol. II: Estado de conservación y tendencias de cambio. Comisión Nacional para el Conocimiento y Uso de la Biodiversidad. México, D. F., México. 821 p. [ Links ]
Comisión Nacional para el Conocimiento y Uso de la Biodiversidad (Conabio). 2013. Parques nacionales. http://www.conanp.gob.mx/que_hacemos/parques_nacionales.php (2 de marzo de 2015). [ Links ]
Contreras MacB., T., J. C. Boyás D. y F. Jaramillo M. (eds). 2006. La diversidad biológica del estado de Morelos: Estudio de Estado. 1ª edición. Comisión Nacional para el Conocimiento y Uso de la Biodiversidad y Universidad Autónoma del Estado de Morelos. Morelos. Cuernavaca, Mor., México. 156 p. [ Links ]
Cruz L., I. A., J. R. Valdez L., G. Ángeles P. y H. M. De los Santos P. 2010. Modelación espacial de área basal y volumen de madera en bosques manejados de Pinus patula y P. teocote en el ejido Atopixco, Hgo. Madera y Bosques 16(3): 75-97. [ Links ]
Daniel, P. W., W. E. Helms y F. S. Baker. 1982. Principios de silvicultura. 2ª edición. McGraw-Hill. México, D. F., México. 492 p. [ Links ]
De Camino, R. y G. Budowski. 2014. Impactos ambientales de las plantaciones forestales y medidas correctivas de carácter silvicultural. http://www.researchgate.net/publication/262728776_impactos_ambientales_de_las_plantaciones_forestales_y_medidas_correctivas_de_caracter_silvicultural (20 de junio de 2016). [ Links ]
Domínguez D., M., F. Bravo y M. del Río. 2006. Modelos del tamaño de copa de Pinus sylvestris L. en bosques del centro de España. INCI. 31(3): 168 - 175. [ Links ]
Domínguez H., F., F. Huerta O., B. Barrios D. y M. A. Posadas G. 2012. Análisis dasométrico y propuesta de ordenamiento agroforestal del bosque en Tetela de Ocampo, Puebla. Avances en Investigación Agropecuaria 16(3): 75 - 82. [ Links ]
Durlo, D. M. y L. Denardi. 1998. Morfometría de Cabralea canjerana, em mata secundaria nativa do Rio Grande do Sul. Revista Ciência Florestal 8(1): 55-66. [ Links ]
Durlo, D. M. 2001. Relacoes morfométricas para Cabralea canjerana (Well.). Mart. Revista Ciência Forestal 11 (1): 141-149. [ Links ]
Farjon, A. and B. T. Styles. 1997. Pinus (Pinaceae). Flora Neotropica Monograph 75. The New York Botanical Garden. Bronx, New York, NY, USA. 293 p. [ Links ]
Farjon, A., J. A. Pérez de la Rosa y B. T. Styles. 1997. Guía de campo de los pinos de México y América Central. The Royal Botanic Garden, Kew-Instituto Forestal de Oxford, Oxford University. Oxford, RU. 151 p. [ Links ]
Fondo Nacional del Ambiente-Perú (FONAM). 2006. Propuesta final para la definición peruana de bosques a ser utilizados en proyectos de uso de la tierra, cambio de uso y silvicultura bajo el protocolo de Kyoto durante el primer periodo de compromiso. http://www.fonamperu.org/general/bosques/documentos/propuesta_final.pdf (2 de enero de 2015). [ Links ]
García, E. 1973. Modificaciones al sistema de clasificación climática de Köppen: Para adaptarlo a las condiciones de la República Mexicana. 2ª edición. Universidad Nacional Autónoma de México, Instituto de Geografía, México, D.F., México. 246 p. [ Links ]
González M., J. M. 1996. Tipificación de las masas mixtas de pino y rebollo en el centro de España y desarrollo de conceptos para su tratamiento selvícola. Cuadernos de la Sociedad Española de Ciencias Forestales . Núm. 3. Córdoba, España. pp. 147-165. [ Links ]
Google Earth Pro. 2015. Imagen de La Correa, municipio Tlalnepantla Morelos en Google Earth Pro. Escala indeterminada. https://www.google.com/maps/@19.05244,-98.93051,1493m/data=!3m1!1e3 (7 de enero de 2015). [ Links ]
Heroico Ayuntamiento Municipal Tlalnepantal (HAMT). 2014. Plan municipal de desarrollo 2013-2015. Tlalnepantla, Morelos. 144 p. [ Links ]
Instituto Nacional de Estadística, Geografía e Información (Inegi). 2010. VIII Censo Agrícola, Ganadero y Forestal. http://www.inegi.org.mx/est/contenidos/proyectos/Agro/ca2007/Resultados_Agricola/ (27 de enero de 2015). [ Links ]
Instituto para el Federalismo y el Desarrollo Municipal (Inafed). 2010. Tlalnepantla. http://www.inafed.gob.mx/work/enciclopedia/EMM17morelos/municipios/17023a.html (27 de febrero de 2015). [ Links ]
Loock, E. E. M. 1950. The pines of Mexico and British Honduras. Union of South Africa Department of Forestry Bull. Glenesk, Johannesburgh, South Africa. 244 p. [ Links ]
Martínez, M. 1948. Los pinos mexicanos. Editorial Botas. México, D. F., México. 361 p. [ Links ]
Meave del C., J. y E. A. Pérez G. 2013. Vegetación: caracterización y factores que determinan su distribución. In: Márquez-Guzmán, J., M. Collazo O., M. Martínez G., A. Orozco S. y S. Vázquez S. (eds). Biología de angiospermas. 1ª edición. Universidad Nacional Autónoma de México, Facultad de Ciencias: Coordinación de la Investigación Científica. México, D. F., México. pp. 470-477. [ Links ]
Musálem S., M. Á. y S. Martínez G. 2003. Monografía de Pinus leiophylla Schl. et Cham. Proyecto de Investigación, Manejo Sustentable y Conservación de la Biodiversidad de los Bosques de Clima Templado y Frío de México: Proyecto Sierra Madre. Instituto Nacional de Investigaciones Forestales, Agrícolas y Pecuarias, Centro de Investigación Regional del Centro, Libro Técnico Núm. 8. Texcoco, Edo. de Méx., México. 85 p. [ Links ]
Musálem S., M. Á. y Á. Ramírez L. 2003. Monografía de Pinus ayacahuite var. veitchii Shaw. Proyecto Sierra Madre. Instituto Nacional de Investigaciones Forestales, Agrícolas y Pecuarias. Centro de Investigación Regional del Centro. Libro Técnico Núm. 6. Texcoco, Edo. de Méx., México. 364 p. [ Links ]
Nájera L., J. A. y E. Hernández H. 2008. Relación morfométrica de un bosque coetáneo de la región de El Salto, Durango. Ra Ximhai: Revista de la Sociedad, Cultura y Desarrollo Sustentable 4(1): 69-81. [ Links ]
Organización de las Naciones Unidas para la Agricultura y la Alimentación (FAO). 2004. Inventario forestal nacional: manual de campo. Departamento de Montes. Ciudad de Guatemala, Guatemala. 89 p. [ Links ]
Ornelas R., F. R., R. Ambriz C. y J. D Bustamante O.1997. Delimitación y definición de agrohábitats del estado de Morelos. Campo Experimental Zacatepec. Cir-Centro INIFAP. Zacatepec, Mor., México. Publicación Especial Núm. 11. 20 p. [ Links ]
Perry Jr., J. P. 1991. The pines of Mexico and Central America. Timber Press. Portland, OR, USA. 231 p. [ Links ]
Rivera H., J. E. y N. Flores H. 2013. Flora y vegetación del Distrito Federal: Conservación y problemática. Centro de Estudios Geográficos, Biológicos y Comunitarios, S. C., Universidad Autónoma Metropolitana-Iztapalapa. México, D.F., México. 132 p. [ Links ]
Rodríguez L., R., S. Valencia M., J. Meza R., M. A. Capó A. y A. Reynoso P. 2008. Crecimiento y característica de la copa de procedencias de Pinus grgii Engelm. en Galeana, Nuevo León. Revista Fitotecnia Mexicana 31(1): 19 - 26. [ Links ]
Rueda, S. A., G. Ramírez O., J. A. Ruiz C., F. Moreno S., A. González H., O. U. Martínez B., J. T. Sáenz R., H. J. Muñoz F., A. Molina C. y V. M. Jiménez E. 2013. Requerimientos agroecológicos de especies forestales, Campo Experimental Centro Altos de Jalisco. Libro Técnico Núm. 4. Tepatitlán de Morelos, Jal., México. 226 p. [ Links ]
Sánchez G., A. y M. González L. 2007. Técnicas de colecta de plantas y herborización. In: Contreras-Ramos, A., C. Cuevas C., I. Goyenechea y U. Iturbe (eds.). La sistemática, base del conocimiento de la biodiversidad. Universidad Autónoma del Estado de Hidalgo (UAEH). Pachuca, Hgo., México. 133 p. [ Links ]
Schomaker, M., S. Zanoch and K. Stolte. 1999. Tree crown condition indicator. USDA. Forest Service. Forest Health Monitoring. Asheville, NC, USA. 4 p. [ Links ]
Secretaría de Desarrollo Agropecuario del Estado de Morelos (Sedagro-Mor). 2012. Tlalnepantla. Compendio Estadístico para un Desarrollo Integral y Sustentable del Sector Agropecuario y Rural. http://www.oeidrus-morelos.gob.mx/compendio/files/Tlalnepantla.pdf (27 de febrero de 2015). [ Links ]
Secretaría de Medio Ambiente y Recursos Naturales (Semarnat). 2006. Introducción al ecoturismo comunitario. Centro Nacional de Educación y Capacitación para el Desarrollo Sustentable. Comisión Nacional Forestal. Zapopan, Jal., México. 119 p. [ Links ]
Secretaría de Medio Ambiente y Recursos Naturales (Semarnat). 2009. Turismo de naturaleza. Coordinación General de Educación y Desarrollo Tecnológico. Comisión Nacional Forestal. Zapopan, Jal., México. 119 p. [ Links ]
Spurr, S. H. y B. V. Barnes. 1982. Ecología forestal. A.G.T. Editor, S. A. México, D. F., México. 269 p. [ Links ]
Ugalde, L. A. 1981. Conceptos básicos de dasometría. Centro Agronómico Tropical de Investigación y Enseñanza (CATIE), Programa de Recursos Naturales Renovables. Turrialba, Costa Rica. 23 p. [ Links ]
Valdivia G., J. J., E. D. Arroyo Q., J. A. Bustamante M., J. C. Callo C. y M. D. Chávez M. 2015. Morfometría de Bartholletia excelsa H.B.K., aplicaciones en la selección de árboles semilleros en una concesión castañera ubicada en el centro poblado Planchón, distrito Las Piedras, Tambopata, Madre de Dios. El Ceprosimad 3(1): 23 - 35. [ Links ]
Vargas L., B. 2013. Manual de mejores prácticas de manejo forestal para la conservación de la biodiversidad en ecosistemas templados en la región norte de México. Semarnat, Conafor, Programa de las Naciones Unidas para el Desarrollo (PNUD), Rainforest Alliance. Zapopan, Jal., México. 87 p. [ Links ]
Valverde V., T., J. A. Meave del Castillo, J. Carabias Lillo y Z. Cano Santana. 2005. Ecología y medio ambiente. Editorial Pearson Educación de México S.A. de C.V. Naucalpan de Juárez, Edo. de Méx., México. 240 p. [ Links ]
Velasco B., E., E. N. Cortés B., A. González H, F. Moreno S. y H. M. Benavides M. 2013. Diagnóstico y caracterización del arbolado del bosque de San Juan de Aragón. Revista Mexicana de Ciencias Forestales 4(19): 103-111. https://doi.org/10.29298/rmcf.v4i19.382. [ Links ]
Velázquez M., A., G. Ángeles P., T. Llanderal O., A. R. Román J. y V. Reyes H. 2004. Monografía de Pinus patula. 1ª edición. Comisión Nacional Forestal, Colegio de Postgraduados. Texcoco, Edo. de Méx., México. 124 p. [ Links ]
Venegas M., G. M. 2006. Ecoturismo: instrumento de desarrollo sustentable. Universidad de Antioquía. Antioquía, Medellín, Colombia. 59 p. [ Links ]
Villanueva D., J. y G. R. McPherson. 2002. Impacto del cambio de uso del suelo e incendios en la estructura de tres comunidades forestales. Ciencia Forestal en México. 27(91): 27 - 54. [ Links ]
Von Gadow, K., S. Sánchez O. y O. A. Aguirre C. 2004. Manejo forestal con bases científicas. Madera y Bosques 10(2): 3 - 13. [ Links ]
Zar, J. H. 2010. Bioestatistical analysis. Pearson Publishing House. Upper Saddle River, NJ, USA. 944 p. [ Links ]
Zepeda B., E. M. y M. Acosta M. 2000.Incremento y rendimiento maderable de Pinus montezumae Lamb. en San Juan Tetla, Puebla. Madera y Bosques 6(1): 15-27 [ Links ]
Received: January 31, 2018; Accepted: November 26, 2018
 Este es un artículo publicado en acceso abierto bajo una licencia Creative Commons
