


Serviços Personalizados
Journal
Artigo
 texto em
  Inglês (pdf)
 Artigo em XML
 Referências do artigo
 Enviar este artigo por email
Indicadores
-
 Citado por SciELO
 -
 Acessos
Links relacionados
-
 Similares em
SciELO
Similares em
SciELO
Compartilhar

 Permalink
Revista mexicana de ciencias forestales
versão impressa ISSN 2007-1132
Rev. mex. de cienc. forestales vol.9 no.50 México Nov./Dez. 2018
https://doi.org/10.29298/rmcf.v9i50.255
Articles
Climate change scenarios (CMIP-5) for three protected natural areas in the Transversal Neovolcanic belt
1Facultad de Ciencias Forestales. Universidad Autónoma de Nuevo León., México.
Due to climate change, precipitation and temperature patterns will cause significant changes in the ecosystems of the world. The tool used to simulate future climate is the Global Circulation Models (GCM), which are used to generate future climate scenarios. The objective of this study was to estimate climate scenarios for 2045-2069 for the Pico de Orizaba natural protected areas (ANP), Nevado de Toluca and Volcán Nevado de Colima. The monthly climatic layers at 1 km2 were used for the present and future of the CRNMCM5 and GDFL_CM3 MCG with a radioactive forcing (RCP) of 4.5 (constant CO2 emissions) and 8.5 (increasing CO2 emissions). The layers were trimmed to the size of the ANP, and the scale was adjusted from 1 km2 to 30 m. The current and future climate was estimated and the differences between the two were calculated. Various climate change scenarios were generated. Results for 2045-2069 indicate a decrease in precipitation between 18 and 52 mm for Pico de Orizaba, 61 to 99 mm for Nevado de Toluca and 27 to 38 mm for Volcán Nevado de Colima; increase in average annual temperature of 1.32 °C to 1.67 °C (Pico de Orizaba), 1.30 °C to 1.76 °C (Nevado de Toluca) and 0.91 °C to 1 °C (Volcán Nevado de Colima). Changes in temperature and precipitation could lead to more frequent forest fires, increased incidence of forest pests and reduced reload of aquifers.
Key words: Climate analysis; increase in temperature; forest ecosystems; future scenarios; GCM; GIS
Debido al cambio climático, los patrones de precipitación y temperatura ocasionarían cambios importantes en los ecosistemas del mundo. Los Modelos de Circulación Global (MCG) se utilizan para simular el clima a futuro y con ello se generan escenarios climáticos. El objetivo del presente trabajo consistió en estimar escenarios climáticos para 2045-2069 para las áreas naturales protegidas (ANP) Pico de Orizaba, Nevado de Toluca y Volcán Nevado de Colima. Se emplearon las capas climáticas mensuales a 1 km2 para el presente y futuro de los MCG CRNMCM5 y GDFL_CM3 con un forzamiento radiactivo (RCP) 4.5 (emisiones de CO2 constantes) y 8.5 (emisiones de CO2 en aumento). Se recortaron las capas al tamaño de las ANP, y se ajustó la escala de 1 km2 a 30 m. Se generaron diversos escenarios de cambio climático. Los resultados para el periodo 2045-2069 indican una disminución en la precipitación pluvial entre 18 y 52 mm para el Pico de Orizaba, de 61 a 99 mm para el Nevado de Toluca y de 27 a 38 mm para el Volcán Nevado de Colima; un aumento en la temperatura media anual de 1.32 °C a 1.67 °C en el Pico de Orizaba, de 1.30 °C a 1.76 °C en el Nevado de Toluca y de 0.91 °C a 1 °C en el Nevado de Colima. Los cambios en ambas variables pueden propiciar incendios forestales más frecuentes, mayor incidencia de plagas forestales y menor recarga de los mantos acuíferos.
Palabras clave: Análisis climático; aumento en temperatura; ecosistemas forestales; escenarios a futuro; MCG; SIG
Introduction
The concept of climate change describes the changes in climate attributed directly or indirectly to human activity that alters the composition of the atmosphere. The Intergovernmental Panel on Climate Change (IPCC) declared in 2013 (IPCC, 2013a) that the global warming observed in the middle of the last century was the product of anthropogenic actions, which added to the climatic variability during the period from 1901 to 2012, showed a significant increase of 1 ° C in the average temperature of the entire planet (IPCC, 2014). On the other hand, precipitation has presented erratic behaviors (Conafor, 2013; Conanp, 2015a). An irrefutable fact is that the climate in the world has changed and will continue to radically change in the future (Magallanes, 2016).
In studies of climate change, the resource used is the Global Circulation Models (GCM). These models are a three-dimensional numerical representation of the atmospheric dynamics and of the global circulation around the planet (Jáuregui, 2003); they simulate physical processes of the atmosphere, oceans and the earth's surface, and constitute a tool to forecast the future climate response to increases in greenhouse gases in the atmosphere (IPCC, 2013b). When used in climate change studies, they become scenarios of climate change, which are projected to different time horizons (near future 2015-2039, medium future 2045-2069 and distant future 2075-2099) (Fernández et al., 2015).
The constant increase in temperature, the variation in precipitation and the frequency of extreme climatic events are producing enormous impacts on the forests and the forestry sector of the world (Moore and Allard, 2009; Sosa, 2015). Currently, one of the consequences of these modifications are the outgrowths in the phenology of the flora, the displacement of species, a greater frequency of forest fires and the incidence of forest pests in coniferous forests and the increase in tree mortality (Kurz et al., 2008; Anderegg et al., 2013).
During this century, the impacts of climate change would pose a high risk of affecting the structure and function of the terrestrial and aquatic ecosystems of the world, on a regional scale (IPCC, 2014). It is estimated that, due to climate change, the planet's temperature would increase to 2 °C by the middle of the 21st century (Garreaud, 2011). Under these scenarios, many of the species would be unable to survive in the new climates, their habitats would be fragmented and the functioning of the ecosystems would be transformed (Jiménez et al., 2010; IPCC, 2014).
Climate change scenarios in Mexico indicate that Pinaceae would be among the groups most affected by the increase in temperature (Sáenz et al., 2012; Cruz-Cárdenas et al., 2016); one of the most susceptible species is Abies religiosa (Kunth) Schltdl. et Cham., which could reduce up to 87.6 % its distribution area by 2060 (Sáenz et al., 2012).
All these changes would alter, in many ways and with great probability, the dynamics and functioning of forest ecosystems in Mexico (Moore and Allard, 2009, IPCC, 2014; Islas et al., 2015; Ibarra and Huerta, 2016).
According to FAO (2003) due to the effect of climate change, by 2050 about 25 % of biodiversity would face a greater risk of extinction, especially those conifer tree species that live in the temperate forests of central Mexico (Sáenz et al., 2012; Cruz-Cárdenas et al., 2016).
The natural protected areas (NPA) in Mexico are terrestrial and marine regions with ecosystems representative of the place that have not been significantly altered by man; they are subject to special regimes of protection, conservation and restoration, and the activities that can be carried out in them are established following the Ley General de Equilibrio Ecológico y Protección al Ambiente (General Law of Ecological Equilibrium and Environmental Protection) (Conanp, 2018). Unfortunately, the NPA are not exempt from climate modifications; according to Villers and Trejo (1998), 57 % of the country would change their precipitation and temperature regimes by 2025. The authors tested two models; CCC (Canadian Climate Center) and GDFL (Geophysical Fluid Dynamics Laboratory) with which they found that only 9 of 33 federal terrestrial NPA evaluated in Mexico would not be impacted by the effects of climate change. Other contributions (Sáenz et al., 2012; Islas et al., 2015; Cruz-Cárdenas et al., 2016) confirm the approach of FAO (2003) mentioned above.
In the Transverse Neovolcanic Belt, there are natural protected areas of great biological richness that provide timber and non-timber resources, provide incalculable environmental services and provide water to the inhabitants who live near them. Despite their benefits, they do not have studies of climate change scenarios within their management and conservation programs, so the main objective of this study was to estimate such scenarios for the medium future (2045-2069) for protected natural areas. Pico de Orizaba, Nevado de Toluca and Nevado de Colima Volcano. Specifically, the current and future climate was estimated and climatic scenarios were generated.
Materials and Methods
Study Area
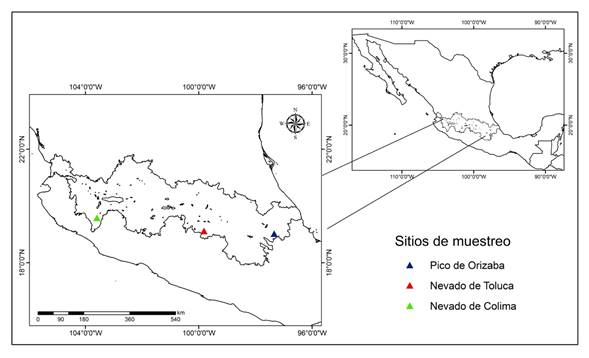
The three sites analyzed are federal natural protected areas and are located within the Transverse Neovolcanic Belt (Figure 1).
Pico de Orizaba National Park
It is located between 18°56'30'' and 19°09'30'' north latitude and 97°12'30'' and 97°22'30'' west in the states of Puebla and Veracruz and covers an area of 19 750 ha (Conanp, 2015b).
The prevailing climates are C(w1) temperate, subhumid with an annual average temperature around 12 °C; Cb'(w2) semi-cold, sub-humid with an annual average temperature of 5 and 12 °C; E(T) CHw cold, with an annual average temperature between -2 and 5 °C; Very cold EFHw, annual average temperature less than -2 °C (García, 1998).
The types of vegetation in the area are pine forest, fir forest, induced grasslands, high mountain meadow, seasonal agriculture, and secondary arboreal and pine forest tree vegetation (INEGI, 2013).
Nevado de Toluca Flora and Fauna Protection Area
Its geographic coordinates are 18°51'31'' and 19°19'03'' north and 99°38'54'' and 100°09'30'' west in the State of Mexico and cover an area of 53 590.7 ha (Conanp, 2016).
The prevailing climates are: Cb'(w2) semi-cold, sub-humid with an annual average temperature between 5 and 12 °C; E(T)CHw cold, with an annual average temperature between -2 and 5 °C; C(w1) temperate, sub-humid with an annual average temperature between 12 °C and C(w2) tempered, sub-humid with an annual average temperature of 12 to 18 °C (García, 1998).
The types of vegetation are represented by secondary tree forms of pine and fir forest, bush forests of oak, fir and pine, induced grasslands, high mountain meadow, fir forests, oak, pine, pine-oak, oak pine and seasonal agriculture (INEGI, 2013).
Nevado de Colima Volcano National Park
Its geographic coordinates are 19°27'15 '' and 19°35'09'' north latitude and 103°34'38 '' and 103°39'04'' west longitude in the states of Jalisco and Colima and it has an area of 6 555 ha (Conanp, 2006).
The climates correspond to the types Cb'(w2) semi-cold, sub-humid with an annual average temperature between 5 and 12 °C; E(T) CHw cold, with an annual average temperature between -2 and 5 °C; and C(w2) temperate, subhumid with an annual average temperature between 12 and 18 °C (García, 1998).
According to Inegi (2013) the vegetation in the area is made up, mainly, by high mountain prairie, by fir, pine, pine-oak forests and, to a lesser extent, by mesophilic mountain forests.
Obtaining current climatic layers
The current monthly climatic layers were obtained for precipitation and average temperature at http://atlasclimatico.unam.mx/atlas/kml/ (CCA, 2016), which represent the average historical climate behavior of 1902-2011 and have a spatial resolution of 1 km2 for the whole country. The layers were trimmed to the size of the natural protected areas (NPA).
Global Circulation Models (MCG)
The monthly climatic layers were downloaded from MCG CRNMCM5 (Meteorological Research National Center of France) and GDFL_CM3 (Geophysics Laboratory of Fluid Dynamics from the NOAA, USA) which were generated from the Regional Models Regional Models of the Project of Intercomparison of Coupled Models Phase 5 (CMIP5, 2013) del Intergovernmental Panel on Climate Change (IPCC) planned for the 2045-2069 period with two radioactive forcings (RCP) of 4.5 (CO2 constant emissions) and 8.5 (CO2 high emissions) for precipitation and mean temperature at 1 km2 spatial scale for the whole country (Fernández et al., 2015) in http://atlasclimatico.unam.mx/AECC_descargas/. The climate layers were trimmed to the NPA size.
Reduction of scale
The spatial resolution of 1 km2 was readjusted on a spatial scale of 30 m (1 second arc) by means of a bilinear interpolation.
Current and future climate
The current and future climates were obtained from the sum of the 12 monthly layers of precipitation and the average of the 12 layers of average temperature for the present and future periods, respectively.
Climate change scenarios
The climate change scenarios were estimated from the difference between the current and future climate layers of the CRNMCM5 and GDFL_CM3 models with the two radioactive forcings RCP 4.5 and 8.5 projected to 2045-2069. The scenarios with radioactive forcing RCP 4.5 are classified as "conservative" scenarios, and the scenarios with radioactive forcing RCP 8.5 as "extremes" (Fernández et al., 2015).
All the processes described above were carried out with the help of the map algebra module of the Arcmap 10.3® program (ESRI, 2014).
Results and Discussion
Present climate
The results obtained from the historical average 1902-2011 of the current climate are presented in Table 1, where the values for annual precipitation and annual mean temperature are described.
Future climate 2045-2069
The results obtained for precipitation and annual mean temperature of projections RCP 4.5 and 8.5 to 2045-2069 for the three NPA are described in Table 2.
Table 2 Precipitation and mean temperature of the three assessed NPA for 2045-2069.
| NPA | Analized variable | CRNMCM5 modelRCP 4.5Minimum-Maximum | GDFL_CM3 modelRCP 4.5Minimum-Maximum | CRNMCM5 modelRCP 8.5Minimum-Maximum | GDFL_CM3 modelRCP 8.5Minimum-Maximum |
|---|---|---|---|---|---|
| Pico de Orizaba | PPT (mm) | 990 a 2 328 | 1 044 a 2 382 | 1020 a 2358 | 1 000 a 2 338 |
| TMED (°C) | -0.20 a 12.44 | 0.90 a 13.58 | 0.29 a 12.95 | 1.60 a 14.31 | |
| Nevado de Toluca | PPT (mm) | 813 a 1 241 | 812 a 1 240 | 810 a 1238 | 788 a 1212 |
| TMED (°C) | 5.63 a 13.65 | 6.94 a 14.97 | 6.21 a 14.23 | 7.71 a 15.75 | |
| Volcán Nevado de Colima | PPT (mm) | 981 a 1 429 | 935 a 1 413 | 962 a 1411 | 923 a 1 381 |
| TMED (°C) | 7.36 a 17.15 | 8.56 a 18.37 | 7.89 a 17.65 | 9.26 a 19.04 |
PPT= Annual accumulated precipitation; TMED = Annual mean temperature.
Pico de Orizaba
Conservative scenarios indicate an annual decrease between 18 to 52 mm (2.2 %) of precipitation (GDFL_CM3 RCP 4.5) in 85.8 % of the NPA and an increase in the annual mean temperature between 1.55 to 1.67 °C (15.3 %) in 79 % of the area for 2045-2069 (MCG CRNMCM5 RCP 4.5).
The extreme scenarios predict a decrease in annual precipitation between 47 to 76 mm (3.1 %) in 91.8 % of the NPA (CRNMCM5 RCP 8.5) and an increase between 2.07 to 2.18 °C (20 %) in the annual mean temperature in 66.8 % of the NPA for 2045-2069 (CRNMCM5 RCP 8.5).
Figure 2 shows the conservative climatic (a) and extreme (b) scenarios for precipitation and mean temperature for the Pico de Orizaba.
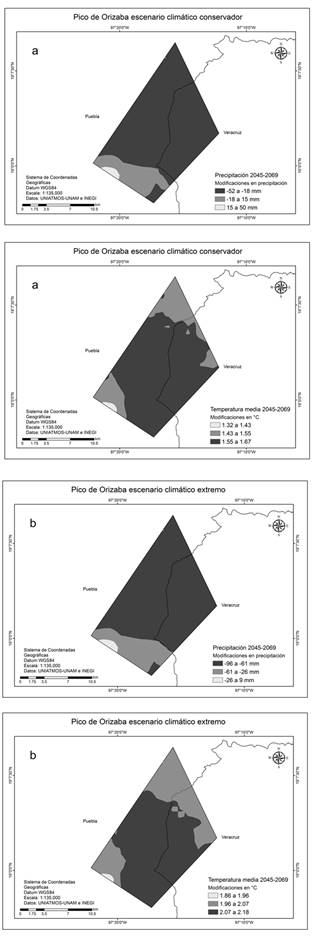
Escenario climático conservador = Conservative climatic scenario; Escenario climático extremo = Extreme climatic scenario; Precipitación = Rainfall; Modificaciones en precipitación = Modifications in rainfall; Temperatura media = Average temperature.
Figure 2 Conservative climatic scenarios (a) and extremes (b) for precipitation and average temperature of Pico de Orizaba.
Nevado de Toluca
The climatic scenarios indicate an annual decrease between 61 to 98 mm (7.5 %) in precipitation (MCG CRNMCM5 RCP 4.5) in 63.9 % of the NPA and an increase between 1.30 to 1.45 °C (11.9 %) in average annual temperature in 83.6 % of the area for 2045-2069 (MCG CRNMCM5 RCP 4.5).
The extreme scenarios predict a decrease in annual precipitation between 64 to 102 mm (7.9 %) in the 56.4 of the NPA (CRNMCM5 RCP 8.5) and an increase in average annual temperature between 1.87 to 2.03 °C (16.6 %) in 78.9 % of the area for 2045-2069 (MCG CRNMCM5 RCP 8.5).
Figure 3 shows the conservative climatic (a) and extreme (b) scenarios for precipitation and average temperature for the Nevado de Toluca.
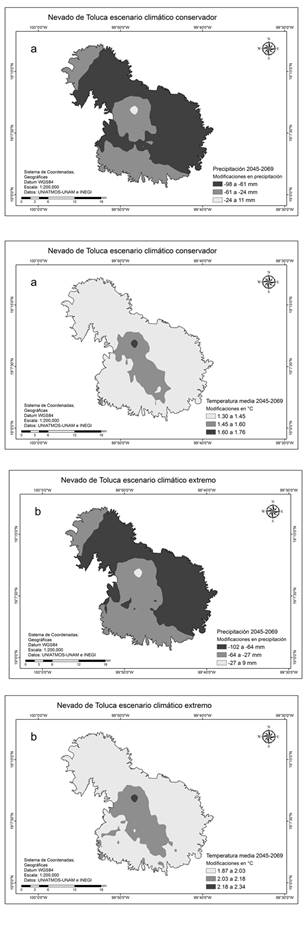
Escenario climático conservador = Conservative climatic scenario; Escenario climático extremo = Extreme climatic scenario; Precipitación = Rainfall; Modificaciones en precipitación = Modifications in rainfall; Temperatura media = Average temperature
Figure 3 Conservative climatic scenarios (a) and extremes (b) for precipitation and average temperature of Nevado de Toluca.
Nevado de Colima Volcano
The climatic scenarios indicate an annual decrease between 6 to 15 mm (1.1 %) in precipitation (GDFL_CM3 RCP 4.5) in 89 % of the NPA and an increase between 0.95 to 0.98 °C (6 %) in average annual temperature in 70 % of the area for 2045-2069 (MCG CRNMCM5 RCP 4.5).
The extreme scenarios predict a decrease in annual precipitation between 27 to 38 mm (2.7 %) in 60 % of the NPA (GDFL_CM3 RCP 8.5) and an increase in average annual temperature between 1.49 to 1.53 °C (9.4 %) in 63 % of the area for 2045-2069 (MCG CRNMCM5 RCP 8.5).
Figure 4 shows the conservative climatic (a) and extreme (b) scenarios for precipitation and average temperature for the Nevado de Colima Volcano.
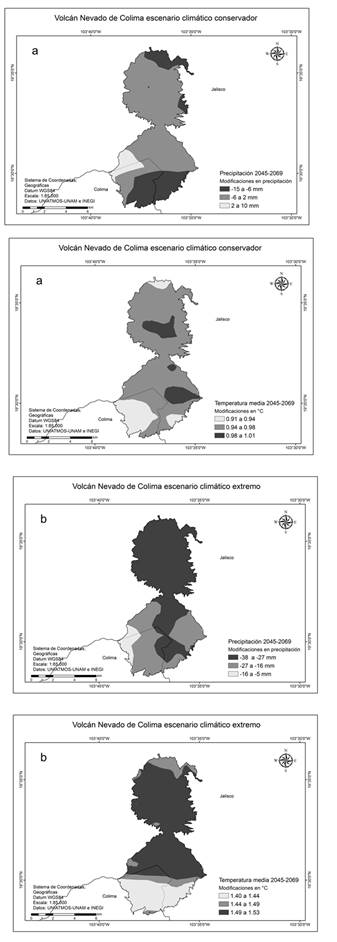
Escenario climático conservador = Conservative climatic scenario; Escenario climático extremo = Extreme climatic scenario; Precipitación = Rainfall; Modificaciones en precipitación = Modifications in rainfall; Temperatura media = Average temperatura.
Figure 4 Conservative climatic scenarios (a) and extremes (b) for precipitation and average temperature of the Nevado de Colima Volcano.
Among the main consequences of climate change can be mentioned the increase in temperature and an erratic behavior in rainfall as an increase, decrease or displacement of rain to other geographic regions (Conafor, 2013; Conanp, 2015a).
The projections for future precipitation of the Semarnat Special Climate Change Program (PECC, 2014) suggest an average decrease in the country of around 10 % by 2030. Sáenz et al. (2010) forecast an average decrease of 9 % in the precipitation of 2060 and Sosa (2015) foresees an average decrease of up to 20 % from 2020 for Mexico.
The results of the scenarios for annual accumulated precipitation predict a decrease between 3.1 % for the Pico de Orizaba, 7.9 % for the Nevado de Toluca and 2.7 % for the Nevado de Colima Volcano for 2045-2069, these results are within the intervals of decrease calculated by Sáenz et al. (2010) for that time horizon analyzed.
The IPCC (2014) states that an increase of 1 to 2 ° C in average annual temperature would represent a moderate damage to the biodiversity and economy of the whole world, whereas if it were> 3.5 ° C it would be detrimental to most terrestrial ecosystems and marine, which could produce extinctions between 40 until 70 % of the world's species (IPCC, 2007); a drastic increase in temperature and a marked decrease in precipitation by 2050 could cause a significant reduction in coniferous forests in Mexico (Sáenz et al., 2012; PECC 2014-2018).
Sáenz et al. (2010) and Conanp (2015a) estimate for Mexico, an increase in the average annual temperature of 0.5 to 2 ° C by 2030, from 2.3 °C by 2060 and up to 3.7 °C by 2090. In this work, the protected natural area that is would be more affected by the increase in average annual temperature would be the Nevado de Toluca, where it would increase between 1.30 and 1.45 °C in 83.6 % of the NPA (conservative scenario) to 1.87 to 2.03 °C in 16.6 % of the NPA (extreme scenario) for 2045-2069, values slightly lower than those of Sáenz et al. (2010).
Villers and Trejo (1998) and Sáenz et al. (2012) foresee that dry forests would increase their distribution (7.4 %), while temperate and cold forests would reduce their distribution areas between 65 % and 87.6 %, respectively; in addition, sites such as the Monarch Butterfly Reserve would present warmer conditions for 2060 (2.3 °C) (Sáenz et al., 2010), climatic conditions similar to those that would occur in the Pico de Orizaba, the Nevado de Toluca and the Nevado de Colima Volcano.
Manzanilla and Aguirre (2017) estimated, for conservative scenarios, an increase in the annual average temperature between 0.41 and 0.83 °C (100 %) and a decrease in annual precipitation between 71 and 35 mm (88 %) for the Reserve of the El Ocote Tropical Forest Biosphere, Chiapas State, by 2030; in this work, the conservative scenarios for 2045-2069 point to the Nevado de Colima volcano as the site least affected by climate change, where annual precipitation would decrease between 6 and 15 mm (1.1 %) and the annual average temperature would increase between 0.95 and 0.98 °C (6 %), so that the areas located in the mountains (Nevado de Toluca) would have a greater increase in average annual temperature compared to tropical areas such as the aforementioned Reserve.
Finally, the increase in average annual temperature would affect 49 % of the surface (pine forest) of Pico de Orizaba, 24 % of the surface (Abies religiosa forest) of Nevado de Toluca and 42.2 % of the surface (mountain high meadow) of the Nevado de Colima Volcano. The ecosystem most vulnerable to these changes in climate would be the forest of A. religiosa del Nevado de Toluca, where the future climate scenarios are not encouraging for the species in Mexico (Sáenz et al., 2012).
Faced with such anomalies, the ecosystems in the three NPA analyzed would have two options: adjust to the new climatic conditions, which would involve resisting water stress, pest attacks and forest fires; or migrate in an altitudinal way as indicated by Sáenz et al. (2010), when, for each 0.5 °C increase, the species would have to move 100 m. The forests of A. religiosa existing in the Nevado de Toluca would have to move in that sense from 150 m (1.3 °C) to 250 m (2.34 °C) to subsist during the period 2045-2069.
Conclusions
The climate of the planet has changed and is in constant transformation, alterations that would modify the coverage of many ecosystems of the world including the natural protected areas of Mexico.
Climate change scenarios should not be taken as simple forecasts but as possible future climate behaviors.
Of the three NPA analyzed, the models highlight the Nevado de Toluca as the site that would be most affected by climate change, in particular, the A. religiosa forest.
Due to the decrease in annual precipitation the recharge of aquifers would be less and less in the protected natural areas. The increase in average annual temperature would reduce the surface of the Jamapa glacier in the Pico de Orizaba, so it is very likely that by 2050, the glacier has almost completely disappeared.
It is important to mention that the results of this work are convincing but not conclusive; it is recommended to use more Global Circulation Models with different radioactive forcings (RCP) to estimate the future climate variability of the geographic region of interest.
Acknowledgements
The authors thank the Facultad de Ciencias Forestales de la Universidad Autónoma de Nuevo León (School of Forest Sciences of the Autonomous University of Nuevo Leon), for the support provided for the execution of the study described. To the Consejo Nacional de Ciencia y Tecnología (Conacyt) (National Council of Science and Technology) (Conacyt) for the support of a postgraduate scholarship to the first author. To the anonymous reviewers for their comments and suggestions, which helped to improve the content of this work.
REFERENCES
Anderegg, W. R. L., J. M. Kane and L. D. L. Anderegg. 2013. Consequences of widespread tree mortality triggered by drought and temperature stress. Nature Climate Change 3:0-36. [ Links ]
Centro de Ciencias de la Atmósfera (CCA). 2016 Bases de datos y metadatos. Universidad Nacional Autónoma de México. Ciudad de México, México. http://atlasclimatico.unam.mx/atlas/kml/ (15 de noviembre de 2017). [ Links ]
Comisión Nacional de Áreas Naturales Protegidas (Conanp). 2006. Programa de Conservación y Manejo Parque Nacional Volcán Nevado de Colima. México, D. F., México. 194 p. [ Links ]
Comisión Nacional de Áreas Naturales Protegidas (Conanp). 2015a. Estrategia de cambio climático desde las Áreas Naturales Protegidas: Una Convocatoria para la Resiliencia de México (2015-2020). 1ª. edición. Secretaría de Medio Ambiente y Recursos Naturales. México, D. F., México. 62 p. [ Links ]
Comisión Nacional de Áreas Naturales Protegidas (Conanp). 2015b. Programa de Manejo Parque Nacional Pico de Orizaba. 1ª. edición. México, D. F., México. 187 p. [ Links ]
Comisión Nacional de Áreas Naturales Protegidas (Conanp). 2016. Programa de Manejo Área de Protección de Flora y Fauna Nevado de Toluca. 1ª. Edición. Ciudad de México, México. 203 p. [ Links ]
Comisión Nacional de Áreas Naturales Protegidas (Conanp). 2018. Áreas Naturales Protegidas Decretadas. https://www.gob.mx/conanp/acciones-y-programas/areas-naturales-protegidas-decretadas (3 de junio de 2018). [ Links ]
Comisión Nacional Forestal (Conafor). 2013. Bosques, cambio climático y REDD+ en México. Guía básica. 2ª edición. Zapopan, Jal., México. pp 15-17. [ Links ]
Coupled Model Intercomparison Project Phase 5 (CMIP5). 2013. Coupled Model Intercomparison Project Phase 5. https://pcmdi.llnl.gov/mips/cmip5/ (3 de junio de 2018). [ Links ]
Cruz-Cárdenas, G., L. López-Mata, J. T. Silva, N. Bernal-Santana, F. Estrada-Godoy and J. A. López-Sandoval. 2016. Potential distribution model of Pinaceae species under climate change scenarios in Michoacán. Revista Chapingo Serie Ciencias Forestales y del Ambiente 2:135-148. [ Links ]
Environmental Systems Research Institute (ESRI). 2014. ArcGis Desktop: 10.3. Software diseñado para análisis espacial y Sistemas de Información Geográfica. Redlands, CA USA. s/p. [ Links ]
Fernández E., A., J. Zavala H., R. Romero C., A. C. Conde Á. y R. I. Trejo Vázquez. 2015. Actualización de los escenarios de cambio climático para estudios de impactos, vulnerabilidad y adaptación en México y Centroamérica. Centro de Ciencias de la Atmósfera, Universidad Nacional Autónoma de México. Instituto Nacional de Ecología y Cambio Climático. México, D. F., México. 22 p. [ Links ]
García, E. 1998. Comisión Nacional para el Conocimiento y Uso de la Biodiversidad (Conabio). Climas (clasificación de Köppen, modificado por García). Escala 1:1000000. México, D. F. México. s/p. [ Links ]
Garreaud, D. R. 2011. Cambio Climático: Bases Físicas e Impactos en Chile. Revista Tierra Adentro, 93(2):1-14. [ Links ]
Ibarra M., J. L. y F. M. Huerta M. 2016. Cambio climático y predicción de incendios al 2050 en el Bosque La Primavera, Jalisco. Revista Mexicana de Ciencias Forestales 7(37):39-50. doi.org/10.29298/rmcf.v7i37.50. [ Links ]
Instituto Nacional de Estadística y Geografía (Inegi). 2013. Uso de suelo y vegetación. Escala 1:250 000 serie V (capa unión). México, D. F., México. s/p. [ Links ]
Islas B., A., R. Pérez M., A. González H., M. E. Romero S. y E. Velasco B. 2015. Riesgo del hábitat de la Mariposa Monarca (Danaus plexippus) ante escenarios de cambio climático. Revista Ximhai 11(5):49-59. [ Links ]
Jáuregui, O. E. 2003. Algunos conceptos modernos sobre la circulación general de la atmósfera. Investigaciones Geográficas 50: 121-143. [ Links ]
Jiménez, M., A. Chain y B. Locatelli. 2010. Efectos del cambio climático en la distribución de zonas de vida en Centroamérica. Comunicación Técnica en Recursos Naturales y Ambiente (59):32-40. [ Links ]
Kurz, W. A., C. C. Dymond, G. Stinson, G. J. Rampley, E. T.Neilson, A. L. Carroll, T. Ebata and L. Safranyik. 2008. Mountain pine beetle and forest carbon feedback to climate change. Nature 452:987-990. [ Links ]
Magallanes, P. J. 2016. Cambio climático: evaluación de medidas de adaptación. Instituto Mexicano de Tecnología del Agua. Jiutepec, Mor., México. 73 p. [ Links ]
Manzanilla Q., U. y O. A. Aguirre C. 2017. Zonificación climática actual y escenarios de cambio climático para la Reserva de la Biosfera Selva el Ocote en Chiapas, México. In: Ruíz M., L., G. Álvarez G., N. Ramírez Ma. y B. Cruz S. (eds.). Vulnerabilidad social y biológica ante el cambio climático en la Reserva de la Biosfera Selva El Ocote. San Cristóbal de las Casas, Chis., México. pp. 25-66. [ Links ]
Moore, B y G. Allard. 2009. Impactos del cambio climático en la sanidad forestal. Departamento Forestal. FAO. Roma, Italia. 42 p. [ Links ]
Organización de las Naciones Unidas para la Agricultura y Alimentación (FAO). 2003. La fauna silvestre en un clima cambiante. Estudios FAO: Montes 167. Roma, Italia. 114 p. [ Links ]
Panel Intergubernamental de expertos sobre el cambio climático (IPCC). 2007. Climate Change 2007: Synthesis Report. In: Pachauri, R., K. y A., Reisinger, (eds.). Contribution of Working Groups I, II and III to the Fourth Assessment Report of the Intergovernmental Panel on Climate Change. Geneva, Switzerland. 104 p. [ Links ]
Panel Intergubernamental de Expertos sobre el Cambio Climático (IPCC). 2013a. Quinto informe de evaluación del Cambio Climático. https://www.ipcc.ch/news_and_events/docs/ar5/ar5_wg1_headlines_es.pdf (9 de noviembre de 2017). [ Links ]
Panel Intergubernamental de expertos sobre el cambio climático (IPCC). 2013b. Resumen para responsables de políticas. In: Stocker, T. F., D. Qin, G. K. Plattner, M. Tignor, S. K. Allen, J. Boschung, A. Nauels, Y. Xia, V. Bex and P. M. Midgley (eds.). Cambio climático 2013: Bases físicas. Contribución del Grupo de trabajo I al V Informe de Evaluación del Grupo Intergubernamental de Expertos sobre el cambio climático. Climate Change 2013. The physical Science Basis. Contribution of Working Group I to the 5th Assessment Report of the Intergovernmental Panel on Climate Change. Geneva, Switzerland. 27 p. [ Links ]
Panel Intergubernamental de expertos sobre el cambio climático (IPCC). 2014. Impactos, adaptación y vulnerabilidad. Resumen para responsables de políticas. Contribución del Grupo de Trabajo II al 5°. In: Field, C. B., V. R. Barros, D. J. Dokken, K. J. Mach, M. D. Mastrandrea, T. E. Bilir, M. Chatterjee, K. L. Ebi, Y. O. Estrada, R. C. Genova, B. Girma, E. S. Kissel, A. N. Levy, S. MacCracken, P. R. Mastrandrea y L. L. White (eds.). Informe de Evaluación del Panel Intergubernamental de expertos sobre el cambio climático. Ginebra, Suiza. 34 p. [ Links ]
Programa Especial de Cambio Climático (PECC). 2014. PECC. 2014-2018. Versión de Difusión. Secretaría de Medio Ambiente y Recursos Naturales. Subsecretaría de Planeación y Política Ambiental Dirección General de Políticas para el Cambio Climático .México, D. F., México. 91 p. [ Links ]
Sáenz R., C., G. E. Rehfeldt, N. L. Crookston, D. Pierre, R. St. Amant, J. Beaulieu and B. Richardson. 2010. Contemporary and projected Spline Climate surfaces for Mexico and their use in understanding climate plant relationships. Climatic Change 102: 595-623. [ Links ]
Sáenz R., C., G. E. Rehfeldt, P. Duval and R. A. Linding C. 2012. Abies religiosa habitat prediction in climatic change scenarios and implications for Monarch butterfly conservation in Mexico. Forest Ecology and Management 275:98-106. [ Links ]
Sosa R., F. S. 2015. Política del cambio climático en México: avances, obstáculos y retos. Revista Internacional de Estadística y Geografía 6(2):4-23. [ Links ]
Villers R., L. y R. I. Trejo V. 1998. Climate change on Mexican forests and natural protected areas. Global Environmental Change 8(2):141-157. [ Links ]
Received: March 20, 2018; Accepted: September 14, 2018
 Este es un artículo publicado en acceso abierto bajo una licencia Creative Commons
